Tag: monitoring

  • Keeping NoOps From Going Rogue

    Keeping NoOps From Going Rogue

    “We’re NoOps—everything is in the cloud and we have no infrastructure to manage.” Before running that victory lap and shifting everyone to the dev side, consider several NoOps risks carefully. I’m really thinking about teams using all-SaaS stacks, especially in martech, edtech and other areas. However, the rise in microservices and serverless means more teams are leaning toward NoOps. At least a few people on your team should always watch for rogue issues on the ops side of the equation.

    Locked-in Vendors

    Risk: Cloud-based tools in the same category rarely have the same functionality. Once one is selected, you’re committed to its specific features. Moving away from a tool may mean dropping a popular application feature or changing workflow with coding to recreate functionality.

    Mitigation: Evaluate unique features and customized data fields carefully before use. Solving data format differences is relatively easy for common fields. Look for tools with well-documented APIs and integrations or connector support for analytics. If there are no integrations out there, that’s a red flag.

    Ghosting

    Risk: Lock-in becomes a big problem if the vendor ghosts. SaaS startups often meet one of two fates: they are acquired or they crash and burn. A tool critical to your workflow may disappear overnight. In the acquisition scenario, you may have some time and support in migrating from your tool to its successor.

    Mitigation: Always have a Plan B for every cloud-based tool in your stack. Competitors are introducing new tools frequently. A trade study done two years ago may be completely obsolete on today’s fast-moving landscape. Proactive migration to newer solutions may reduce vendor risk and improve features.

    Limited Observability

    Risk: Overheard in a conference recently—Those who develop the code are more motivated to build in useful observability for those in operations if those folks are the same team. In NoOps, that’s not in play. If a cloud-based tool in your stack is down frequently or providing strange results, it may be very difficult to tell what is happening. Observability is often replaced by faith that the SaaS vendor has done its job and you aren’t experiencing a corner case it hasn’t tested.

    Mitigation: Observability and monitoring aren’t the same, but when you don’t have observability inside SaaS tools, monitoring helps. Application performance management (APM) tools are emerging with new ways to build instrumentation around microservices. Create test cases with synthetic data to check your functionality—you’ll need these to provide evidence for the vendor in any bug report.

    Unoptimized Workloads

    Risk: You’re also often at the mercy of the SaaS vendor when it comes to speed of results. It’s a common tripping point to pilot a SaaS workflow with a few users and test cases, and then find out it doesn’t scale when everyone is brought in.

    Mitigation: This is one the biggest NoOps risks where ops expertise pays off. Where is the problem, exactly? Application problems may be candidates for workload acceleration—such as running on a GPU (or FPGA) enabled cloud instance. Reporting problems may be better-suited for an analytics tool, which can be run offline with extracted data.

    Tangled Analytics

    Risk: Every SaaS tool reports different metrics in different ways. Worse, users in a multi-cloud environment face learning and visiting multiple applications to look at data. Different applications report similar facts using different terms. As the tool stack and data sets grow, it takes longer and longer to analyze data.

    Mitigation: Dashboards pay off early with one destination for data across the stack. Earlier, I mentioned the need for integrations or connectors—this should be a requirement for tool selection, both in the stack and the analytics tool. Deciding on which KPIs to track in the dashboard also focuses conversation and minimizes digging.

    Closing NoOps Risks

    There’s also the big topic of multi-cloud security and compliance, probably worth a series of posts by themselves. An Ops team working proactively in tool selection can comprehend many security risks before committing to tools and exposure. More value unfolds over time, as the security posture evolves with discovery of new threats.

    The tech pendulum is always swinging. For many organizations, NoOps swings the pendulum a bit too far from DevOps and leaves risks open. A better philosophy is MinOps, where a small team is deployed, watching for and even anticipating problems.

    I’d be interested to hear if you’ve tried NoOps and been successful over time, or if you reverted to a MinOps approach.


    — Don Dingee

  • The Changing Role of APM in a Microservices World

    The Changing Role of APM in a Microservices World

    Microservices usage has skyrocketed. Fully 91 percent of organizations are using or have plans to use microservices and 92 percent expect to grow their use of microservices in the coming year. It is no longer if but when: 86 percent of organizations expect microservices to be the default within five years.

    With the growing use of microservices and containers, applications have become orders of magnitude more dynamic. It’s not unusual for containers or building blocks of the application to have a shelf-life of less than a week. However, what is great for application development can create challenges when it comes to monitoring ­and diagnosing performance issues in ever-changing applications. How does application performance monitoring (APM)  change to support microservices and dynamic cloud-native apps?

    More Moving Parts

    Small, specialized microservices may facilitate shorter development cycles, continuous releases and greater agility, but when deployed across dynamic cloud infrastructure, the sheer number of moving parts also makes it much more difficult to troubleshoot application performance. Highly distributed and transient containerized components need to be tracked and measured continuously, demanding a big data approach for APM tools. To be effective, monitoring containers and microservices requires high-definition visibility across all transactions, machine learning to pinpoint problems and a shift in focus to users from servers.

    High-Definition Data

    Because the dynamic, containerized environment is constantly changing, measurement data must be collected at high frequencies—think seconds rather than minutes. Collecting infrastructure performance metrics at one-minute intervals, or longer, can distort the real situation and sometimes miss entire events altogether. For example, at low definition, a pattern of recurring but brief spikes in CPU usage will either be averaged out or not register at all—but if detected would be a tell-tale sign of a systemic configuration issue. High-definition infrastructure metrics, collected at one-second intervals, are crucial for a comprehensive view of resource utilization and shared resource dependency issues.

    However, infrastructure metrics alone are not enough. Building a complete view of the operating environment calls for data from multiple sources, including application traces, system metrics, application logs and network behavior. The resulting data set is very large, necessitating big data collection methods and processes. In-line data compression, NoSQL back-ends, non-intrusive client agents and cloud scaling are foundational technologies for modern APM tools.

    Correlating Data End to End

    Big data analytics and visualizations are necessary to process APM data into human-scale patterns and events. Identifying root cause of a performance problem often involves following a transaction from end to end, through multiple containers, shared resources and downstream infrastructure dependencies. Next-generation APM tools dynamically map the flow of every single transaction, through all intermediate relationships. Machine learning and artificial intelligence, while still in their early stages, are proving essential to finding patterns and anomalies in the data, suggesting probable causes and flagging them for human investigation. Combining the best of machine and human skills results in faster problem identification, diagnosis and resolution. IT operations teams benefit with improved application performance, reduced repair times and higher uptime even in dynamic application environments.

    Putting the Focus on the End User

    Legacy APM tools tend to focus on infrastructure components and resources, monitoring the health and utilization of servers, storage and networks. Organizations today, driven by digital competition and customer satisfaction, need to concentrate on the user’s perspective. This means monitoring multiple types of user devices for health indicators and mapping each transaction to the backend system. Automatic instrumentation delivers real-time end user metrics that trigger alerts much earlier than server-side monitoring, and enables more effective prioritization. End user insights also help DevOps and product owners track feature and application adoption rates, compare performance before and after upgrades and directly relate technical issues and investments to business priorities.

    Monitoring Apps for Today and Tomorrow

    Clouds, containers and microservices require a different approach to performance monitoring that takes into account the speed, size and life cycle of application modules. Effectively watching these distributed and transitory processes demands a big data approach that can handle the scale of end-to-end transaction data in modern enterprise environments.

    Legacy APM tools that only take snapshots result in an incomplete view of application reality and lengthen problem resolution times. Instead, modern APM systems collect a complete data set, enabling DevOps to quickly resolve intermittent and complex issues that impact business productivity and user satisfaction. They augment their skills with machine learning to quickly identify anomalies and guide them to probable causes. The results are better application performance, enhanced competitiveness and perhaps most important, increased user satisfaction.

    — Gayle Levin

  • APIs and DevOps

    APIs and DevOps

    As always, there are interesting trends in DevOps, and I wanted to point out one that is starting to bother me: the “API economy,” and how it impacts DevOps decision-makers.

    Traditional infrastructure—SAN, LAN, physical systems, etc.—were generally controlled the best from the command line. While there are a million of them, Cisco IOS is probably the one that you’ll remember best (or you stopped using to read this—just depends upon the shop). When large-scale automation started, these command lines became a bit problematic. After all, scripting was possible, but painful, and often had non-portable hardcoded values.

    Virtualization, and later cloud—and even later SDN and NFV—all made this better, but on a layer over the top of (and normally not well integrated with) the physical layer. Years ago I bemoaned that we had doubled the workload of operations by re-implementing what was already implemented at the physical layer. So we were configuring the physical—even for cloud you have to get to the cloud—and then configuring the virtual.

    Then “Software Devs as Kingmakers” came along, followed by “the API Economy,” and finally we started to see some serious attention paid to APIs by infrastructure vendors that should have done so long ago (some former employers of mine might belong in this group).

    Here is the thing: There is a difference between having an API and having an API that is useful. When shopping for solutions, be they physical or software, don’t allow APIs to be a check box because it’s “the API Economy.” And don’t assume that an API useful to DEVops is what is needed to automate infrastructure. Monitoring APIs—particularly ones that provide you detailed information about an app as it runs—are useful to DEVops, and assuming you have tools that are or can be integrated, might provide value to devOPS.

    But monitoring is not management. devOPS is increasingly automated, and increasingly needs viable APIs that can help them deploy/configure infrastructure. Vendors are responding, but the quality of APIs at this point in time varies widely. So make certain that evaluation looks at APIs available with an eye to suitability to task. devOPS needs management and might be able to use monitoring, while DEVops generally needs monitoring and has little use for management.

    This is not 100% true of course, there are a billion different shops, most doing things in slightly different ways, but think of storage (because it can be done in few enough words to fit in a blog)… An app needs access to storage, ways to be notified of storage space limitations, and possibly to metadata. Operations needs to provision, migrate, backup, replicate… The list goes on. These all contribute to the availability and quality of the application, and are all DevOps, but the focus is different. And having a simple “number of blocks free” API will not help with the DevOPS needs even if it helps developers manage a piece of the application.

    But we have more options than we ever did before! So fear not, just watch what your prospective vendors are doing, and check in with long-term vendors on occasion, too—because things are constantly changing, nearly always improving.

    And keep rocking it. Presumably you are working this out already, knowingly or not, or you wouldn’t have time to read this blog.

    — Don Macvittie

  • IoT, Not People, Now the Weakest Link in Security

    IoT, Not People, Now the Weakest Link in Security

    Do a quick search on “people weakest link” and you’ll see a raft of articles in which cybersecurity experts and computer scientists point to employees or end users as the biggest vulnerability. No doubt, people do silly (or outright abusive) stuff and open the door for a variety of enterprise security problems. Spoiler alert: There’s this technology called the Internet of Things (IoT) and it’s a bigger security risk than people ever were. The new theme of this rapidly changing IoT security story is data integrity.

    Increased cybersecurity risk is due in part to the variety of environments IoT applications touch. Most at-scale IoT deployments use some form of a three-tier architecture, with edge, gateway and cloud components.

    • Edge devices are those connected sensors and actuators touching the real world. They are usually small, low-power devices often running a wireless protocol such as Bluetooth, Thread, ZigBee, Z-Wave, sub-GHz, low power wide area (LPWA) networks, cellular IoT technology, Wi-Fi or other protocol.
    • Gateway devices are hubs that groups of sensors connect with. One big role of the gateway is to translate the various protocols from edge devices into Internet Protocol (IP) for transmission into an enterprise network. Gateways also perform a key role in provisioning edge devices securely. Smartphones running Android or iOS often serve as a gateway for consumer IoT devices. For industrial IoT devices, multiprotocol gateways typically are built on a small form factor computer running a real-time operating system or Linux. Edge computing or fog computing architectures use enhanced gateways for more algorithm processing.
    • Cloud platforms are very familiar to most enterprise developers. In IoT apps, data from the edge arrives for processing, storage and presentation. Algorithms can run on a server cluster or in a distributed computing framework such as Hadoop or Apache Spark. Business intelligence and predictive and prescriptive analytics also reside in the cloud.

    In our practice, we see many IoT cybersecurity issues that can be mitigated with proper attention to two areas. The first is shutting down simplistic endpoint attacks by using basic connected device security measures. Avoid edge devices that ship with a well-known default password or PIN—compromising those defaults can be as easy as a battery pull and a factory reset. If a device uses encryption, make sure it doesn’t use a hardcoded key that, if cracked, compromises an entire family. Look for edge devices using over-the-air (OTA) programming allowing for security updates over a long life cycle. As more device developers gain IoT security experience and provide the right features, closing these basic weakest links is easy.

    Now, for the more startling weakest link. When the IoT application runs, is the data any good? According to a just-released survey of 950 IT and business decision-makers, only about 48 percent of companies are confident they can detect an IoT security breach. (BTW, don’t get me started on blockchain; it’s one tool, not a panacea.) A lot can happen before your people get involved. By then, it may be too late.

    Data integrity needs constant monitoring during at-scale IoT deployment, not just during pilot. An easy way into an unprotected IoT network is to add an unauthorized edge device at a gateway, then use it to access other devices. Gaps in end-to-end encryption are also easy exploits. Untrustworthy public cloud elements are also bad news—a big reason we recommend hybrid cloud architecture. A private cloud layer gives you more control over algorithm performance and data stream security. Presentation and archiving can be left to a public cloud layer.

    Bad data can come from either a compromised or faulty device. It propagates quickly across a system, and when an unwitting user at the presentation layer runs a business intelligence tool on it, the bad data could cause issues. How do teams hunt down vulnerabilities and faults that lead to corrupted data and results?

    • Hire a penetration tester, preferably a contractor removed from your day-to-day development who can objectively assess your architecture during pilot and reassess it during deployment.
    • Ensure your architecture can tolerate edge device or gateway failures without ripple effects in algorithms; in other words, protect the application from prolonged operation on bad data streams.
    • Before turning AI loose on automated decision-making, consider an AI-based IoT security analytics tool to spot anomalies and quickly bring people into the loop.
    • Retarget at least part of your cybersecurity experts to ongoing data integrity efforts and help them stay abreast of IoT technology and trends.

    This all sounds like a good job for DevOps, doesn’t it? You know what to do about people; now you’ll need to work magic with devices. The long-held security axiom that people are the weakest link is no longer true when IoT applications run unattended all the way to presentation. There are a few exceptions when people have more interaction at the edge, particularly in the medical device arena. Generally, we’ll see bigger and bigger IoT applications with more data, more processing and less interaction with people.

    If someone on the IoT says there’s a security hole you can drive a truck through, they may mean it literally. Data integrity measures will be critical for DevOps teams moving forward. Do you agree? What types of data integrity issues are you seeing in IoT applications?

    — Don Dingee

  • Best of 2018: Log Monitoring and Analysis:  Comparing ELK, Splunk and Graylog

    Best of 2018: Log Monitoring and Analysis: Comparing ELK, Splunk and Graylog

    As we close out 2018, we at devopsy.kinsta.cloud wanted to highlight the five most popular articles of the year. Following is the fifth in our weeklong series of the Best of 2018.


    As organizations face outages and various security threats, monitoring an entire application platform is essential to understand the source of threat or where the outage occurred, as well as to verify events, logs and traces to understand system behavior at that point in time and take predictive and corrective actions. Monitoring the logs and logs analysis are important for any IT operations teams to identify intrusion attempts and misconfigurations, track application performance, improve customer satisfaction, strengthen security against cyberattacks, perform root cause analysis and analyze system behavior, performance, measures and metrics based on the logs analysis.

    According to a Gartner report, the market for monitoring tools and APM tools is expected to grow to $4.98 billion by 2019, and log monitoring and analytics will become a de facto part of AI Ops. Log analysis tools are emerging as a low-cost solution for monitoring both application and infrastructure (hardware and network).

    There are mix of commercial and open source tools available as the log monitoring analysis tools market has matured. Some of the key features of log monitoring tools include powerful search capabilities, real-time visibility with dashboards, historical analytics, reports, alerts notifications, thresholds and trigger alerts, measurements and metrics with graphs, application performance monitoring and profiling and tracing events. This article focuses mainly on the differences in log monitoring tools ELK, Splunk and Graylog.

    ELK, Splunk and Graylog

    Elastic has put together arguably the most popular log management platform for both open source and commercial (cloud and enterprise) log monitoring tools. The Elastic Stack—more commonly known as ELK Stack—combines Elasticsearch, Logstash and Kibana. Elasticsearch is a modern search and analytics engine based on Apache Lucene, while Logstash provides data processing and enrichment. Kibana offers logs discovery and visualization.

    Splunk is a platform for searching, analyzing and visualizing the machine-generated data gathered from the websites, applications, sensors, devices etc. covering the entire infrastructure landscape. It communicates with different log files and stores files data in the form of events into local indexes. It provides the easiest way of search capabilities and has wide array of options to collect logs from multiple sources. Splunk is available in both SaaS and enterprise editions.

    Graylog offers open source log monitoring tools providing capabilities similar to ELK and Splunk. Graylog performs centralized log monitoring; where Graylog is used for data processing and Elasticsearch, MongoDB used for search and storage. It provides log archival and drill-down of metrics and measurements.

    The below table provides the comparison analysis based on the open source/free trial editions of ELK, Splunk and Graylog.

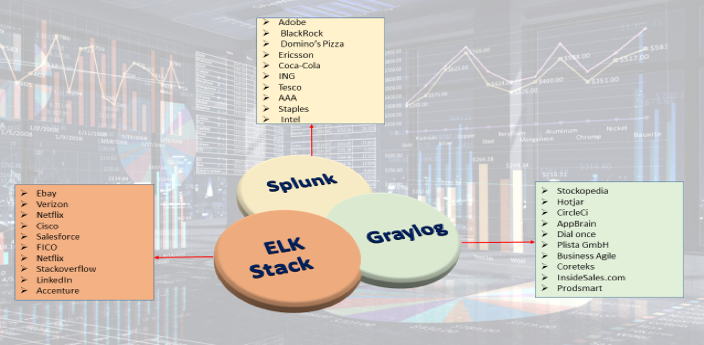
    Top 10 Companies using log monitoring tools (ELK Stack, Splunk, Graylog). Information source collected from ELK, Splunk and Graylog websites.


    Features Comparison

    Features Elastic Stack Splunk Graylog
    General
    License/Edition Available Open source, Commercial

    Cloud: based on the cluster (memory, storage, data center region)

    Enterprise: pricing based on / instance

    Free Trail: Available for 14 days

    Commercial

    Free: 500MB indexing / day

    Splunk Cloud: Pricing based on ingested data to cloud / day & Free Trial of 15 days with 5GB data

    available for search & analysis

    Splunk Enterprise: Pricing based on ingested data


    Open Source: Based on daily volume, price per month

    Enterprise: Free for Under 5 GB/day

    Implementation Language & Logging Format Java

    JSON

    C++, Python

    JSON,.CSV, Text file

    Java

    GLEF-Graylog Extended Log Format

    Community Support

    Enterprise Support

    Available: Well Documented

    Available 24* 7 Support


    Available: Well Documented

    Available: Direct access to the Customer Support Team

    Available: Well Documented

    Available : Unlimited Support from the Graylog Engineers

    Supported Server Platforms All OS-x, Window, Red hat Linux,OS Solaris and Windows Linux ,Ubuntu, Centos, Windows
    Ease of Configuration Need to set up Elasticsearch, Logstash, Kibana, beats with cluster configuration and medium complex to setup. Single platform with server and forwarder from clients, with less complexity to set up. Need to set up Graylog – Graylog web server, Elasticsearch, MongoDB and medium complex to set up.


    Basic Components Involved Elasticsearch – Search and storage

    Logstash – data processing

    Kibana – visualization

    Beats – logs collector and shipper

     Splunk Server

    Splunk Forwarder

    Graylog – Data processing and web interface

    Elasticsearch – log storage

    MongoDB – Configuration data storage

    Data
    Data Collection Beats, Logstash, Elasticsearch Ingest nodes


    Using app-add-ons and Splunk forwarders


    GELF TCP/UDP

    Message Inputs & Content Packs (inputs, extractors, outputs streams, dashboard configuration)

    Graylog Side car


    Data Formats Common Log files format

    Ex: nginx, tomcat logs common formats.

    Accepts any data type including .csv, JSON, log  files , xml, etc. Common log files formats. Ex: nginx [ error_logs, access_logs]

    Syslogs, rsyslogs, GLEF format

    Additional Data Inputs HTTP,TCP, Scripted inputs, Syslog input HTTP, TCP, Syslog input, various Log stash plugin


     GLEF Kafka, GLEF HTTP, Beats, Message Inputs, rsyslog and syslog-ng
    Data Base & Database Schema Creation With Fields Elastic search – document oriented DB

    Schema defined in the specific beats plugins / log forwarders.

    Splunk uses built-in data structure, and stores the indexes to disk.


    Elasticsearch – to store the logs

    MongoDB – storing metadata and dead letter queue messages

    Schema defined in the specific content packs

    Data Correlation

    & Aggregation

    Done through Aggregate filter and logstash correlation event filters Done through index event correlate commands

    Decorators.

    Done through aggregate filters, decorators.
    Centralized Logging Support Available with log shippers Available with Splunk Enterprise Forwarder, Universal Forwarder Available with Logs collector Graylog sidecar, RSyslog.
    Data Import / Export Import / Export data from various sources like Influx DB Export / Import can be done through Splunk DB Connect to relational databases GELF output plugin

    REST API

    Data Transport Kafka, RabbitMQ, Redis Persistent Queue

    Processing Pipeline Components

    Apache Kafka, RabbitMQ (AMPQ)
    Data Collection Intervals Real time Stream and in Batches Real time Stream and in Batches Real time Stream and in Batches
    Search      
    Search Capabilities Provides a highly scalable full-text search and analysis engine with Elastic search Offer dynamic data exploration to extract everything as it having its ow search language. Full-text based search on Real-time UDP/GELF logging with Intuitive Search interface
    Search Language Query DSL (Lucene) SPL (Splunk Processing Language) Very close to the Lucene Syntax
    Protocol  Used For Read / Write operations REST API, HTTP API  REST API, HTTP API HTTP API, REST API
    Log Filter

    Search filtering

    Grok Filter Plugin


    Search filter with fields levels, saved searches, graphs, etc.

    Filter logs applying transforms to events Uses Drools rules, extractors, fields filter

    Blacklisting,


    Visualization      
    Reporting

    Historical Data Management


    Available in X-Pack component

    Quickly generate reports of any kibana visualization or dashboard and any raw data.


    Each report is print-optimized, customizable and PDF-formatted


    Built-in feature

    Reports are created for saved search, visualization or dashboard, set up schedule report, configure the priority of schedule report with support on  Historical and streaming data


    No built-in reporting capability

    REST API can be used to generate own reports on the history data and streaming data.


    Alerting Supported through X-pack / watcher configurations can be created

    Integrations available to send alerts to AIOps tools

    Built-in feature, support real time or scheduled alerting

    Integrations available to send alerts to AIOps tools

    Built-in feature

    Alerts raised based on stream

    Integrations available to send alerts to AIOps tools

    Monitoring
    Server, Device Logs Monitoring Uses Metricbeat, Filebeats for capturing server-related logs Using Splunk Insight For Infrastructure Uses Graylog Beat , NXlog
    Network Logs Monitoring Captures network logs through Packetbeat Uses Splunk MINT to capture network logs  Uses SNMP & netflow Plugin
    Cloud Logs Monitoring Using Logstash, Filebeat, modules Configurable via add-ons in Splunk, for different clouds


    Plugins available to pull logs from cloud.
    Containers Log Monitoring Using Logstash, File Beat & Metric Beat, Logstash processors for Docker logs Splunk logging driver for Docker Uses Filebeat & Native Graylog (GELF logging driver) Integration
    Kubernetes Orchestration Monitoring Using Fluentd, metric beat to ingest logs from Kubernetes Using collector built for Kubernetes Using Filebeat collector sidecar
    DB Log Monitoring Enabled through Filebeat modules, Logstash Enabled through Splunk add-ons for different databases and Splunk DB connect Enabled through Add-on plugins and GLEF libraries for different databases including mysql, mongodb, etc.
    End User Transactions Monitoring, Application Performance Monitoring Enabled through APM and different beats, Logstash correlation, X-Pack components. Enabled through Splunk App for Synthetic monitoring, Splunk ITSI Modules, Splunk MINT SDK. Application logs and add-ons from marketplace.
    Analytics

    (Causal Analysis,  Anomaly detection, etc)

    Supports Machine Learning via X-Pack. Splunk IT Service Intelligence Modules provides machine learning algorithms for anomalies, etc. No out-of-box machine learning support
    Others
    Customization / Extensibility Can create customized dashboards with Kibana controls and search queries.


    Custom Metricsets and Plugins


    Custom rules can be created to define thresholds and alerts


    Can extend / integrate with other tools via webhooks / plugins and programmatic access via REST HTTP/JSON API


    Hosted Elastic Stack provides out-of-box user management features, via X-Pack.


    Flexible to add/ edit new components and views to Splunk dashboards using SplunkJs stack and Javascripts.


    Can create custom metrics indexes and collect data using statsD, collectD.


    Can extend / integrate with other tools via webhooks / plugins and programmatic access via REST HTTP/JSON API with 1000+ add-ons.


    Out-of-box user management.

    Slunk Enterprise Security


    Flexible to add Custom dashboards based on stream using widgets, graphs, CLI stream dashboards.


    Can create custom index models, custom extractors with metrics needed using REST API, content packs.


    Provides few out-of-box alerting with default conditions with custom alerts defined on the streams and conditions.


    Plugins are available in Graylog, to integrate with other tools


    Provides user-management, LDAP and other authentication mechanisms (single-sign on/two-factor) integrations.


    Scalability Supports scalability(horizontal) and high availability with master / slaves cluster. Scalable with distributed deployment of Splunk Enterprise components for data input, indexing and search. Scalable with multiple nodes on ES, MongoDB, Graylog server, along with any queues (Kafka / RabbitMQ).
    Backup / Restore Can take snapshots backup of indexes to any external repository such as S3, Azure, etc.

    Retention on ES through Elasticsearch curator.

    Supports backup of configuration, indexes, warm db buckets based on policies. Archival Plugin available in Graylog Enterprise, to back up indexes and restore to new cluster, via web UI, Rest API


    Log monitoring is very essential as part of full stack monitoring, which can provide better insights for faster troubleshooting. The choice of log monitoring tools will depend on your requirements, infrastructure, price and monitoring and maintenance needs. Elasticstack, Splunk and Graylog have enterprise-ready platforms and solutions for log monitoring, and all are widely used across multiple enterprises and domains.

    — Ritu Bhargava

  • VMware Wavefront Adds AI, Distributed Tracing

    VMware Wavefront Adds AI, Distributed Tracing

    VMware has updated its Wavefront monitoring service to include support for distributed tracing along with anomaly detection capabilities enabled by machine learning algorithms.

    Stela Udovicic, senior director for product marketing for Wavefront by VMware, said the addition of the distributed tracing support, now available as part of a public beta, means that a single monitoring service now can provide metrics, histograms and the tracing function required to provide a holistic view of the IT environment. Those capabilities eliminate the need to employ multiple services to achieve the same goal, she noted.

    In contrast, Wavefront makes it easier to search for traces containing a specific service or application programming interface (API) to determine which ones have errors or long response time. Additionally, DevOps teams can filter the trace search to show traces containing spans from a given cluster or shard.

    At the same time, VMware is adding an AI Genie capability that promises to make it easier to troubleshoot existing needs and identify future application and IT infrastructure requirements, said Udovicic. That data is collected in real time and presented in a way that allows even the most novice users to visualize using analytics tools built into the Wavefront services, added Udovicic.

    Wavefront is based on an agentless architecture that in part makes it possible for the service to process millions of metrics, histograms and traces per second. That capability is especially critical in IT environments that have embraced microservices based on containers that tend to expand across an enterprise IT environment, said Udovicic. Wavefront already supports Kubernetes clusters.

    In general, Udovicic noted that developers tend to embrace a variety of open source approaches to monitoring applications as they build their applications. But a SaaS application such as Wavefront makes it easier for enterprise IT organizations to apply monitoring across a broad range of applications. To facilitate that transition, Wavefront provides an OpenTracing/OpenCensus compliant solution that includes a drop-in replacement for the Zipkin and Jaeger distributed tracing software, which is at the core of many open source monitoring tools.

    VMware is clearly betting that increased reliance on AI will push organizations toward relying more on cloud services. Machine learning algorithms require access to massive amounts of data before they can construct AI models capable of accurately predicting events. The cost of collecting and storing all that data, plus the expertise required to train the AI models, are beyond the capabilities of most DevOps teams.

    Most enterprise IT organizations have applied monitoring tools to only their most critical applications, mainly because of cost concerns. But as applications based on microservices proliferate across the enterprise, it’s becoming apparent that all the dependencies that will exist between various application services will need to be continuously monitored. The only issue now is determining how best to achieve that goal as part of an integrated set of DevOps processes.

    — Mike Vizard

  • The (Tool)Chains That Bind

    The (Tool)Chains That Bind

    As DevOps functionality continues to expand, we’re looking at a new vista for freedom of applications. Our apps can be moved around as we need them; we can build-test-deploy on the fly; and we have the ability to monitor whatever is needed. The price we pay is one we gladly take up: implementing new toolchains to drive the transition and getting those toolchains integrated into the entire development and operations process. Yes, we have an entire organizational side, too, but for this blog, we’ll talk about tools.

    Why Tools?

    Why are we going to discuss tools alone if this is about DevOps? Because it is a different set of problems to move from one organizational structure to another versus moving from one toolset to another. While DevOps is giving us independence from a lot of traditional infrastructure issues, the reality is that it is creating dependencies upon the very tools/toolchains we are using to gain that independence.

    Confusing? Let’s try looking at it differently. The new vendor lock-in will be DevOps tools. While they are freeing us from vendor lock-in on several fronts, you are unlikely to make a quick move from, say, Ansible to Puppet or vice versa. It can be done, and some organizations even do a little of both to make sure their options are open. But most shops will pick one and run with it, because that creates a single training and maintenance direction.

    Why Now?

    I (and others) have alluded to this issue in the past, but it is of growing importance as vendors start to take what should be cross-portable tools and customize them to limit portability. Container management, for example, is available on every major cloud vendor these days, but using the vendor’s bundled container service is convenient and more difficult to move away from. That is but one example of many.

    And the importance of these tools/toolchains is growing at the same time that their use is growing. Soon, in a DevOps-heavy shop they will be essential and locked-in as if they were cemented.

    So, What Are You Saying?

    Pick DevOps tools as if they will be there for decades. This is not how DevOps teams are encouraged to think, but you are building a DevOps infrastructure that, if adopted broadly in the organization, will be difficult to move away from to any significant degree. Just like these days you would need a driving reason to port thousands or hundreds of thousands of lines of code, DevOps scripts are growing and the number of DevOps scripts are multiplying. As you fold security, storage and networking into that environment, and build real-time reporting that you are going to rely on for years to come, make certain what you have is good, if not great. In many ways, DevOps thrives on “good enough” without thought to long-term futures, but the investment required to have a fully developed DevOps environment strongly implies that what an average enterprise is doing today will be what it is stuck with for a good long while. That’s not a place for “good enough” if you know there is better out there.

    It’s Not All Unchangeable

    Some bits of the environment can change over time, of course. Better data collation/integration technologies no doubt will take over for whatever you are using for reporting now, as well as AI-based solutions that can plow through the growing pile of machine-generated data to get a systemic view of what is happening. But for the most part, build it like you’ll be maintaining it for years to come, because much of the environment you will be.

    — Don Macvittie

  • DB-Engines’ Latest Industry Results Reveal InfluxData’s Overwhelming Leadership Position in Rapidly Growing Time Series Database Category

    InfluxData Increases Industry Lead with Growing Popularity of 49 Percent; Overall Industry Popularity Nearly 3 Times More than Closest Competitor

     SAN FRANCISCO — Oct. 16, 2018 — InfluxData, a modern Open Source Platform built specifically for metrics, events and other time series data that empowers developers to build next-generation monitoring, analytics and IoT applications, today announced its continued position as the overwhelming leader among Time Series Database management systems, according to DB-Engines’ latest results published this month.

    According to DB-Engines’ October results, InfluxDB continues its unquestioned lead, outpacing the competition with its popularity increasing 49 percent over the past 12 months and 144 percent over the past two years. InfluxDB is InfluxData’s Time Series Database used as a data store for any use case involving large amounts of time-stamped data – including DevOps monitoring, application metrics, IoT sensor data, and real-time analytics.

    The DB-Engines results included rankings of the leading vendors in the Time Series Database category, with InfluxDB’s user popularity ranking nearly 3 times more than the nearest competitor. InfluxDB’s user popularity also scored the biggest increases over the past month and year, as compared to the competitive field.

    DB-Engines is an initiative to collect and present information on database management systems (DBMS). DB-Engines also ranked the overall Time Series Database Management System category, which continues to grow in popularity with a 38 percent year-over-year increase, and a 108 percent two-year increase. Overall, InfluxDB continues to show strong popularity among all databases ranked, increasing its ranking to 36 overall, up from 40 a year ago.

    “When monitoring how well tools, applications, solutions, and hardware/software are doing, you are always looking at data that is time-stamped, making Time Series databases a fundamental requirement to collect, store and act upon that data as efficiently as possible,” said Mark Herring, InfluxData CMO. “Time Series workloads are unique and are best served by a Time Series database instead of a traditional database. The growth in this database segment is proof that users are finding its capabilities important in collecting and storing data that shows metrics and events for IoT sensors, DevOps monitoring, and real-time analytics.”

    Metrics, events, and other time-based data are being generated at an exponential rate, as there is a growing requirement for analyzing today’s complex environments. The InfluxData Platform provides a comprehensive set of tools and services to accumulate metrics and events data, analyze the data, and act on the data via powerful visualizations and notifications. InfluxData’s unique features enable customers to quickly build:

    • Monitoring, alerting and notification applications supporting their DevOps initiatives
    • IoT applications supporting millions of events per second, providing new business value around predictive maintenance and real-time alerting and control
    • Real-time analytics applications that are focused on streaming data and anomaly detection

    InfluxData has rapidly built its developer and customer base across industries – including manufacturing, financial services, energy, and telecommunications – by delivering the fastest growing Open Source Platform that enables customers to derive better business insights, data-driven real-time actions, and a consolidated single view of their entire infrastructure – from applications to microservices, and from systems to sensors. More than 420 customers, including Cisco Systems, Coupa Software, IBM, Houghton Mifflin Harcourt, Nordstrom, and Tesla, have selected InfluxData as their modern data platform for metrics and events. InfluxData is pioneering the shift to time series in a modern metrics and events platform, and is making it possible for customers to become data-driven and take on digital transformation initiatives.

    About InfluxData

    InfluxData, the creator of InfluxDB, delivers a modern Open Source Platform built from the ground up for analyzing metrics and events (time series data) for DevOps and IoT applications. Whether the data comes from humans, sensors, or machines, InfluxData empowers developers to build next-generation monitoring, analytics, and IoT applications faster, easier, and to scale delivering real business value quickly. Based in San Francisco, InfluxData’s more than 420 customers include Cisco, eBay, IBM and Siemens. Visit https://www.influxdata.com/. Twitter: @influxdb.

  • Splunk Aims to Trigger DevOps Processes

    Splunk Aims to Trigger DevOps Processes

    Splunk this week at its .conf18 conference continued a campaign to extend the reach of its operational analytics platform into the realm of DevOps through a partnership with Puppet.

    Spunk also announced the 4.0 release of Splunk IT Service Intelligence (ITSI), which extends a platform for managing IT using machine learning algorithms by integrating it with incident management software Splunk gained via its acquisition of VictorOps. Other new capabilities include support for a set of key performance indicators (KPIs) for tracking metrics such as application workloads and the ability to do root cause analysis on any event the machine learning algorithms predict.

    Andi Mann, chief technology advocate for Splunk, said the alliance with Puppet furthers Splunk’s ambitions to be a primary source of data used to inform automation frameworks that are at the heart of any set of DevOps processes. Over time, Splunk will continue to expand its DevOps partnerships with an eye toward being the analytics platform used to trigger automated processes using frameworks developed by Puppet and others, he said.

    At the same time, Splunk continues to develop orchestration capabilities of its own based on technologies it gained via its acquisition of Phantom. While that orchestration software primarily is used today in a security management application, Mann said Splunk is now looking at applying that software more broadly, as it encouraged developers to build applications using a Splunk Developer Cloud now in beta.

    Mann said that when it comes to machine learning in IT operations, otherwise known as AIOps, the most challenging task ahead is establishing trust. IT professionals are not going to sanction a “black box” approach that doesn’t enable them to see how a machine learning framework is determining what to automate. Because of that issue, Mann said, providing a root cause analysis capability in ITSI is critical.

    The next big issue facing organizations, he noted, is improving the quality of the data being used to inform a machine learning framework. One of the benefits of the DevOps movement is that, as developers take responsibility for both building and running applications, more of them are paying attention to how log data is being created. Mann said the notes developers leave within an application on how to resolve issues are becoming more detailed, a process that Splunk refers to as “semantic logging.”

    Mann noted the goal is to create a closed-loop system where every IT issue eventually creates a ticket in a DevOps system for developers to address. The bridge between those processes will be the chat capabilities provided by the VictorOps incident management platform. In fact, Mann said Splunk is moving from being a provider of log analytics software to being a provider of a continuous monitoring solution that analyzes data both stored in logs and in near real-time using a Splunk Data Stream Processor, which is currently in beta.

    It may take a while for that loop to be completely closed. But it’s clear that many of the tools that IT operations teams rely on today are becoming increasingly DevOps-friendly.

    — Mike Vizard

  • A Vendor Guy Goes To Monitorama

    A Vendor Guy Goes To Monitorama

    I attended my very first Monitorama this year, in Amsterdam, and I have thoughts!
    Monitorama Amsterdam
    Monitorama Amsterdam

    First of all, it’s deeply weird speaking at Monitorama when you work for a vendor in the monitoring and observability space, but you’re not there as a sponsor. This would be pretty odd at the best of times, but the crowd at Monitorama are next-level. They are very comfortable with highly technical content, so they get irritated very quickly with (what they perceive as) marketing fluff. “Down in the weeds” doesn’t even begin to describe it; most people had never heard of the sorts of things that are part of life in enterprise IT (AIOps, Netcool, Patrol or any of our usual suspects), but, on the other hand, everyone I met could engage in a multi-hour argument over which monitoring tool is worst.

    In fact, I would say that one of the highlights of Monitorama was the conversations in the hallway track. This is where all the Twitter loudmouths—I mean, “influencers” and “thought leaders”—who drive this industry congregate. If you manage to get into a conversation with them over coffee or beer, both of which were flowing freely, there can be a real exchange of ideas. I know I learned probably as much from those small-group chats as from the presentations on the big stage. I hope I was able to share some perspective in return.

    Heck, as ridiculous as it sounds, even the dress code was a challenge. At the events I attend as a vendor, there are basically two speeds: full suit-and-tie battle dress or a T-shirt with my employer’s logo. Neither case requires much thought when packing. Monitorama, though? I’m no longer credible in my old Thinkgeek shirts from my sysadmin days, but I’ll be laughed out of the room if I show up in a tie.

    Preparation

    I had answered the Call for Papers with a pitch about AI for distributed systems. Here’s my abstract:

    The IT industry is in the middle of one of its regular swings between centralization and decentralization, driven by increased automation of the network fabric itself, as well as new use cases such as IoT. With more and more processing and autonomy devolved to the edges, old assumptions about how to manage and operate a network have to change. It no longer makes sense to try to forward all the edge alerts to a central location for analysis, but central visibility on the health of the network is more important than ever.

    New techniques in AI-enabled observability hold the promise of helping NOC teams deliver better experiences for users of their networks, without requiring excessive manual work or heavy impact on on Operations teams’ personal lives. Machine learning enables knowledge to be captured and made available in context when it is most useful, accelerating incident resolution and improving user experiences.

    My first hurdle was that, although I have public-speaking engagements at least once or twice a month—and have done for some years now—I normally appear under the flag of my employer. This fact has both pros and cons. On the positive side, I can usually rely on a substantial library of slides that I (and others) have created in the past. I have some known high notes that I will be aiming to hit, and the call to action at the end is pretty explicit (“try our stuff”). The other side of the coin is that, because the audience is aware of these factors at least at some level, I have to work that much harder to earn their attention, as they assume they are being sold to. As a vendor spokesperson, I am also somewhat constrained in how wacky and off-the-wall I can get—although I do always try to push the boundaries. At one speech last year, I talked about bicycles for several minutes, to the consternation of the organizers, until they worked out what I was building up to.

    So I slaved away for some time over a hot Keynote, watched videos from past Monitoramas, consulted people in the industry whose opinions I respect and rocked up in Amsterdam pretty pleased with myself—to the point that I stayed out at In de Wildeman perhaps later than I should have on the night before Monitorama kicked off.

    Not Enough Preparation

    As speaker after speaker took the stage on Tuesday, I sank deeper and deeper into my seat, realizing that I had completely missed the mark—and as if that were not bad enough, several key analogies in my presentation had already been used by the first-day speakers. I did go to the party at Delirium Café, but left early to sleep the restless sleep of the nervous speaker. In the wee hours of the morning, I gave it up as a bad job, and spent several hours basically rewriting my entire talk in the light of what I had seen. Goodness knows what my neighbors thought of me rehearsing my lines, although I tried to keep the noise down.

    Here is the result in Slideshare, or you can watch the video here. That link should take you to the correct time stamp, but if not, scroll to about 5h30′ in.

    Katja Budnikov was also doing amazing sketchnotes (live!) of all the presentations. Here is the one from my session:

    Relief


    In the end it seemed to go down pretty well. I did my level best (honest!) to call on my own now-obsolete experience as a practitioner and on conversations with people who are more current than I am with the nuts and bolts of modern IT, rather than relying on the crutch of vendor boilerplate, and I think I was mostly successful in that.

    If you are working for a vendor and considering submitting to the Call for Papers at this sort of event, whether it’s Monitorama, DevOpsDays or Config Management Camp, I would definitely suggest test-driving your content as widely as possible. You probably have a lot of subconscious reflexes as a speaker that are not appropriate for the sort of audience these events attract. Even when you are conscious of them, it’s hard to eradicate them completely, but do your best.

    In the other direction, while I have enormous respect for the technical level of Monitorama attendees, some of them seemed to be at risk of losing track of the big picture. I would not want Monitorama to change its character as a techie’s conference, but I am grateful that we had a few presentations outside that mold, and I hope that I was able to provide some context for how all the wonderful technology gets used out there in the big bad world.

    — Dominic Wellington