Tag: monitoring

  • Cloud Native Tracing and Observability: Why You Care

    Cloud Native Tracing and Observability: Why You Care

    Is observability the new monitoring? Or is observability, and tracing, fundamentally different? Like any IT industry trend, it can be difficult to discern as many jump on the trend bandwagon, appropriately or not. The Splunk .conf 2019 event presented Splunk with the opportunity to bring clarity to the terms and the reasoning behind the acquisitions of SignalFx and Omnition.

    Monitoring is mostly about taking events, telemetry data and established data points and thresholds into monitoring, alerting and problem management processes and tools. Its tried and true, and has progressed with the evolution of typical monolith, distributed apps and systems. Enter cloud-native applications, composed containers, microservices and service meshes. With great flexibility comes complexity, and cloud native isn’t immune to such an adage.

    What would have been a monolithic application is now shattered into hundreds or even thousands of smaller pieces of application and app technology software. The complexity of externally monitoring cloud native quickly surpasses the capabilities of most monitoring approaches.

    Observability, as recently acquired SignalFx CTO Arijit Mukherji shared this week, is built upon three pillars: metrics, tracing and logs. Metrics show when you have a problem, tracing points you to the problem and logs help find the root cause—a reasonable way to define and segment observability. It also, not surprisingly, fits well with the logic of Splunk plus SignalFx plus Omnition.

    To move beyond monitoring requires instrumentation, built into the software and APIs as part of the software creation process, a DevOps process. SignalFx in part brought Splunk auto-instrumentation, which during run-time, identifies frameworks and libraries in use within applications and can capture tracing instrumentation. Omnition brings even deeper tracing chops to perform tracing across large service meshes of microservices. Add Splunk’s capability to correlate data across the business, applications and operations data and you complete the picture with the ultimate goal of making observability easy for developers.

    The above might explain why developers, ops and DevOps care about observability and tracing, but should the business care? SignalFx CEO Karthik Rau connected the dots nicely during a conversation this week. Digital transformation strategies require speed and agility, but also demand more risk-taking. Confidence in risk-taking comes when accompanied by the ability to respond rapidly to changes and failures. A software deployed 10 minutes ago may need to be backed out or corrected rapidly when the users’ experience goes negative. That requires a rapid determination of what the problems is, and the ability to take immediate corrective action, including automated action.

    Cloud native and DevOps not only enable disruptive, digital transformation strategies but must be accompanied by rapid and automated responses when negative business and customer impacting conditions occur. Customers don’t care when CPUs are taxed, but they do care when a mobile app’s responses fail or are slow. The move to cloud native is served well when backed up by such capabilities to respond in near real-time when problems occur.

    — Mitchell Ashley

  • Four Steps to Implement an Observability Strategy for Microservices

    Four Steps to Implement an Observability Strategy for Microservices

    You’ve finally decided. You’re making the move to microservices and re-architecting your entire infrastructure. Some services will still be on-premises (those databases and their legacy apps are never moving), but a cloud-based microservices architecture will allow your teams to build and bring new products to market faster.

    But how do you handle the complexity that comes with cloud and microservices? You know you need a strategy for monitoring and managing the complex dependencies and ephemeral nature of your new architecture, but you don’t know where to start. What’s more, you don’t want to spend time and money now only to realize a few months down the line that you’re on the wrong road. Your investment needs to be future-proof.

    You need to implement a strategy for observability. Observability goes beyond monitoring to give you greater operational insight, leading to shorter incidents, fewer quality problems, a better product and happier customers. Your company has unique observability needs, which means how you approach your observability strategy will also be unique. As is usually the case, it’s important to start with a roadmap and goals. Based on my experience, the following four things are key to making a considered, comprehensive observability strategy that’s built for the long haul.

    Choose an Observability Platform that Fits Your Future

    Perhaps counter-intuitively, the right platform isn’t necessarily the one that’s the right fit for you today. If you’re investing in new technologies such as microservices, containers and Kubernetes, you’re going to see a significant increase in the scale and ephemerality of your environment. A monitoring platform that may suit your current infrastructure likely won’t be able to keep up and meet your future needs. Instead, consider how your infrastructure will look three, four or even five years down the road, and then select the platform that best fits that long-term strategy. It doesn’t matter if you choose a commercial tool or an open source one: What matters is that you give considered thought to your future infrastructure and choose a platform that can address the future needs of your environment—and protects your investment at the same time.

    Monitor the Metrics that Really Matter

    If you’re still in the early days of your shift from monitoring to observability, you’re likely taking a service-based approach, monitoring specific pieces of your ecosystem with a focus on individual incidents. The real value of observability is the ability to provide visibility into big-picture issues, such as measuring user experience, performance against SLOs and other key metrics important to the business. In modern environments, small upticks in a microservice can cascade into increased latency for an entire product, a specific feature, or even a specific customer. Having an observability platform that measures and collects data across multiple dimensions–e.g. customer/business-specific, application/service specific and infra/host/container specific–will allow you to understand the telemetry in many different ways. The platform should also aggregate the interactions between your services and unlock a wealth of data for engineers to investigate when issues do arise, and provides visibility into the metrics the business cares about most

    Embed Observability into Your Incident Management Process

    Incident management is a hot topic right now. I speak with CTOs across organizations and industries who have fantastic tools that provide detailed telemetry, but everything breaks down when an incident occurs. They need to better embed observability as a part of their incident management process. For example, ask your incident management team how observability helped in a given incident and record those results. This keeps track of the ongoing benefit. Next, ask how observability could be improved to get the team closer to the crucial clues they need during an incident. And finally, make sure to fold these items into your remediation plans so the team has a clear playbook when incidents do occur.

    Establish a Culture of Observability Across Your Organization

    Simply deploying a new technology of any type is not enough. You need to ensure you’ve built the appropriate processes and norms around the new platform to ensure its success—this is especially true with observability. Modern observability platforms can be incredibly powerful in providing insight into the performance of your ecosystem, but without an investment in your organization’s ability to use the platform, you’ll barely scratch the surface of its true value.

    Observability requires ongoing investment and improvement. Start by building a core group of champions, then fold training into onboarding, continuing education or brown-bag sessions. Using subject matter experts to create the content is a good way to get everyone off on the right foot. Use the output from observability tools in company meetings, team syncs or support settings to keep everyone on the same page. This sort of standardization raises the collective skill of the entire organization and demonstrates the value of observability to those who are not already on board.

    Following these four steps will set you off in the right direction on your observability journey. If your organization is like most, you keep an eye on what you think could go wrong. While that’s unquestionably important, a mature observability strategy will give you an insight into previous unknowns and help you more quickly understand why incidents occur. And as you continue on your observability journey and your understanding of what and why things break improves, you’ll be able to implement increasingly automated and effective performance improvements that impact your company’s bottom line.

    To learn more about containerized infrastructure and cloud native technologies, consider coming to KubeCon + CloudNativeCon NA, November 18-21 in San Diego.

    — Arijit Mukherji

  • How Monitoring and Observability Feed Each Other to Create a Holistic Approach to Visibility

    How Monitoring and Observability Feed Each Other to Create a Holistic Approach to Visibility

    Monitoring versus observability is a hotly debated topic. It’s been argued they’re two distinct things—the former just a high-level overview of a problem after the fact, while the latter enables you to be proactive. Observability has also been dismissed as jargon, much how DevOps sounds to the seasoned operator.

    The thing is, the whole debate misses the point: it’s not monitoring versus observability–the two are not mutually exclusive, but symbiotic. Like the Ouroboros—the ancient Egyptian symbol of a snake eating itself—monitoring and observability both feed each other.

    Monitoring tells you what’s broken and where you need to have a higher degree of visibility. In other words, if something is broken and you’re having difficulty telling why, you need to increase visibility (i.e., by adding more checks and instrumentation). The same can be said for observability—a term used to describe telemetry, event logging and trace data (and, it can be argued, in many ways a subcategory of the traditional sense of performance monitoring). Observability gives you the richest context, but the difficulty is in understanding the holistic view—AKA, where to look next.

    Say your observability tool shows 99th percentile latency and you see a huge uptick: you have to guess as to why there’s such an increase. Based on your own operator knowledge, it’s either the network introducing the latency or the database is unable to respond in a reasonable or consistent time—for example, the disk could be slow or you’re on a multi-tenant system and someone is consuming CPU time.

    The difference with monitoring in this scenario is it would let you know you exceeded your trend on latency, therefore something has gone awry. It’s the same path, but you still have to make logical jumps based on your own experience—unless you’ve gone ahead and contextualized these from the get-go by creating runbooks and checklists for certain failure scenarios. If a monitoring check is properly created it will provide guidance as to what to look at first, then the observability tool gives you the much lower-level insight to go through each of those prescribed steps. Another way to look at it is monitoring as step one and observability as step two. This way, you can see how monitoring and observability feed each other, rather than existing as wholly separate concepts or toolsets.

    It all comes down to context. Traditional tools for monitoring and observability encompass everything from traditional logging to telemetry data, but none of that matters unless you have context as to why a certain behavior is happening. With this traditional approach, your users become your monitoring–tweeting at you when your site is down—and that’s bad for business. You’re still going to have to guess the context, spelunking through a multitude of data points to figure out what went wrong. It’s a polarizing topic—perhaps not quite as polarizing as monitoring versus observability—but there is such a thing as too much data. My experience has taught me a curated approach to monitoring and observability makes better use of resources and helps combat alert fatigue.

    Context is key. Monitoring is the “what is down?” and the context that helps lead you to determine your “why.” Observability tooling lets you dig further into those whys. A modern solution needs to go beyond just alerts to offer rich context and actionable insight.

    Pairing monitoring best practices with an effective observability solution can both tell you something is wrong and offer rich context. You get to the why faster, making it easier to arrive at the right conclusions in a timely fashion. One approach that marries the concepts of monitoring and observability is to apply workflow automation principles to monitoring. Operators need to have the tools to automate their monitoring workflows (such as auto-remediation), and reserve alerts for complex tasks that can’t be automated.

    By laying aside the debate of monitoring or observability and acknowledging the ways in which they feed each other, operators can have a holistic view and deep context into their systems—ultimately improving their workflows and offering better end-user experiences.

    — Sean Porter

  • New Relic Extends Observability Reach and Scope

    New Relic Extends Observability Reach and Scope

    At its FUTURESTACK 2019 event in New York today, New Relic announced it has extended the New Relic One Observability Platform to add support for its new Logs, Traces, Metrics and AI module offerings.

    Ken Gavranovic, general manager and senior vice president of products for New Relic, said his company is committed to extending the breadth of a programmable platform to address DevOps requirements flexibly, rather than forcing IT teams to stitch together multiple tools to monitor their applications.

    As part of the effort, New Relic also is making it possible for customers to build applications using the data New Relic stores in its cloud platform using a framework based on React and GraphQL. The company is also making available a series of open source monitoring applications that organizations can customize in less than an hour using templates it provides.

    New Relic also announced the availability of New Relic Logs, a log management service intended to make it easier for operations teams to correlate log data across application and infrastructure sources. The module will enable teams to run ad hoc searches that return queries in milliseconds without having to switch to another tool.

    At the same time, New Relic announced the availability of New Relic Traces and New Relic Metrics, to help DevOps teams more easily identify dependencies across the IT environment. The goal is to make it possible for teams to understand all the upstream and downstream events occurring across a distributed IT environment using a single platform, said Gavranovic.

    For example, DevOps teams will be able to monitor a serverless computing framework from within New Relic in addition to turning on a feature flagging tool that has been integrated via application programming interfaces (APIs).

    Finally, New Relic AI, available in beta, will bring artificial intelligence (AI) to the platform in the form of machine learning algorithms and predictive analytics to correlate, aggregate and prioritize incident data automatically across multiple tools to reduce alert fatigue and improve mean time to resolution. New Relic AI is already integrated with PagerDuty, Slack and other tools to enable organizations to slipstream this capability into their existing workflows, said Gavranovic.

    By taking that approach, organizations can embrace New Relic as an open platform by organizations regardless of their current level of IT maturity, he added.

    New Relic is clearly betting a single integrated tool for monitoring the entire IT environment will be preferable to integrating a wide range of disparate tools. Gavranovic believes that approach will have even more appeal as organizations embrace microservices to build and deploy applications. Given all the dependencies that exist between all those microservices, monitoring tools will need to reach across applications and infrastructure to enable DevOps teams to discover and monitor all those dependencies in near real-time.

    Naturally, New Relic is not the only provider of monitoring tools with similar ambitions. It is, however, a lot further along in terms of turning monitoring tools into an actual platform.

    — Mike Vizard

  • Measuring Success in DevOps: Top Four DevOps KPIs

    Measuring Success in DevOps: Top Four DevOps KPIs

    There is no news in DevOps concept. Many companies have integrated DevOps to improve and accelerate software development and help drive their digital transformation, and that number continues to grow exponentially. There are now entire tool ecosystems, methodologies and transformation models—as well as endless resources—available to guide companies along the DevOps journey.

    But DevOps success can be difficult to measure. DevOps isn’t a formal framework; it’s more of a culture and a set of practices, and there is limited guidance available to ensure you’re doing it properly or accurately measuring your successes and failures. DevOps also looks different in every organization—no two DevOps shops will be the same.

    However, despite the nebulous definition of what a DevOps organization looks like, there are some core key performance indicators (KPIs) that should be common to all DevOps environments: asset management, monitoring, continuous integration/continuous deployment and continuous security.

    Asset Management

    In this context, asset management means measuring what is automated and how effectively it is controlled. It doesn’t matter if you are using tools such as Puppet, Chef, Ansible or Terraform; what matters is how effectively you use them. These tools allow you to automatically provision bare-metal or cloud assets, as well as join a load balancer and receive traffic. However, you can achieve similar results from Kubernetes or chaining lambda functions. Automation is really about controlling assets to achieve your business goals.

    Whether you’re using on-premises virtualization or cloud workloads, taking the time to streamline your processing cycles down to the minimum hardware required can significantly reduce monthly costs. The higher the percent of your servers, containers, services, etc. are automated, the less time you’ll spend fixing and maintaining your infrastructure. Some of your applications may be uniquely configured to your particular organization, and therefore cannot be automated. However, if applications cannot be automated, it might be time to retire them and build next-generation applications.

    Monitoring

    Should you be monitoring all of your resources? Yes. Should you also filter out the noise? Absolutely. Monitoring agents should be deployed to all of your servers, and if your PaaS tools and other providers have integrations, you should be using them and parsing out unneeded data. The only thing worse than not monitoring anything is monitoring everything without proper filtering.

    Good monitoring should always be coupled with utilizing the information acquired. Capturing logs, parsing them and using tools such as ELK, Datadog or Sumo Logic, for example, give you a large kit that can not only capture and glean useful information from a tremendous amount of data, but can also make decisions and perform predictive analyses. You might learn your stack is operating inefficiently, or not scaling fast enough during peak utilization periods.

    Disparate systems should be aggregated into a common tool, lest you spend valuable time combining information across systems or pulling information from data warehouses to get your insight. Let the tools do that work for you. You should also be using tools such as Logstash to pull and understand application, database and other logs in your stack for meaningful data. If not, you’re limiting your insight into the service’s health.

    Continuous Integration/Continuous Deployment

    Continuous integration and continuous deployment (CI/CD) is the difference between releasing software once a quarter (or year) and performing dozens of releases to production within a day.

    But it’s one of the most difficult indicators to measure, since every environment is different. It is important to understand how many code commits don’t make it past your integration environment. These blockages could be the result of poor programming practices, poor code quality or poor testing. However, if features stay in dev or integration for too long, there is surely an underlying issue. In most cases, it centers around automated testing.

    So, how do you measure good testing? This is one of the most difficult questions enterprises face, especially when automated testing is added after monolithic applications are already written. Essentially, good testing is about creating good business logic and integrating testing that meets most use cases, while covering each function and class. Immediate feedback on failed or successful tests expedites the automation process. The less automated testing is built, the more QA has to test by hand. Failing to integrate good business and integration testing slows down the entire CD part of the pipeline significantly. Also remember shooting for 100% test coverage is unrealistic—over 80% should be sufficient.

    It’s also important to remember applications that are not in a pipeline and must be manually tested will never keep up with the pace of cloud-born innovation. If you are dealing with a giant, monolithic legacy app, it’s time to design its replacement (starting with testing). Pipelines should also have notifications built into them, with chaining logic to react to failures. Tools such as Jenkins, CircleCI, TravisCI and most code repository solutions, such as GitLab, offer rich feature sets to aid in pipeline creation and management.

    Continuous Security

    The easiest way to ensure security compliance is to shift left and resolve security issues in the development stage. Too often, security is applied at production, which means it’s not part of the environment’s end-to-end process. Securing applications and networks at the development level will give you more confidence that applications will interoperate properly at the production level.

    After shifting left, make sure you continuously deploy and monitor your clusters, nodes and pods in a secure manner. Ideally, you have a tool that provides a real-time summary of your cluster’s compliance and security status by looking at workload security and governance checks, cluster worker node CIS Kubernetes Benchmark checks, cluster Ingress controller security best practices and istio security checks.

    DevOps Success Never Ends

    Success in measuring your core DevOps KPIs is not about getting to full automation immediately—it’s about understanding your biggest issues, continuously securing them and improving them over time. DevOps has no end; success requires continuously measuring your progress and improving your environment with the most effective and up-to-date tools. Take control, implement thorough and meaningful monitoring, deliver with confidence and do it securely.

    — Gadi Naor

  • Datadog Fetches Bevy of Additional DevOps Services

    Datadog Fetches Bevy of Additional DevOps Services

    At its Dash 2019 conference today, Datadog launched a series of DevOps initiatives that significantly expand the use cases for the agent software that drives the company’s monitoring services.

    Additions to the Datadog portfolio include Network Performance Monitoring and Real User Monitoring (RUM) services as well as general availability of a previously announced service for monitoring serverless computing frameworks.

    In addition, Datadog announced it is adding Tracing without Limits to its application performance monitoring (APM) and distributed tracing service that allows DevOps teams to search all traces without live sampling and store the traces matching bad user experiences for the long-term.

    Finally, Datadog is adding support for log rehydration and the ability to generate custom metrics from ingested log data residing within its log management service.

    Ilan Rabinovitch, vice president of product and community for Datadog, said the company continues to invest in expanding the core use cases for which its agent software can be applied. Over time, that approach will enable DevOps teams to rationalize the types of agent software they need to deploy to monitor applications, cybersecurity, infrastructure, networking and user experience, he said.

    Rabinovitch noted that interest in extending the reach and scope of Datadog services into the realm of networking is especially high because DevOps teams today have little visibility into how the various software-defined network (SDN) services provided by cloud service providers are impacting their applications.

    DevOps teams are also now being asked to present IT metrics in a way that reflects actual end user experiences. The RUM service being provided by Datadog achieves that goal by making it easier to track front-end latency metrics such as time to interactive and time to first byte, in addition to providing a geographic location, the operating system and browser types being employed by the end user.

    Rabinovitch noted that as organizations become more dependent on digital business processes, they are moving to instrument every aspect of delivering IT services. For example, APM in the past might have been limited to a handful of mission-critical applications running on-premises. Now, as more digital business applications become distributed across both cloud and on-premises IT environments, the need for visibility across interdependent applications and microservices has become more acute, he said, adding most organizations would prefer to consume monitoring as a service versus having to deploy and maintain that software themselves.

    It’s unclear how being able to apply a common base of agent software might accelerate the convergence of job functions within an IT organization. But it does make it easier for cross-functional IT teams to collaborate and troubleshoot IT environments so all members of a team can use a common management platform to identify issues. In many cases, the amount of time saved by eliminating the need to convene a “war room” meeting whenever a new issue is discovered might in and of itself be priceless.

    — Mike Vizard

  • Using Automation to Control Cloud Costs

    Using Automation to Control Cloud Costs

    By building in cost control automation from the very beginning, you can keep your cloud costs low while encouraging innovation.

    Infrastructure automation has become vital for every modern sys admin and operations team. Applications and systems are evolving from single-host mainframes to distributed microservices architectures. This automation has gone from basic operating system installation and setup to full-blown multistep deployments of production code from a single developer’s commit. By automating these mundane processes and eliminating the element of human error, production systems are much more stabile than ever before.

    But why stop at automating deployments? There are other elements that need to be automated, too. One of the main ones is cost control.

    Continually rolling out new infrastructure without ever taking a step back to analyze the cost often leads to the panic-driven cloud-bill-based phone calls from your finance department. Instead, applying automation to your cloud costs can help you to save money, so you never have that unpleasant surprise of a major bill.

    Scaling Up Without Ever Spinning Down

    Developers and operations teams often use infrastructure automation early in application development and deployment processes to get servers and databases deployed and functioning. Modern automation tools aren’t just powerful, but they’re also quick to deploy and fit into your current workflow. This is fantastic, but the problem is the automation effort can taper off once the environments are running—too often, users and teams move on to the next project before figuring out a way to keep costs from getting out of control. Then it’s too late, and users simply accept that money needs to be dumped into the deployment pipeline to keep everything on task.

    Easy-to-use automation is the key to spinning these environments up efficiently. It also can be key for keeping the costs of these environments low. Sure, you may need to keep the production systems scaled up for maximum application performance and customer satisfaction, but what about the test lab, sandbox environment, dev systems, UAT servers, QA deployments, staging hosts and other pre-production workloads? Having giant environments with system sizes that match production can be useful for some testing, but leaving it all running can be easily doubling your cloud costs. This is true for each environment you have, including for elements that are only used for a fraction of the time.

    As your infrastructure automation toolkit grows and evolves, there are a few things you should start building into all of your applications and deployments. These include:

    As this list grows, there’s one more thing you need: continuous cost control.

    By building in cost control automation from the very beginning, you can keep your cloud costs low while maintaining the flexibility required to keep up the pace of innovation. Without this, your costs are destined to rise faster than you intended, which will then cause headaches (and endless meetings) in the future. It may not be coming out of your bank account directly, but saving money at an enterprise organization is everyone’s job. Automating this is the key.

    — Jay Chapel

  • New Relic Doubles Down on DevOps

    New Relic Doubles Down on DevOps

    New Relic today unfurled an extension of its monitoring platform specifically designed for DevOps teams tasked with managing complex IT environments.

    Nadya Duke Boone, vice president of product management for New Relic, said New Relic One, available to existing customers at no additional cost, makes it possible for DevOps teams to now visualize all the data that exists across multiple New Relic accounts their organization has created in a single set of dashboards.

    New Relic One also makes it possible to create an “entity” to track their relationships and dependencies to provide more context to the metrics surfaced by New Relic. That context is critical anytime a major incident occurs because these days so much of the revenue any organization generates is determined by the availability of their applications, said Duke Boone.

    To achieve that goal, New Relic One provides Service Maps spanning entities; search and discovery tools based on universal tag filtering; dashboards through which queries can be launched using visual tools; an ability to more easily extend visualizations; and a new home page designed to make it easy to drill down into various dashboards.

    Other capabilities included in New Relic One include Monitoring for the AWS Lambda serverless computing framework, a Kubernetes cluster explorer and distributed tracing global search.

    New Relic also revealed today it plans to deliver both a log monitoring solution and AIOps offering within New Relic One by the end of the fiscal year. New Relic earlier this year acquired SignifAI to gain access to AIOps platform.

    Duke Boone said all this is now possible because of the investments New Relic has made in developing a persistent store for monitoring platform, which she said represents a strategic initiative on the part of New Relic to expand the scope of the services and capabilities it provides.

    Downtime in the age of digital business directly equates to lost revenues. Organizations that face that challenge typically are at the leading edge of adopting best DevOps practices. That challenge these organizations face today is they are drowning in complexity, a situation that likely will only worsen as organizations deploy cloud-native applications based on containers, she said, adding New Relic One not only serves to make it easier to manage all that complexity, it also makes it simpler for teams within an organization to share best DevOps practices.

    Of course, one of the issues that restrains organizations from adopting DevOps practices in the first place is a reluctance to make IT environments any more complex than they already are. Organizations are demanding that IT organizations become agile enough to support a wide range of digital processes. The challenge they all typically face is the current reliance on highly structured processes that are intended to minimize potential errors. As well-intentioned as that might be, however, they often result in IT organizations being unable to adjust rapidly changing business requirements. The good news is as DevOps tools become more sophisticated, the skepticism of many IT professionals have toward DevOps will continue to quickly diminish.

    — Mike Vizard

  • Open Source Versioning: The Race to Stay Up-to-Date

    Open Source Versioning: The Race to Stay Up-to-Date

    Open source libraries, once shunned as risky and not ready for prime time, are now used extensively across major corporations, including insurers. The reason is simple: In time- and resource-constrained companies trying to stay technologically competitive, it doesn’t make sense anymore to try to reinvent a wheel that’s already been battle-tested. However, having made the commitment to open source code and solution sets, it’s imperative to keep up-to-date with open source library maintenance and updates.

    The Risk of Open Source

    Some active open source libraries are updated multiple times a year. Getting out of date means missing out on newer features. Also, if the gap between upgrades bridges several iterations, some future upgrades may not be backward-compatible, causing functional problems at best and risk exposure problems at worst. On occasion, an out-of-date open source library version can expose a system and a company to attack. In 2017, a major U.S. financial company was hit by a hack that exposed the information of millions of customers. The hackers had exploited a software vulnerability that had been public for a month, but the company had not patched its system in time. There are several other well-known examples of a similar vein.

    Keeping current is not easy. Upgrading may be costly, but falling behind can make it costlier to catch up. The question is, How frequently should one upgrade to the newer versions?

    The Effort and Cost

    One of the reasons companies choose not to upgrade every time there’s a new release is the cost involved. While the open source code itself is free, the effort required in time and resources can be substantial and can take valuable resources away from higher priority business-technology initiatives. An additional concern is that, even though the upgrade is supposed to be backward-compatible, there is no way to verify that without actually performing the upgrade. If there are compatibility problems, then a larger effort ensues involving upgrading, restoring or rebuilding a system. Any large system has to be tested thoroughly after upgrading, and without the help of automated tools, testing can be costly and time-consuming.

    One approach for mitigating these costs and risks is the process of continuous integration (CI) for open source libraries. A good suite of automated testing tools provides a high degree of confidence that nothing has been broken by the most recent upgrade, before it is implemented into any production environment. However, without automated tests that flush out potential issues from upgrading, the risks and costs are high enough that companies have a hard time keeping up and managers become more motivated to delay upgrades than to perform them. That’s why it’s important that companies employ CI and continuous delivery (CD) processes that include robust automated testing.

    Additionally, the use of microservices—an increasingly effective and popular way to construct systems—puts another twist into the efforts and costs of keeping open source libraries up to date. Individually, each microservice might be quick to test. However, if an application has been broken into 50, 100 or even more microservice components, even a small amount of manual work testing each component will add up quickly. Additionally, in an environment that has deployed microservices broadly, there may not be a business need to change some services for months—that is one of the benefits of using microservices.

    The Right Approach to Open Source

    There is a right way to deal with open source library updates that has the benefit of taking advantage of new functionality and code stability in a low-risk, low-effort and low-resource manner as follows:

    Planning: Enterprise and application architects should be vigilant regarding the road maps of any large frameworks that employ open source libraries as a key component to any project or initiative. Proactive identification of open source libraries that may need to be upgraded is key. Likewise, application project managers should make open source library upgrade part of a regular and ongoing project plan. For example, when microservices are involved, they should be classified proactively as services by the libraries they use, as a way to identify the few services that would normally be upgraded first. This has the benefit of providing a few sprints’ worth of feedback before rolling out the upgrades to other libraries.

    Monitoring: Open source version monitoring is essential. There are products that can help to identify and report library versions that have vulnerabilities. Such monitoring can and should be used as part of the CI/CD pipeline and also to monitor artifacts that already are deployed in production. Monitoring processes also can report when newer open source library versions are available, even if the incumbent library has no reported vulnerabilities.

    Automated compatibility triage: It is often too risky to set up production builds to always use the latest version of an open source library. However, separate automated processes can identify new versions, run them through a build and test process and report back the results. If a test fails, the development team gets an early warning that their code is not compatible with the upgrade version. This helps to plan and schedule fixes, and if a vulnerability is discovered in the current version, this kind of proactive planning enables a quicker resolution and turnaround.

    Processes: Strong processes, preferably automated ones, are the foundation of open source versioning. For critical security upgrades, a process must be in place to triage and prioritize identified changes. For other version updates, good processes can help make upgrades easier. For example, a standard and repeatable process may incorporate minor version upgrades into the regular flow of sprint work, thus saving time while mitigating risk.

    Open source versioning can be difficult, but it doesn’t have to be. With automated testing, good monitoring tools and some proactive planning, the costs and risks of staying up to date can be kept to a minimum, allowing companies to reap the benefits of new features and functions.

    — Darius Cooper

  • Wavefront Provides Map for Microservices

    Wavefront Provides Map for Microservices

    VMware announced it is adding a service mapping capability to the Wavefront 3D Observability platform it provides with the Wavefront by VMware monitoring tools.

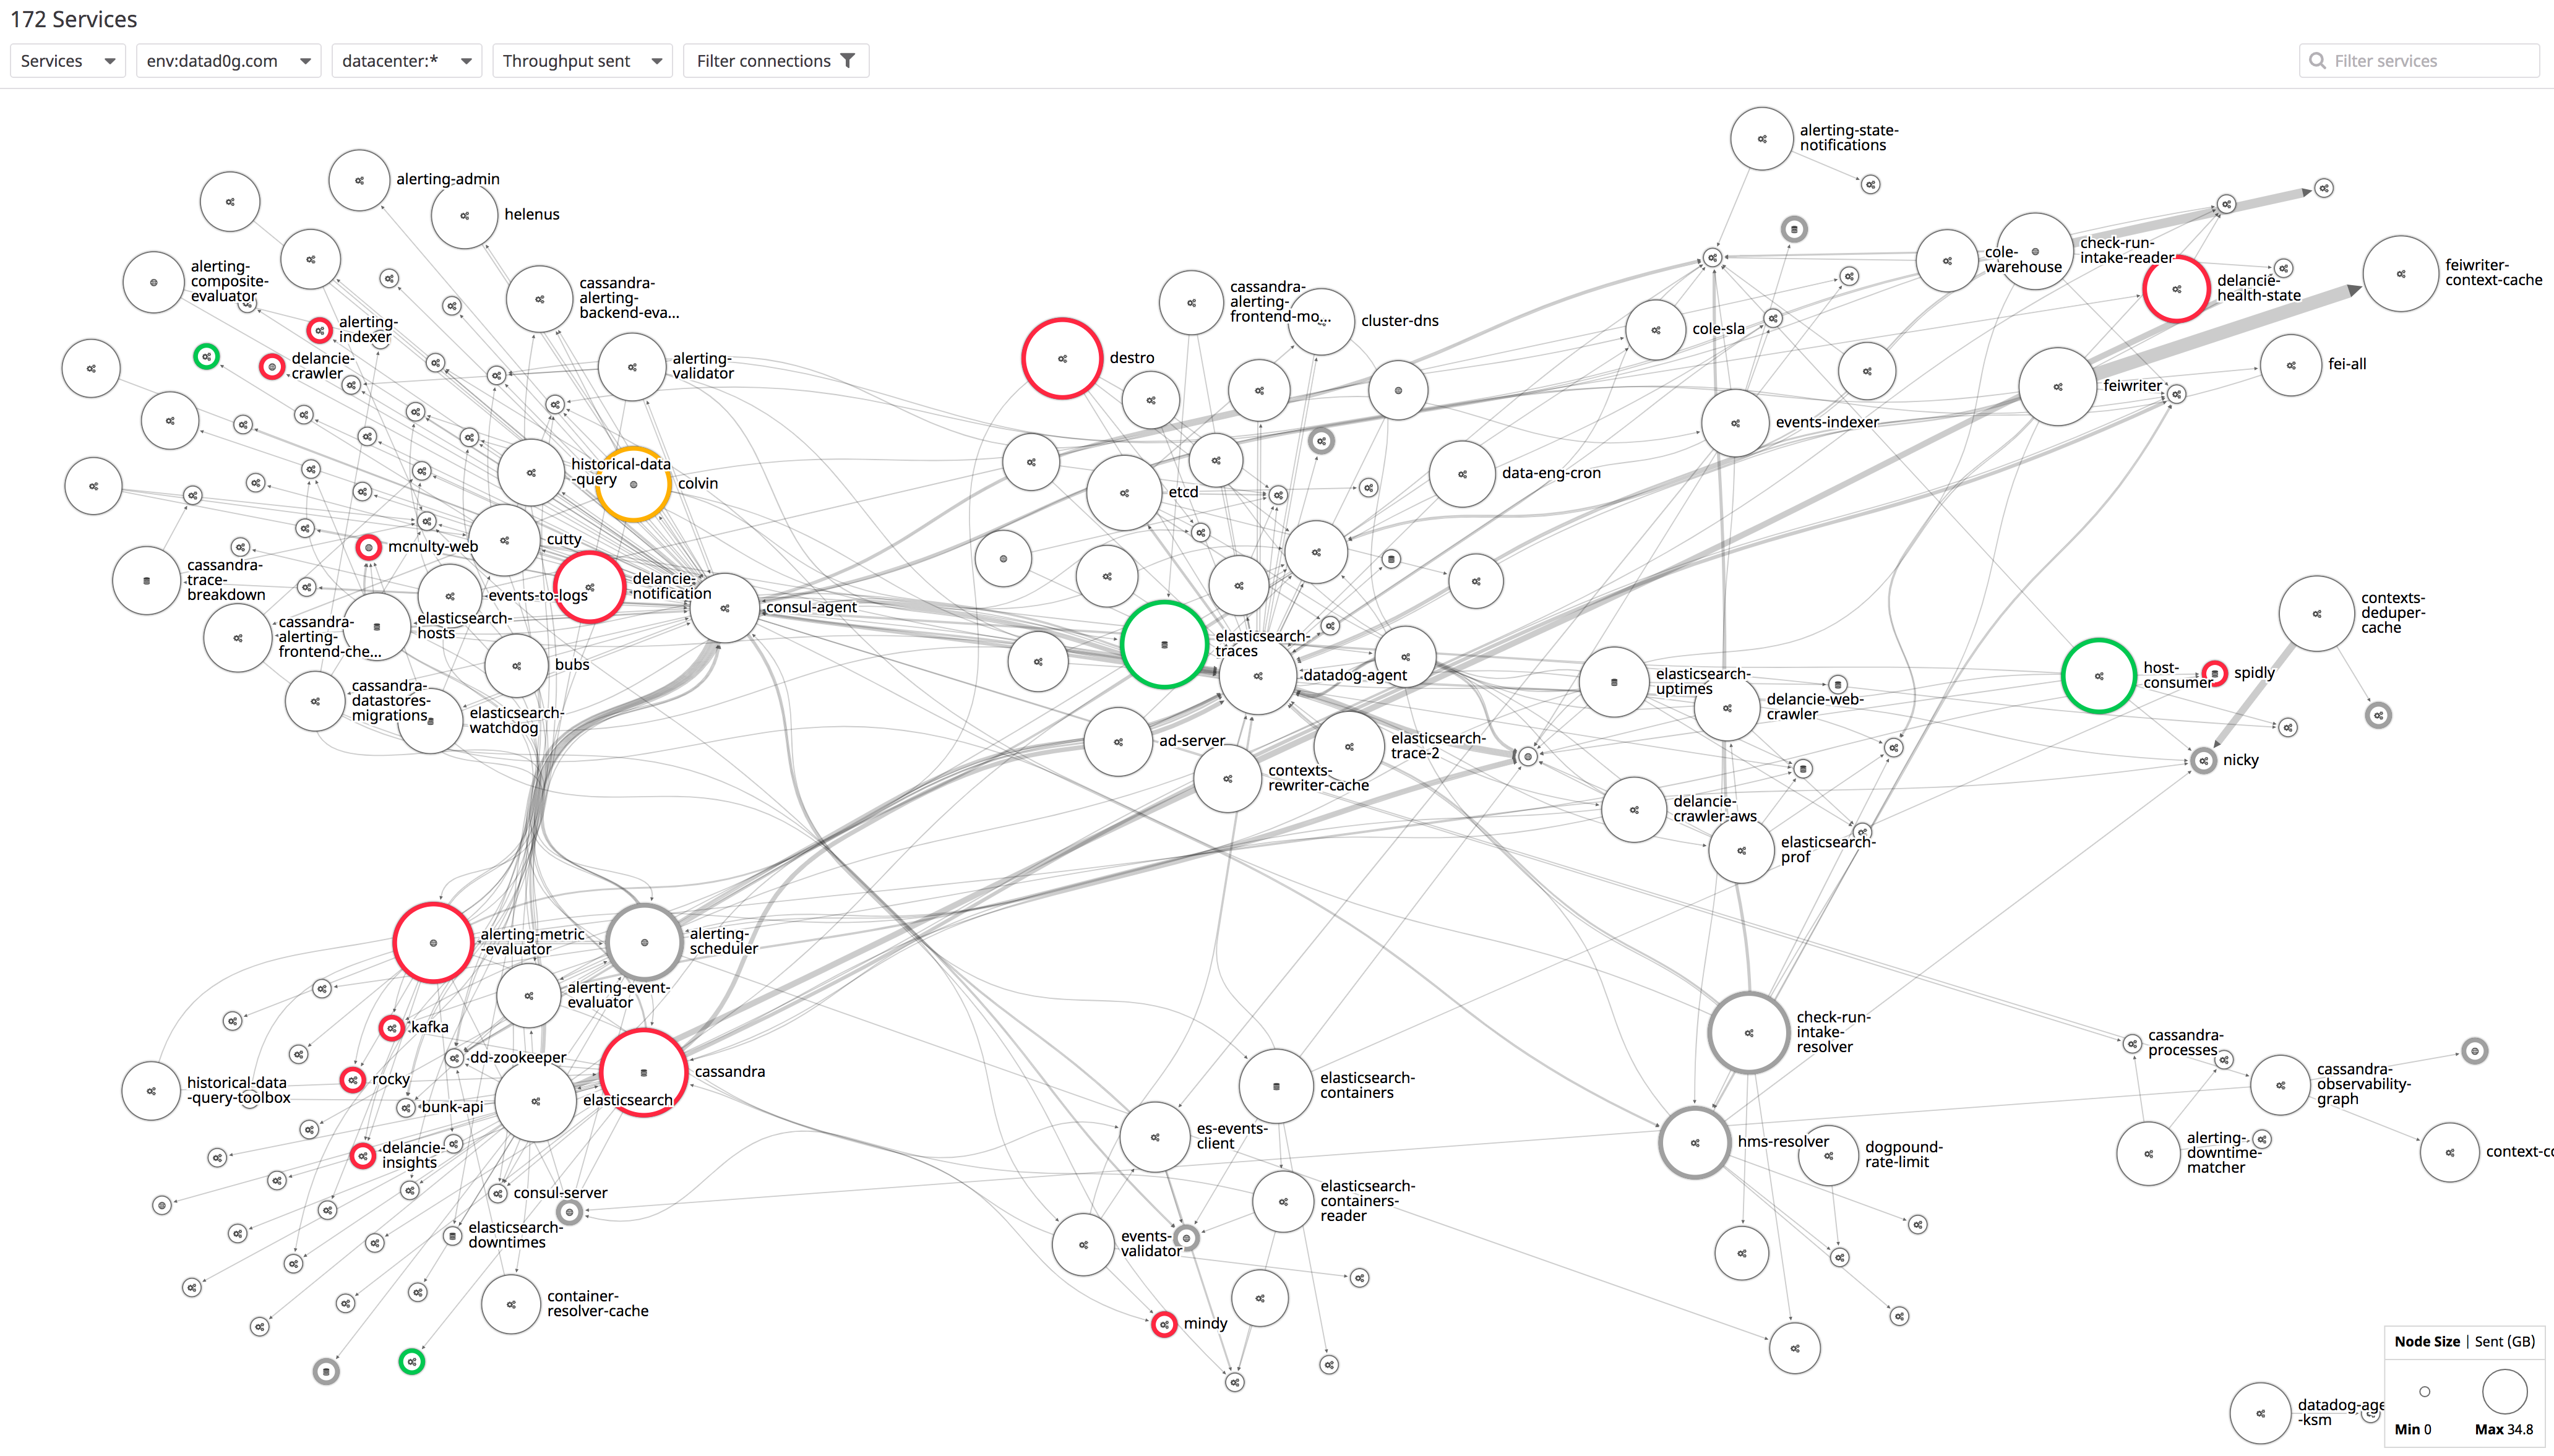
    Stela Udovicic, senior director of product marketing for Wavefront, said Wavefront Service Maps will make it easier for IT organizations to visualize what will soon be thousands of microservices running highly distributed computing environments, including those based on containers running on Docker Engine, connected via service meshes such as Istio or spanning proxy servers such as Envoy.

    Capabilities provided by Wavefront Service Maps include packaged visualization of request flows with a map of service dependencies, built-in tracking of health metrics and view into individual traces to pinpoint performance bottlenecks.

    Accessed as a set of software-as-a-service (Saas) applications, Wavefront by VMware relies on an agentless approach to monitoring that supports all the major public clouds along with providing integrations with platforms such as Kubernetes, GitHub, Slack, PagerDuty, Kafka and Pivotal Application Service.

    Udovicic said by making it easier to visually identify and troubleshoot microservices, IT organizations should be able to accelerate their transition to modern cloud-native applications. Building and deploying a single application based on microservices is complicated enough. Trying to support hundreds of those applications is simply too daunting without the ability to visualize all the interdependencies between those services. Troubleshooting any issue then becomes easier because Wavefront Service Maps is designed to enable DevOps teams to drill down to the traces being employed to monitor the application, she said.

    Earlier this year, Wavefront added support for distributed tracing and machine learning algorithms that also make it easier to identify anomalies within a microservices-based application.

    In terms of adoption of cloud-native applications, Udovicic said there are basically two classes. The first are early adopters who are already highly committed to developing cloud-native applications. The bulk of the enterprise IT community, however, is still in the early stages of building and deploying these types of applications, said Udovicic.

    There’s naturally a high correlation between organizations that have adopted cloud-native application development using microservices aggressively and those that have implemented best DevOps practices. In fact, one of the benefits of a visualization tool is that it makes it easier to bring new members on to those teams. Rather than having to piece together what is occurring in the environment, a new member of a DevOps team can visually inspect each microservice they might be responsible for managing.

    It may be a while before DevOps processes become the dominant default method for managing IT. But as DevOps tools become easier to use, the number of DevOps practitioners should increase steadily. Arguably, one of the reasons DevOps adoption is not as far along as it might be is that the learning curve is still too steep. But as visualization capabilities gets added to the analytics frameworks baked into those tools, it’s now only a matter of time before the number of IT professionals that might be intimidated by DevOps processes starts to decline steadily.

    — Mike Vizard