Tag: monitoring

  • DevOps and faster feedback: fewer problems, better features (part 2)

    DevOps and faster feedback: fewer problems, better features (part 2)

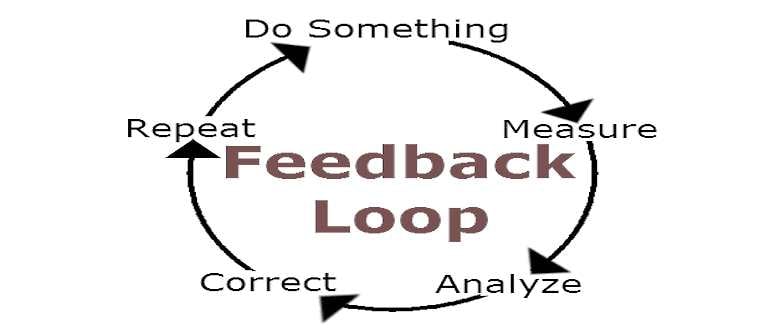
    As the experts established in part one of this series , the tightening of feedback loops through DevOps gives developers a better chance to learn how well their coding choices perform in the context of production environments. This makes for higher quality code in the long-run and constantly improved skillsets among development teams.

    But fast feedback loops don’t just improve the line-by-line coding work the development team puts out. It can also push through a huge boost in the value of the features they’re producing for end users.

    “Feedback loops are important not just for technical feedback or feedback about things not working,” says Aater Suleman, CEO of Flux7 Labs and a professor in computer systems design and architecture at the University of Texas. “There’s also the feedback around what customers are looking form in terms of particular features and whether or not those features are doing well in the market or not.”

    The tighter the feedback loop is about feature sets—and the more quickly the team can release responses to that business-related feedback–the faster the pivot time to account for market conditions. The quicker assessment of how well features are doing gives development teams and the business units they answer to a more accurate barometric reading to decide where to direct programming time. As a result, it isn’t just the quality of work that goes up, but also the business value.

    “With a DevOps flow that allows developers to start seeing feedback from end customers right away, it helps them be more agile on a business level so they can be more strategic about where to spend their actual time,” Suleman says, explaining that this exposes developers to a big-picture view of their work. “You may have the most productive development environment in the world, but if a feature developers have worked on for two months is not going to be liked by the end users, it doesn’t matter how productive the developers were during that time period.”

    Not only that, but it eliminates the hamster-wheel of playing catch-up with competitors’ features.
    “I know of many  companies which still hold to quarterly release cycles. Did you competitor  just release an awesome new feature? Have fun waiting three months to catch  up,” says Curtis Poe, a consultant and Agile development coach for All Around The World. ” In today’s competitive world and fast-paced business environments, do you  really want to playing catch up all the time? Switch to continuous delivery and never worry about a lengthy  release process blocking you from offering what your competitors offer.”
    Poe says that the best DevOps teams can get the most differentiation from the crowd by understanding that they’re not just monitoring technology and code, they’re monitoring people. Namely, end users.

    “Do you sell shoes online and you have a  typical conversion rate of 3.2 percent? What happens if you make a release and the conversion rate drops to 2.5 percent?” he says. “Assuming that nothing technological is going wrong , monitoring business value, when appropriate, can instantly tell your designers,  ‘Hey, moving that button from the left to the right side impacted our sales.’”

    Additionally, that kind of business monitoring makes it more easy to understand the dependencies between technical and business functional aspects of software updates. Then the team can more easily explain to business leaders what technical obstacles stand in the way of functional improvements, and how to overcome them.

    “You always want to deliver the best experience for your customers, and you want to iterate on both the product and the non-functional aspects as often and quickly as possible,” says Arnold Goldberg, vice president of customer engineering for PayPal. “Integrating new features might be the wrong thing to do if, for example, there are challenges with performance, stability or availability.”

  • Advanced Automation – Getting Your Systems to Work for You

    Advanced Automation – Getting Your Systems to Work for You

    In my previous post I discussed how to take your DevOps to the next level by taking it beyond infrastructure automation, to the automation of your deployments and code pushes, through patches and updates.

    And then I promised to make it interesting…so here is the next stage – actually using the extracted data to get your systems to work for you.

    Monitoring Like IT’S YOUR BUSINESS

    Let’s start by discussing what it means to monitor your application, and what kind of data you can extract from it.

    At the most basic level, you want to know whether your application is available for your users. It sounds very basic and simple, but setting it up properly is actually not an easy task. It is intended to give you an answer to the most important question to your business: can my users use the application? Think of it as a big red or green light on your dashboard. Although the answer may seem obvious and simple, but it is not at all. There are all kinds of parameters to take into account when answering this question, for example, what if the system is apparently up and running but the response time is very slow, or what if only parts of the system are actually running. At the end of day, you want to have that kind of an alert “traffic light” that tells you whether your system is functioning – yes/no, up/down.

    System, Application, and Business Metrics

    The green-red traffic light is an aggregation of multiple levels of monitoring. The most basic one is system related. It contains indicators like process availability, CPU and memory utilization, etc.

    The next level of monitoring is application related and is composed of application level KPIs (key performance indicators). KPIs can be anything from the average response time for a user for a certain request, to the number of concurrent database connections. In other words, anything that’s specific to the application and its architecture.

    And then above these, comes the highest level of metrics, which are business metrics. Ultimately these are what’s really important. If your business metrics are ok, then you can assume everything is running fine. Sample business metrics include the rate of failure to register to your website, how many users did a certain operation in the website or how many users executed a specific transaction. If we want to be really specific, then take Google hangout for example, a business metric of theirs would be how many people in a certain timeframe joined or started a hangout.

    Logs to the Rescue

    Logs are often used here as means to collect your metrics and alert about erroneous conditions. Logs usually contain a lot of useful information, but you need to be able to extract it and make sense of it. This means gathering all of the logs emitted from all of your servers, parsing them and looking for specific patterns that will help you generate the KPIs over time. For example, you look for a log message that says “User X signed in”, and by counting these messages you can produce a business level metric for how many users register over time. If you add some more data to the log message, such as the user’s location, or operating system, or anything else for that matter, you can slice and dice data and get deeper insights into how your application is behaving. When logs are emitted in a structured and consistent way (e.g. in a JSON format), it becomes very easy to analyze them and produce the relevant KPIs. There are many toolsthat can help with that.

    From Simple Automation to Orchestration

    That’s where orchestration comes into the picture. At the most basic level, orchestration is a higher form of automation, which helps you setup all the pieces that are related to your application, starting from the infrastructure (VMs, networks, block storage volumes, security groups, etc.), to the platforms your app runs on (database, web server, etc.), and all the way up to the application modules and code. This entire setup is often referred to as a topology. The role of an orchestration framework is to materialize a certain topology. More advanced orchestrators go beyond materializing the topology, and change it to meet the current workloads and needs of the application.

    As you probably gathered by now, monitoring and log gathering are an essential part of any running app, so they should be an integral part of the orchestrated application topology. Since the orchestration process is topology aware, it can wire and configure monitoring for your application components very easily, which is one of its greatest benefits. Going through these process without a global view of the topology can often be time consuming and error prone. Moreover, as the topology changes , you need to reconfigure and rewire your monitoring tools, and a good orchestrator will that for you as well.

    Next Up: Reactive and Proactive Orchestration, The Devops Holy Grail

    Hopefully by now you see the value of orchestration as a higher form of automation. In the next post I’ll dive deeper into the post-setup phase, and discuss how orchestration tools can react to events and monitoring data and adjust the application’s runtime topology to best fit the current workloads.

  • Nagios is not a monitoring strategy

    Nagios is not a monitoring strategy

    When I visit clients to talk about DevOps, I usually ask them what their monitoring strategy is. Too often, the answer I hear is “We use Nagios”. I think Nagios is a great tool, but it sure is not a strategy. Nagios does a good job of monitoring infrastructure. It will alert you when you are running out of disk, CPU, or memory. I call this reactive monitoring. In other words, Nagios is telling you that your resources are getting maxed out and you are about to have issues. Proactive monitoring focuses more on the behavior of the applications and attempts to detect when metrics are starting to stray away from their normal baseline numbers. Proactive monitoring alerts you that the system is starting to experience symptoms that can lead to a degradation of performance or capacity issues which is more preferable than Nagios telling you are about to be screwed. With reactive monitoring, it is not uncommon that customers start complaining about the same time that the Nagios alerts start going off. The goal of proactive monitoring is to head off issues so that customers don’t even notice.

    The next question I ask is “What things are you monitoring?”  A typical answer usually revolves around various infrastructure assets and databases. That’s a good start but there is much more to consider. But first, let’s talk about why proactive monitoring is so critical. In the pre-cloud days we used to ship software to our customers where they would install the software, perform capacity planning tasks, manage the infrastructure, and operate the day-to-day activities. Once we shipped the code we were done. In today’s world, we are no longer shipping product. Instead we are delivering services that are always on. The customer no longer owns and operates the infrastructure and the software. Instead they pay for a service and expect that service to run reliably all the time. To meet those expectations, we need a more robust monitoring strategy. We need to monitor more than just the infrastructure.

    A good monitoring strategy starts by identifying all of the actors who needs access to data and all of the categories of data that needs to be tracked. Some metrics are monitored in real-time while others are mined from log data. Every good monitoring strategy is accompanied with a sound logging solution. In order to perform analytics to predict trends within the data, one must collect various data points ranging from customer usage activity, security controls, deployment activities, and much more. The following presentation goes into much more detail about the different areas that should be monitored and why different actors need these data points to perform their jobs.

    [slideshare id=33320431&doc=monitoringstrategies-0408014v1-140409081614-phpapp01]


    The bottom line is, before building in the cloud, it pays to invest some time into a sound monitoring strategy. I have seen too often where teams don’t think through how to support these highly distributed, always on SaaS solutions and end up delivering software that does not meet the reliability and quality expectations of  customers. Monitoring provides feedback to developers, product owners, operators, and even customers so that systems can continuously be improved. Nagios is great, but there is no single monitoring solution that can implemented to effectively operate today’s always on services.

  • From Simple Automation to DevOps Like a Boss

    From Simple Automation to DevOps Like a Boss

    Automation as We Know It Today

    If you haven’t been hiding in a cave in the last year or two, you’ve probably heard the terms DevOps and infrastructure automation more than once… But even today, infrastructure automation is mostly focused on setup and deployment of complex systems. For example, if you’d like to deploy your application to the cloud, you would likely automate the steps of provisioning the cloud resources, installing the right components on top of these, and then orchestrating the startup of your components – or better known as – cloud orchestration. Take even the simplest application that has a web server and database. After installing and configuring everything, you’d first need to ensure that the database is started, and only then the web server. You’d also need to propagate specific runtime information from the database to the web server, such as the database’s host and port. This stage, for the most part, is where most automation processes focus on today.

    DevOps: Stage Two

    Automation, however, can do much more for you. Let’s imagine, following your initial automation of the setup and deployment of our your application, that you want to make changes to your infrastructure or application. For example if you have a patch you’d like to install to the database or operating system, or if you want to update a piece of your code on your cluster of web servers. Both of these concerns involve pretty complex processes that you need to automate. For an infrastructure upgrade, you would typically roll out the upgrade server by server, take down one server at a time, update it, then restart it. Even though it doesn’t happen very often, there’s still a lot of benefit in automating this process and minimizing the chances of human errors. Pushing new code is a bit different. For starters, you do it much more often, even a few times a day. Also, (no offence), it is likely that the stability and quality of your code is lower than that of an approved patch to the OS or database. So the risk of something going wrong if you don’t automate is even higher with this process. That’s why there are common automation strategies that help you deal with this risk. Two such strategies are the Canary Instance strategy and the blue/green strategy. The former derives its name from the mining days, when a canary bird was sent out into the mine before the miners, to check if the air was toxic or not. So in this fashion, a “canary instance” is chosen, the new code is pushed to that instance alone, and then a number of sanity tests are performed. If these pass, the code is then pushed to a few more instances. If all goes well again, the code is then sent to the rest of the infrastructure. In the latter strategy (A/B), the code is sent to only a part of the servers. In an even more sophisticated approach, the code is only enabled to a portion of the users, for example, a certain geography or time of day. All of this ties into how to setup and manage an ongoing system. But although this process, as well the infrastructure upgrade, can get quite complex, especially when dealing with large scale, live systems, in most organization code pushes and upgrades are still not automated. But there are more than a few companies that are blazing the trail for the rest of us.

    The Plot Thickens – Monitoring Like a Boss

    So once you finally saw the light, put in your sweat and tears and managed to automate your setup, upgrades and code pushes. What’s next? This where it really becomes interesting, and where you can really take your business to the next level, with the monitoring of the entire system, and eventually, what you do with the aggregated data.

    More to come…

    In my next post I’ll discuss the different levels of monitoring and logging to get the to promised land of proactive DevOps.  And then…take that even further.  So stay tuned.