Tag: monitoring

  • Three is the Magic Number: Planning and Executing a Successful DevOps Project

    Three is the Magic Number: Planning and Executing a Successful DevOps Project

    Diligent preparation, clearly defined workflows and watchful monitoring are key to delivering a high-performing DevOps project. DevOps is one of the hottest buzzwords in programming, but everyone seems to have their own ideas when it comes to structuring and deploying a DevOps team.

    In basic terms, DevOps is the integration of developers and IT operations workers into a single group, with the goal of increasing the speed and quality of software deployment. Its creation was a response to concerns over the segregation of teams, which led to communication breakdowns and a lack of cohesion.

    Since its inception, DevOps has grown in popularity, with 83% of IT decision-makers stating that they have implemented this style of working in some form.

    However, transitioning business focus in this way does not guarantee an immediate change in fortunes–this dynamic represents an IT culture shift, with increased emphasis placed on collaboration and interpersonal skills. For this model to yield returns, engineers should be open to new information, technology and ways of working.

    So, what vital steps must a DevOps team take to ensure the successful delivery of a project?

    Understanding the Needs of the Client

    The preliminary stages can make or break a DevOps project. If the team does not emerge with a vivid idea of what the client wants and how this can be delivered, the venture is doomed to failure.

    It is crucial that both the team and the client are willing to put the time in to understand each other’s goals, ensuring that their visions align for the steps to follow. This can be done through a series of meetings and workshops, where objectives are identified and both establish a good comprehension of how the final product should look.

    If executed correctly, the DevOps team will exit the project’s first phase with a well-defined brief and a crystal-clear understanding of what the client wants to see delivered. When this step is rushed, engineers will be held back by a lack of direction, increasing the chances that the finished product will not reflect the client’s hopes.

    Configuring the Environment

    This next phase is where the developmental process of the app begins, which is usually facilitated using a cloud-based solution. The team begins by preparing the environment’s aesthetic, working out the components it should contain and exploring how they should be configured to maximize efficiency.

    It is during this period that cybersecurity measures are added so that the final version of the app is as close to impenetrable as possible. This shows why a DevOps team needs a diverse range of skill sets: Cybersecurity experts are few and far between, but there should be at least one member of the group whose knowledge can be called upon to ensure protective measures are properly implemented.

    A successful developmental phase is underpinned by clearly structured workflows, with the project mapped out step by step and everyone involved understanding where they fit into the plan and how they can contribute.

    However, a DevOps project is rarely smooth sailing from start to finish–development is often disrupted by missed deadlines, bugs and conflicting duties pulling engineers away from their stations. For this reason, agile and multi-skilled team members, who can ably jump in and assist in various areas, are extremely important for ensuring continuity when workflows are derailed.

    Avoid Failing at the Final Stages of the Project

    Just because the development of a product is complete and the app is live, this does not mean it is time for the DevOps team to rest on their laurels and move on to the next project. It is essential that they continue to monitor the app in its early stages so that any bugs can be identified and immediately fixed.

    Engineers should be in place to see how much the environment is burdened and how it responds depending on the rate and number of new users. Any data obtained is a precious commodity and should be treated as such, with teams ordering and labeling results as soon as they are collected.

    Once the baseline data has been gathered, results can be analyzed to pinpoint which parts of the app may need recalibrating. After making these improvements, the final result should be a product performing at an optimal level while also meeting the client’s specifications.

    Don’t Rush the Project’s Process

    At the conclusion of all three phases, DevOps teams should have absolute confidence that the project is headed in the right direction and that they are fully equipped to execute the next procedural steps.

    A well-designed app is far easier to produce when a team is made up of specialists from an array of fields eager to collaborate and communicate with one another. Assembling the right personnel will aid the smooth transition between the stages of a DevOps project.

  • Optimizing Prometheus Implementations With Managed Services

    Optimizing Prometheus Implementations With Managed Services

    Prometheus is a leading metrics-based open source monitoring solution and time series database used across the IT community to collect metrics from systems, applications and services. According to the 2021 Cloud Native Survey from the Cloud Native Computing Foundation (CNCF), the use of Prometheus in production has reached 65%, an increase of 43% year-over-year.

    “As cloud-native stacks have grown and matured, observability has become crucial for visibility into application metrics, performance, alerting, and insights,” said Chris Aniszczyk, CTO of CNCF. “Prometheus is a key element of this, enabling organizations to build a foundation of observability.”

    If you are using Prometheus, it is probably because of its many advantages including reliability, easy initial implementation and its open source nature. However, in addition to these benefits, Prometheus also brings several challenges if you are deploying and maintaining the solution on your own.

    Facing the Four Main Prometheus Challenges

    Prometheus users face four primary challenges that can be alleviated by the right service provider:

    Challenge One: Support

    Prometheus users face the dilemma posed by any open source tool: There is no vendor behind the solution to deliver technical support. It is easy to take tech support for granted, but when you are working with a technology that is not supported, even a small issue can become a substantial problem. A commercially-backed product can provide a critical level of expertise you do not have in-house, and take on responsibility for keeping the system up and running.

    Challenge Two: Maintenance

    The greatest challenge you’ll likely face with Prometheus is the amount of time your team must spend configuring and maintaining the system. 

    Just one example of how Prometheus drains your resources is the use of third-party exporters to expose metrics in the Prometheus format. These integrations are designed by members of the open source community an do not come with any support; upgrades are hit-or-miss.

    Exporters are difficult to maintain. First, there are often multiple exporter options and choosing the right one for each of your services is time-consuming. Second, you can easily have hundreds of different services running in your environment and your team can spend hours every day making sure the exporters are working properly.  

    Another maintenance issue involves PromQL, the Prometheus query language. PromQL is a custom query language, and it is very complex and difficult to learn. Having to rely on your one PromQL expert for all Prometheus queries across the organization is simply not practical or sustainable.

    With all these maintenance requirements, you will have some team members spending all their time managing and maintaining a Prometheus environment, eating away at resources that could be used to focus on business needs and innovate new applications.

    Challenge Three: Scalability

    Users tend to deploy Prometheus in silos, with a separate server for each cluster. Over time, you may have tens or even hundreds of Prometheus servers in your environment that you are not aware of. This leads to scalability issues regarding consistency, maintainability and a global view of your metrics.

    In addition, storage is a major hindrance to scaling Prometheus, because the system typically stores metrics for about two weeks. If you need to analyze metrics older than a couple of weeks, you run into a serious problem. 

    Challenge Four: Correlating Data

    Data does not have much value if you cannot correlate it and, unfortunately, Prometheus does not provide correlation for metrics to other elements in your environment like processes or cloud regions. This makes it difficult to pinpoint the source or impact of a problem. 

    Options for Solving Prometheus Challenges

    Options are available to help you with Prometheus but most do not solve the four major issues outlined above. The following are your options:

    APM: APM vendors all have some level of support for Prometheus, but this is an add-on to their platform. They offer an ingest tool that can transform Prometheus data into a format you can query natively within the APM platform. In reality, they are not helping you utilize Prometheus but instead are forcing you to work within the constraints of their system.

    Cloud tools: Some cloud hyperscalers offer solutions to support Prometheus. These tools can help with deployment and infrastructure maintenance, but you are still stuck doing all the other configuration and maintenance work. 

    Managed service: The preferred option is a Prometheus managed service, which can alleviate all four of the main challenges posed by open source Prometheus. The right optimized managed service provider delivers support, maintenance, long-term storage and data correlation.

    Must-Have Capabilities for Your Prometheus Managed Service Provider

    The following are essential capabilities you should look for when choosing a Prometheus managed service provider:

    Prometheus compatibility: You need an optimized managed service provider whose platform is designed to be natively compatible with Prometheus, consuming data in the Prometheus format and allowing you to run PromQL queries on the data.

    Simplified PromQL: To eliminate the reliance on PromQL experts for every query, a managed service provider should simplify the use of PromQL, without breaking compatibility.

    Exporter management: The right optimized managed service provider will be able to streamline the selection, deployment and management of exporters, saving you a significant amount of time and effort.

    Automated discovery: Tracking and optimizing all your services can be challenging. For this reason, a Prometheus-managed service should be able to automatically discover the services running in your environment and help guide you with configuration.

    Metric Storage: One of the shortcomings of Prometheus is the lack of long-term storage. Consequently, a Prometheus managed service provider should provide a database for long-term storage of metrics, so you can perform comparative analyses of the data, from month to month and even year-to-year.

    Prometheus compatibility: If you already use open source Prometheus, your teams are used to using things like PromQL and Grafana dashboards. You should select a managed service provider that is Prometheus-compatible so your team can use the same dashboards and queries they have always used to view the data.  

    Conclusion: Optimized Valuable Tool

    Prometheus is not a standalone solution. But it is an optimized valuable tool to collect metrics for performance analysis and it is appreciated by your architects, developers and IT Ops pros. While Prometheus may have some limitations, it is worth finding a solution to these issues; that solution is a managed Prometheus service. The right managed service provider can give you the best of both worlds—all the benefits of Prometheus without the time, resources and expense needed to run it effectively.

  • Embrace Change in Production to Improve MTTR

    Embrace Change in Production to Improve MTTR

    DevOps creates value through constant deployment changes. When done right, more frequent deployments allow teams to continuously improve their products or services while making it easier to manage the effects of the change. One way to do this is with continuous integration and continuous deployment (CI/CD). CI/CD helps to reduce the risks to each build and allows teams to release valuable features quickly and safely. But CI/CD alone is not sufficient for understanding change and service impact in production. The recent DEJ State of IT Performance Report found that change is the largest source of production issues. A full 76% of all performance problems can eventually be traced back to changes in the environment but 67% of organizations don’t have the ability to identify changes in their environment that caused performance issues.

    In a modern IT environment, different teams are constantly integrating new features and new technologies and renewing their stack. With many moving parts, it’s impossible to mimic the production environment when testing new features in pre-production. By the time you’ve implemented and tested new code, your branch will be different from what is in production.

    Here’s the reality we’re working in:

    ● Integrating testing in CI/CD pipelines will not keep bugs out of production. Some organizations don’t do true CI/CD, meaning some processes are not even tested and automated in the pipeline.
    ● User configuration errors are common. Here’s a consolidated list of configuration errors that brought down production.
    ● Change anxiety is real: Ops folks get nervous when hitting the deploy button, even for small changes.

    Changes are inevitable in DevOps, but organizations can protect themselves from a performance incident or an outage by integrating change in production safely with a few simple steps.

    Build Data Connections

    Today, data is kept in silos, which is why it’s time-consuming and challenging to make associations and leverage them to find the root causes of performance issues. DevOps teams need to connect their data in meaningful ways to troubleshoot complex issues in distributed systems. Building the “connections” foundation is critical to understanding the state of a system and how the pieces interconnect and interact.

    How well an application performs in production is related to a combination of code, infrastructure and operations. For instance, when an incident occurs, teams should quickly know if that issue is related to code, infrastructure or operational activity. Understanding these connections and correlating the data cannot be performed manually. We have hit the wall in linking together data silos; we just don’t scale as software does. Teams need to consider a monitoring and analytics approach that connects operational data together from the start and models the causal links between the data for real-time root cause diagnosis.

    Understand Change Impact to Avoid Outages

    How well can your DevOps team identify the key changes made to your production environment? If your answer is “not very well,” then you’re missing critical data that helps to speed up troubleshooting. The lack of visibility into changes and how they impact production makes it impossible for operations staff to identify the cause—the very thing that SREs care most about.

    Changes are made to the code or the cloud infrastructure, either directly or through infrastructure-as-code (IaC) templates, for a variety of reasons. The risk of misconfiguration and performance issues increases when these operational activities are not continuously monitored and correlated across the stack.

    Metrics don’t tell the whole story. Logs don’t pinpoint where to act. Simply collecting these data types leaves many companies struggling with knowing what is important and what’s not when it comes to real-time troubleshooting.

    Having a shared “system of record” for changes for all the different streams of activities increases visibility and control of all changes in real-time. Teams can see pre-incidents and be aware of increased risks when changes are made, especially during high-velocity change periods. By seeing how a code change can impact things down the line, developers can proactively troubleshoot and debug code.

    Implement Real-Time Root Cause Diagnosis

    In the same DEJ report, organizations shared that 66% of MTTR is spent on the ‘diagnose’ stage. This correlates to the 67% of teams that are unable to identify the changes in their environment that caused performance issues.

    With a shared “system of record” for changes, DevOps teams can troubleshoot incidents in real-time, dramatically cutting the time spent on the “diagnose” stage of MTTR. This is especially effective when teams can see all the changes and other events that are happening to the system in a single, searchable/filterable real-time feed; this timeline would provide the potential causes of issues.

    The best tool would allow you to start from an effect and work backward, chaining multiple events overlaid with observability data to determine the causes quickly. Building the causal chain from the end helps teams hone in on the connected change and answer each “why” in a straightforward way. This capability makes it easier and faster to prioritize relevant changes and resolve performance degradations or outages with actionable context.

    Communicate Everything

    During diagnosis and resolution, it’s important to see what’s being done without having to ask on Slack, wait for each other or unknowingly interfere with remediation actions. The best option would be leveraging the same timeline to capture all the context of an incident at the moment it occurs, and at any moment in time during diagnosis and resolution, to avoid reverting each other’s changes.

    While an incident postmortem brings teams together to gather data and discuss the details and learnings from it, this process is often inefficient and time-consuming. Each team member involved in the incident response effort would have to recollect what they observed, what actions they took and what they communicated to other team members. What if a system could capture all the actions and communications during an incident response effort? Wouldn’t it be nice to just summarize your thoughts in one sentence and be done with the reporting?

    When preparing for planned and unplanned changes that can impact the bottom line, DevOps teams need to consider these steps to gain true observability of their operations. Focus on finding the connections in the data to explain cause and effect. Understand change impact —as those changes are being made —to avoid outages. Capture and communicate activities as seamlessly as possible and identify and capitalize on opportunities to automate the workflow.

  • Grafana Labs Aligns with Elastic on Observability

    Grafana Labs Aligns with Elastic on Observability

    Elastic and Grafana Labs have allied to create a plugin through which DevOps teams that are employing Elasticsearch within a DevOps workflow will be able to invoke a monitoring platform, based on Prometheus, that is managed by Grafana Labs.

    Raj Dutt, Grafana Labs CEO, said both companies are dedicating engineering resources to building and maintaining a plug-in for a service, based on open source Prometheus software, that is rapidly becoming a de facto standard for observability in DevOps environments. One of the primary reasons for that expanded usage is that Grafana Labs doesn’t require DevOps teams to move data into a central repository to analyze it, Dutt said.

    The overall goal is to eliminate the “tunnel vision” that results when relying on tools that only visualizes a narrow set of metrics, Dutt added.

    The cloud platform provided by Grafana Labs is based on open source Grafana visualization tools. The primary tool for visualizing Elasticsearch data is based on open source Kibana tools. Grafana, however, is based on a fork of Kibana, so the plug-in represents an effort to bring those two open source communities closer together. The two companies plan to collaborate on including more aggregations, broader query language support and support for space-saving constructs like rollups as the partnership evolves.

    Grafana Labs provides a cloud service that aggregates data, pulled from multiple instances of Prometheus, deployed on clusters and servers. Prometheus, especially, gained a lot of traction as organizations began to deploy Kubernetes clusters that are also based on open source software. Both Kubernetes and Prometheus are being developed under the auspices of the Cloud Native Computing Foundation (CNCF).

    Once DevOps team initially employ Prometheus to monitor Kubernetes, they frequently expand deployments to monitor additional platforms. That shift has resulted in many providers of proprietary monitoring tools to extend the data they consume to include the metrics captured locally by Prometheus. Grafana Labs claims it has more 1,000 customers, including Bloomberg, JP Morgan Chase, eBay, PayPal and Sony, for a total of more 650,000 active installations of Grafana around the globe. Existing customers of Elastic that are paying for Elasticsearch support include Cisco, eBay, Goldman Sachs, Microsoft, The Mayo Clinic, NASA, The New York Times, Wikipedia and Verizon.

    It’s not clear to what degree Grafana and Kibana might ultimately re-converge one day, but it’s clear there will be a fair amount of ongoing cross-pollination across the two projects. In the meantime, DevOps teams should be able to opt for whichever open source visualization framework they prefer alongside Elasticsearch.

    In the longer term, it’s clear greater appreciation for observability platforms that provide more context will drive a wave of consolidation among all the monitoring tools that enterprise IT teams rely on today. As part of the transition, enterprise IT teams might even standardize on a set of visualization tools that would eliminate the need to master different user interfaces. After all, the only way to actually achieve observability is through a set of tools that makes surfacing the context required easier to consume.

  • Splunk Adds Plumbr and Rigor to Observability Portfolio

    Splunk Adds Plumbr and Rigor to Observability Portfolio

    Splunk this week at its online.conf20 conference revealed it has acquired Plumbr, a provider of an application performance management (APM) platform, and signed a definitive agreement to acquire Rigor, a provider of synthetic monitoring and application optimization tools.

    Both platforms are destined to be integrated with the Splunk Observability Suite, a suite of IT management tools the company launched this week as well.

    Splunk CTO Tim Tully said the goal is to provide a full-fidelity platform that leverages machine learning algorithms to observe IT environments in real-time.

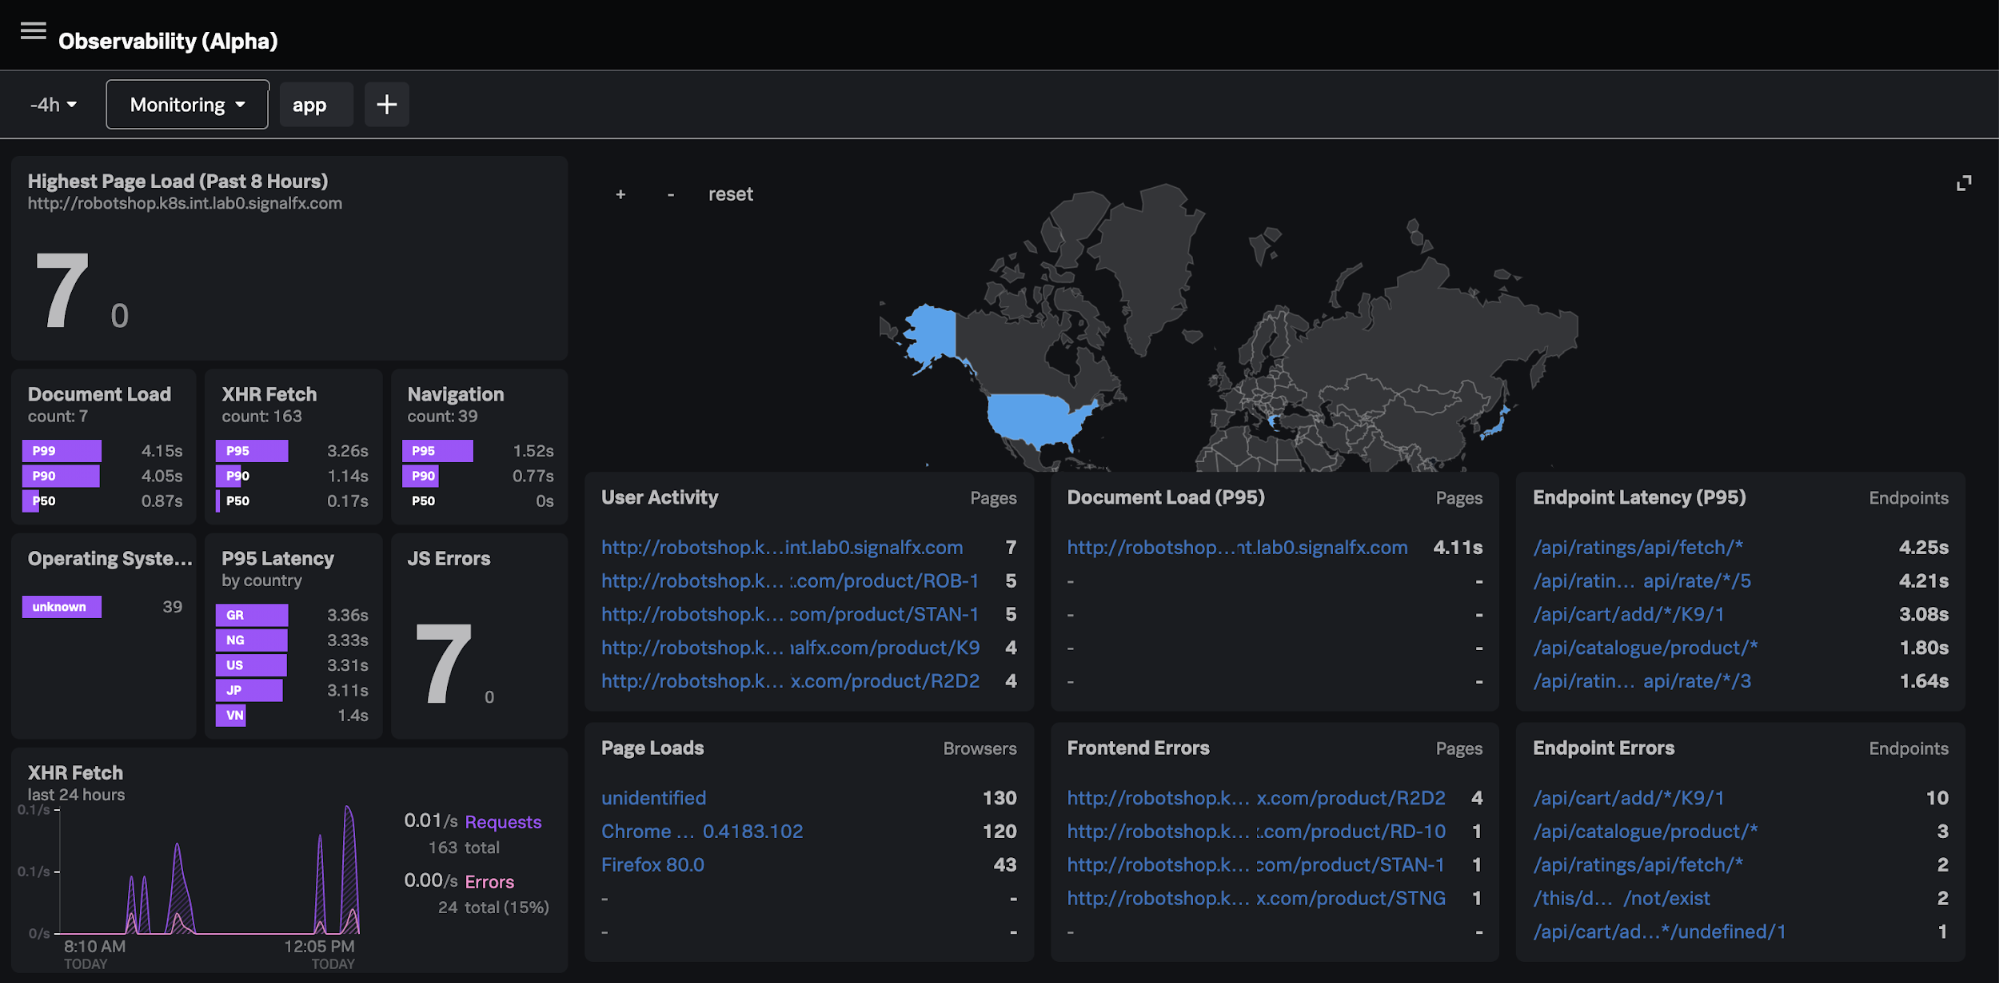
    Plumbr, which includes real user monitoring capabilities as part of its platform, will extend real user monitoring (RUM) capabilities, currently in beta, that Splunk has developed on its own.

    Tully said Splunk is also committed to making its platforms available across hybrid cloud computing environments by leveraging cloud-native technologies such as Kubernetes, Docker containers, Envoy, Istio and Terraform.

    Splunk has embraced observability, a core tenet of best DevOps practices, as part of an effort to provide a range of digital experience management capabilities at a time when many organizations are accelerating their investments in digital business transformation initiatives. Splunk last year acquired SignalFX for more than $1 billion to gain access to another APM platform that would expand its reach beyond its core IT operations analytics platform.

    It’s not quite clear how many platforms and services will ultimately make up the Splunk Observability Suite. The company is clearly moving toward a model for consuming its services based on value rather than the amount of data collected. Determining that value will naturally be different for each customer, but in the wake of the economic downturn brought on by the COVID-19 pandemic, the pressure to reduce IT costs has intensified. In many cases, the cost of acquiring an observability platform can easily be justified by eliminating the licensing fees organizations pay to employ a dozen or more tools from different vendors that typically are not integrated.

    Competition across providers of observability tools has also intensified. In addition to every provider of an APM platform recasting itself as a provider of observability tools, there is a range of startups that address all or some aspect of observability. A wave of consolidation among providers of observability tools and platforms is all but inevitable.

    Much of the focus on observability is being driven by the rise of microservices-based applications that have levels of dependencies requiring a level of context to successfully manage what isn’t possible to achieve by relying on legacy tools that monitor applications and infrastructure in isolation. The lack of integration is also one of the primary reasons why IT teams waste so much time in “war rooms” trying to deduce the root cause of an issue, which, once discovered, only takes a few minutes to fix.

    Splunk, of course, enjoys a considerable advantage in the observability wars. Its core IT operation platform is widely employed by internal IT operations and security teams. However, much of the transition to observability is being driven by DevOps teams who take the lead when it comes to instrumenting applications. Many of those teams are far less committed to any specific platform no longer how established it may be.

  • Splunk Dives Deeper Into Observability

    Splunk Dives Deeper Into Observability

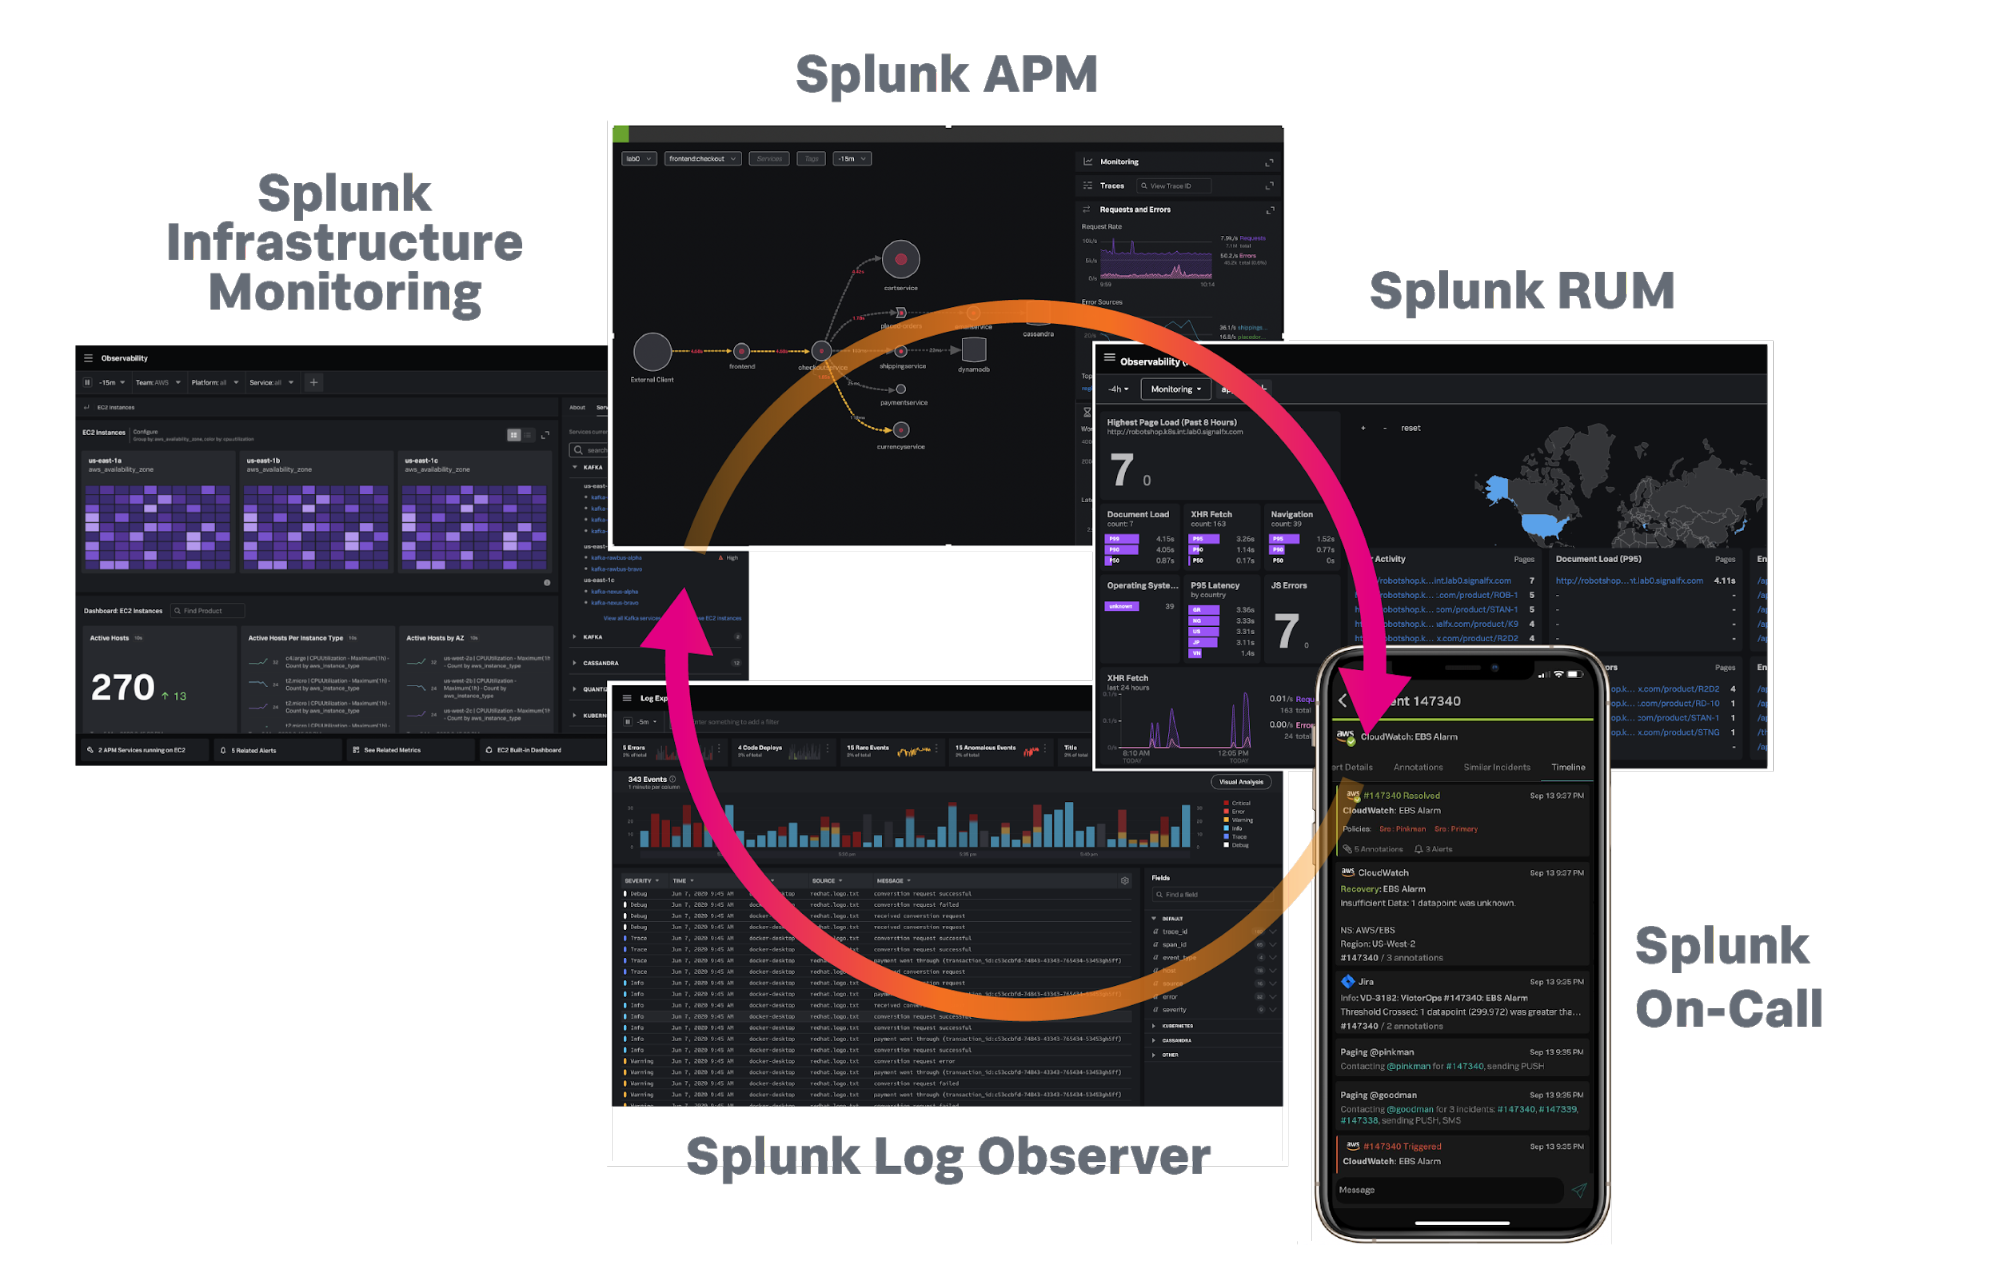
    Splunk, during its online .conf20 conference today, launched the Splunk Observability Suite, which combines tools for infrastructure monitoring, application performance monitoring, digital experience monitoring, log investigation and incident response in a single offering.

    Kia Behnia, vice president of ITOps for Splunk, said IT teams can correlate metrics, traces and log data in real-time to go beyond simply monitoring IT platforms to also include the end user experience. As part of the Splunk Observability Suite, Splunk is making available in beta Splunk Log Observer, a cloud-based service for visually inspecting logs and sending messages to DevOps platforms based on events being observed by Splunk platforms, and Splunk Real User Monitoring, which extends the reach of Splunk Application Performance Management(APM) platform to add a module that tracks specific end user application experiences.

    That critical because without end user monitoring capabilities an observability platform will lack crucial context, said Behnia, noting observability needs to start with IT infrastructure and then extend out to encompass the actual end user experience.

    Splunk this week also announced enhancements to Splunk Cloud and Splunk Enterprise, which are now based on a version 8.1 of the core Splunk platform that is now generally available. The company is also making available in beta a Splunk Machine Learning Environment (SMLE) to makes it easier to build and operationalize machine learning models and algorithms.

    The Splunk Data Stream Processor (DSP) platform is also being updated later this year to add support for cloud services such as Google Cloud Platform (GCP) and Azure Event Hub along with support for lookups and machine learning algorithms.

    Splunk is also making available a beta release of a Splunk Operator for Kubernetes to simplify deployments along with making Splunk Cloud available on GCP.

    The company is also updating Splunk Connected Experiences to include a Splunk Augmented Reality capability that adds a remote collaboration feature that allows users in two different places to interact and visually compare data.

    Splunk TV, a mobile application for analyzing IT operations trends, is now also available on Google Android as well as Apple. Users can now also centrally control multiple TVs without having to be connected to the same network.

    Other additions to the Splunk IT Operations portfolio include Splunk Service Intelligence for SAP, which applies artificial intelligence (AI) to these environments; an update to Splunk IT Service Intelligence (ITSI) that adds predictive analytics tools; a Splunk Infrastructure Monitoring Add-On to integrate Splunk Infrastructure Monitoring gained via the acquisition of SignalFX; and the beta of Splunk IT Essentials to provide a more curated implementation of Splunk Cloud.

    Finally, Splunk has updated Splunk Enterprise Security and launched both Splunk Mission Control and the Splunk Mission Control Plug-In Framework. The framework makes it possible to combine third-party security tools with updates to Splunk security information event management (SIEM) and Splunk Phantom security orchestration automation and response (SOAR) platforms. Initial partners include Accenture Security, C3M, Crowdstrike, Netskope, Recorded Future, RiskIQ and Tenable.

    Put it all together, and it’s clear Splunk is now pushing to extend observability in every IT direction possible.

  • DeepFactor Unifies Performance and Security Monitoring for Developers

    DeepFactor Unifies Performance and Security Monitoring for Developers

    DeepFactor today launched what it describes as the first continuous monitoring platform designed specifically for pre-production environments.

    Company CEO Kiran Kamity said the DeepFactor Pre-Production Monitoring platform combines security, performance and behavior monitoring in one offering. Based on a “Deep Passive Monitoring” capability that requires developers to add a file to a container image to instrument an application, the platform feeds the telemetry data collected via that file to an Application Runtime Intelligence engine. That engine surfaces potential security and performance issues as well as risky and unexpected behavior changes between versions of applications, he said.

    Scans of application environments are launched via a DeepFactor portal. Each scan is then compared to a set of configurable rules that are developed and maintained by the DeepFactor research team to identify indicators of application misbehavior. The engine also learns the application environment, which over time enables DeepFactor to generate alerts based on threshold triggers, known bad behaviors, anomaly detection and other attributes.

    The DeepFactor Pre-Production Monitoring platform also comes with pre-packaged integrations for widely employed DevOps tools including Jira, Jenkins, Slack and GitHub.

    In addition to the commercial platform, DevOps teams can also make use of a DeepFactor Standard Edition, which is free for non-commercial open source projects with no user limitations.

    In an ideal world, developers would address issues, including security, long before an application is deployed to a production environment. The issue is that developers are asked to navigate too many tools to achieve that goal. The DeepFactor Pre-Production Monitoring platform will make it easier for developers to surface insights in a frictionless way, said Kamity.

    Most organizations that embrace best DevOps practices embrace observability as a core tenet. The challenge they face is making it easy for developers to instrument applications as they are built and then making sense of all the telemetry data collected. That’s especially critical as developers attempt to strike a balance between remediating security issues and optimizing performance to better ensure the overall user experience. Existing developer tools are optimized for performance; asking developers to switch tools to address potential cybersecurity issues is a task that can be delayed to the point where it is essentially forgotten or simply ignored.

    It’s not clear to what degree DevOps teams might have the budget dollars required to deploy their own monitoring tools versus relying on the existing monitoring tools provided deployed by an IT operations team. However, it does usually take a significant amount of time to deploy and update the agent software that legacy IT monitoring platforms require. DeepFactor is making the case for capturing telemetry data using a comparatively lightweight container that can be added to either a monolithic or microservices-based application.

    Of course, if an application is already instrumented in a pre-production environment it might make sense to use the same monitoring platform to observe applications in a production environment. However, convincing IT operations teams to swap out their existing monitoring tools for something that makes the lives of developers easier might be a tall order.

  • Datadog Expands Scope of Monitoring, Analytics Services

    Datadog Expands Scope of Monitoring, Analytics Services

    Datadog, at its online Dash conference today, launched an incident management platform along with additional analytics tools to identify application errors and performance and compliance issues.

    Amit Agarwal, chief product officer, said these latest additions to the Datadog platform are intended to further consolidate IT management and monitoring. IT organizations should not find themselves acquiring and support 20 different tools that essentially all do the same thing, he said.

    The Datadog Incident Management service accomplishes that goal by streamlining incident response workflows by unifying alerting data, documentation and collaboration in a centralized pane of glass. Those workflows can then be used to create playbooks that automate incident responses.

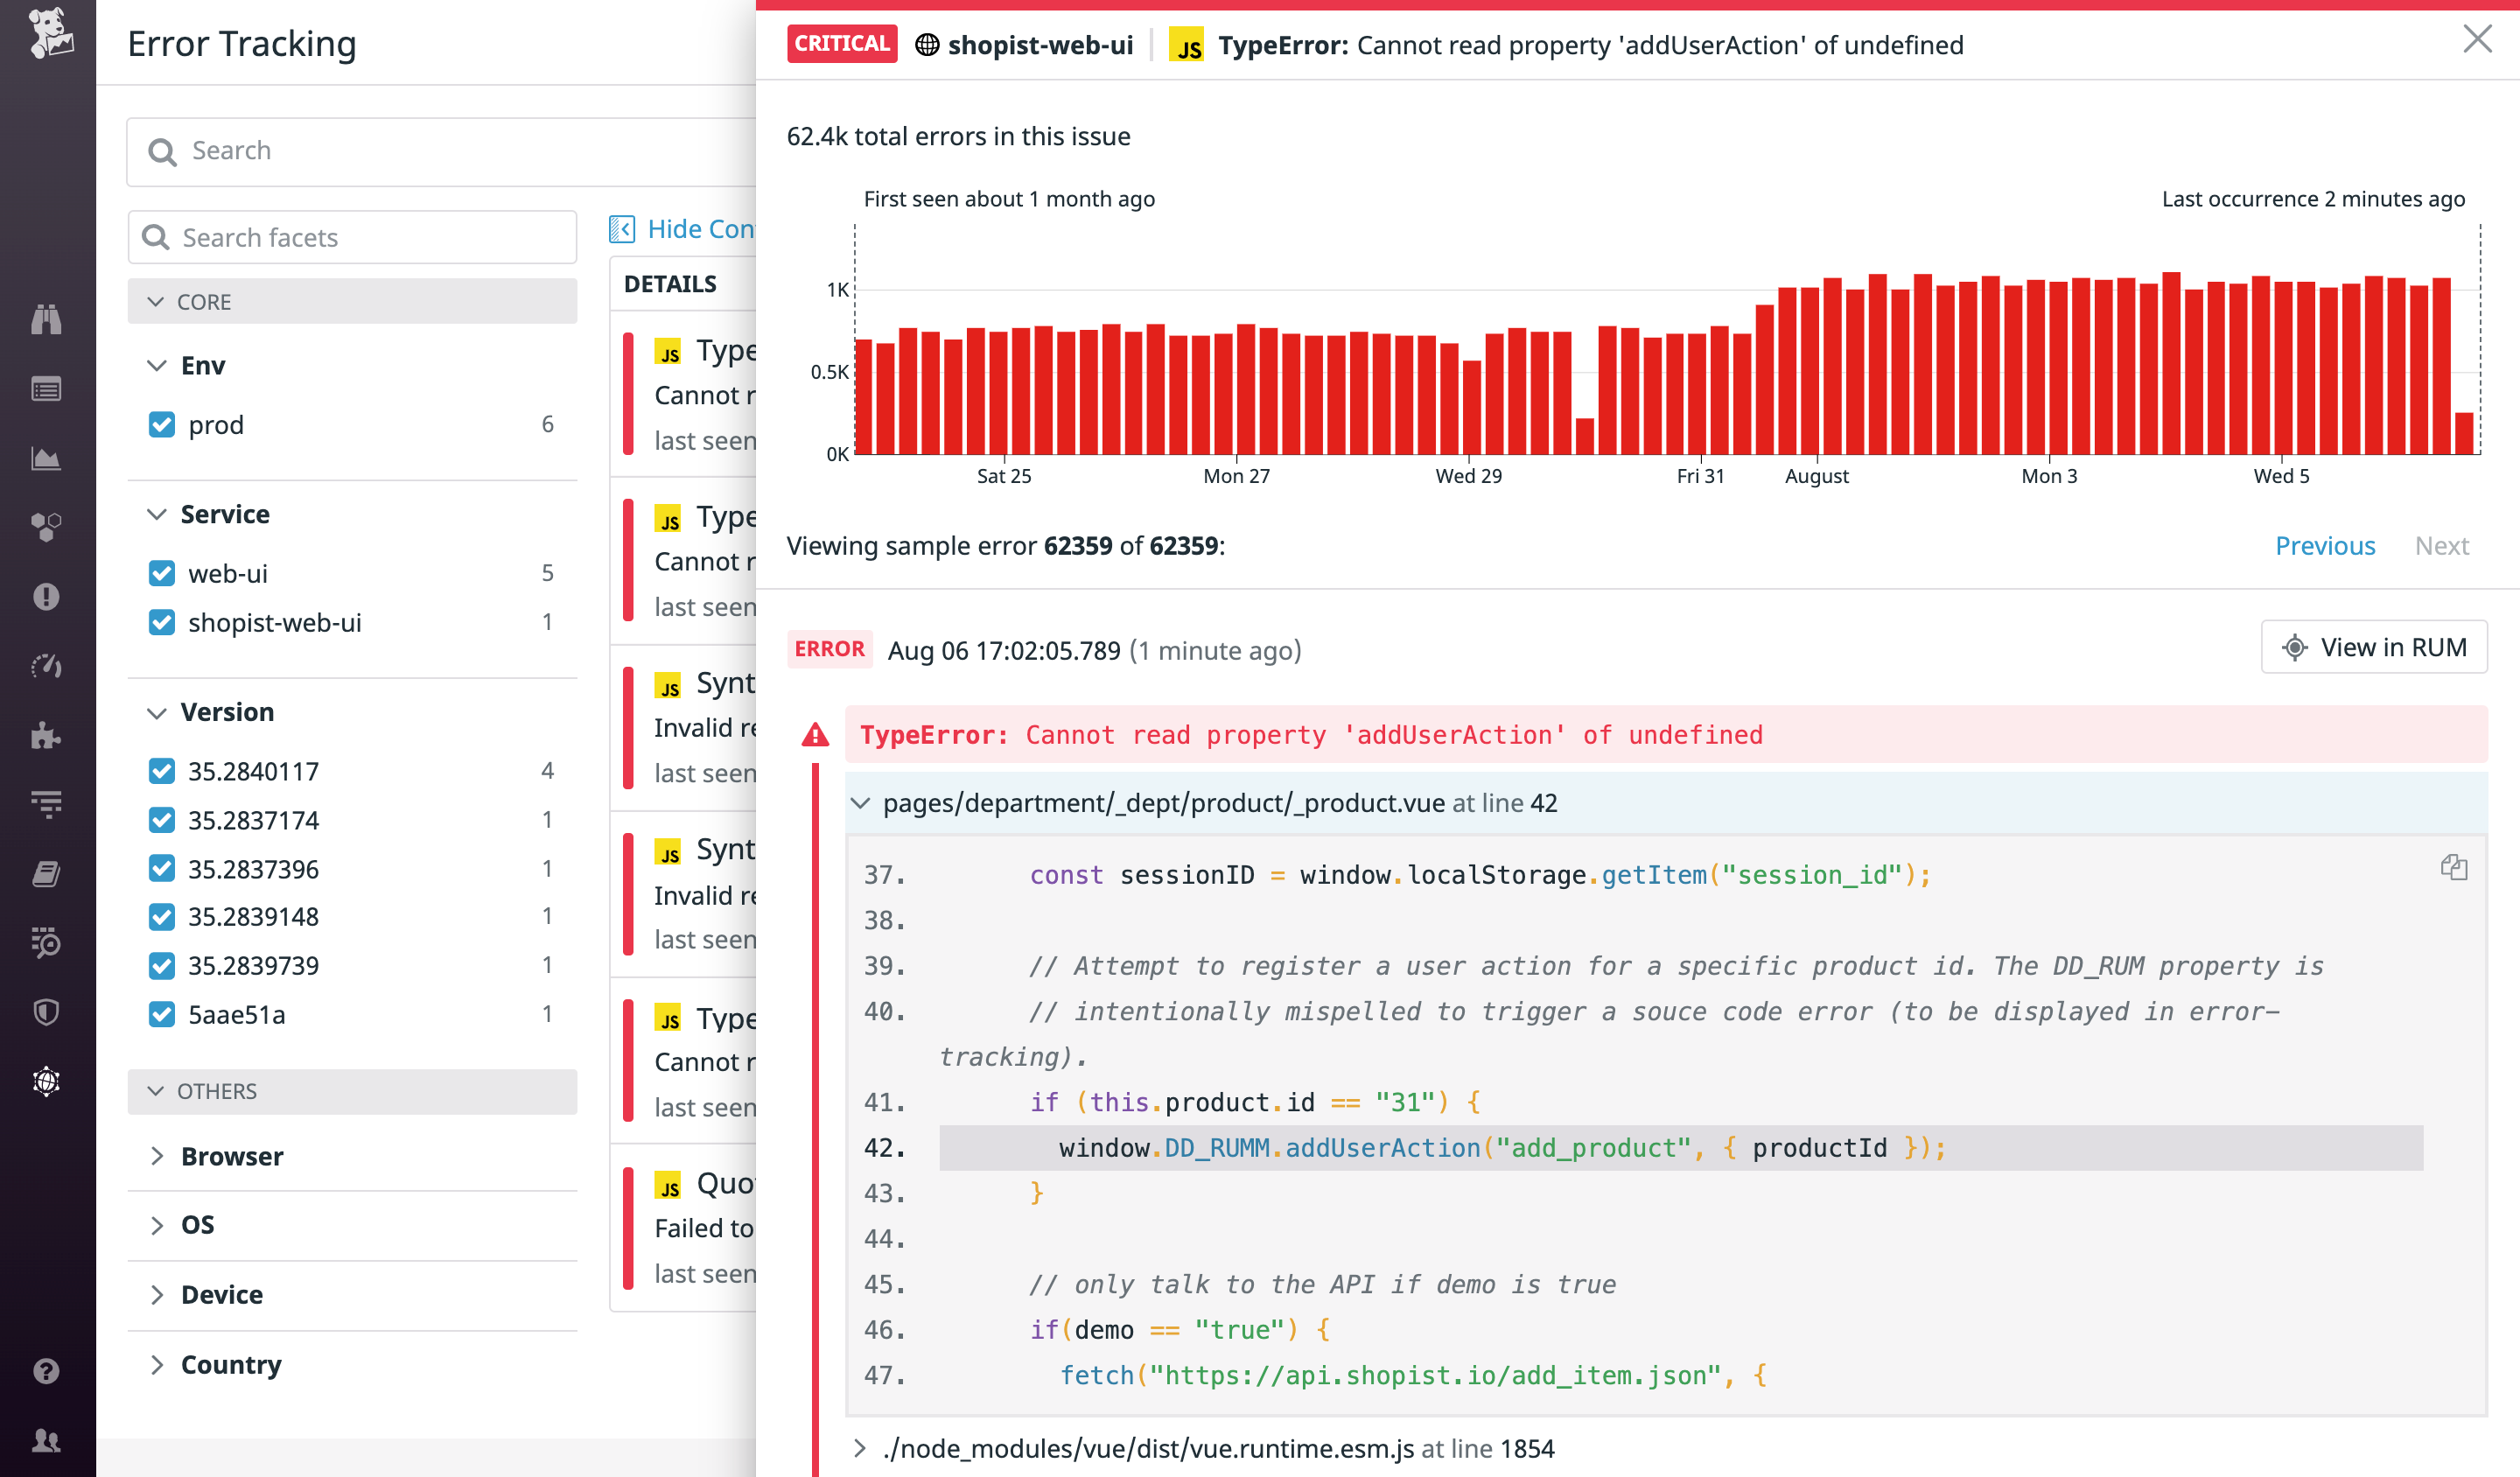
    At the same time, Datadog has made generally available Continuous Profiler, to specifically measure the performance of code in a production environment, and launched Error Tracking, which automatically aggregates all related application errors in real-time to surface actionable issues more easily within the context of a DevOps workflow process enabled by the command-line interface (CLI) that Datadog provides.

    Datadog is also launching Compliance Monitoring, a service designed to identify misconfigurations that cause compliance-issue drift as soon as they occur. Once problems are identified, Datadog Compliance Monitoring immediately alerts the DevOps team.

    Finally, Datadog has launched a marketplace to make complementary third-party applications more accessible to end customers. Participants in the Datadog marketplace include Fairwinds, Trek10, RapDev and IO Connect.

    As more organizations embrace observability as a core tenet of best DevOps practices, Agarwal said the need to consolidate monitoring tools to provide greater context is great. Those tools need to address application issues not only in IT infrastructure management but also in security and compliance requirements, added Agarwal.

    Given the cost of maintaining all those platforms, however, it makes more financial sense for IT teams to rely on a service that makes all those capabilities available via a single integrated platform, he said.

    In the wake of the economic downturn brought on by the COVID-19 pandemic, Datadog is making a case for consolidating IT monitoring and management to reduce total costs. The company is betting many DevOps teams would prefer to allocate resources to developing applications rather than provisioning and maintaining DevOps tools.

    More IT organizations are simultaneously expected to embrace unified monitoring as they make the transition to microservices-based applications. Given the dependencies that exist between all the microservices that make up a modern application, monitoring is now a requirement for almost any cloud-native application. A cloud service provides the added benefit of being able to scale monitoring infrastructure resources and up and down as required.

    Of course, Datadog is not the only provider of unified monitoring tools with the same ambitions. However, it does have a significant base of customers that provides a foundation from which it can continue to expand. The only real issue is determining to what degree organizations will be willing to consolidate management functions, given all the vested interests involved.

  • DataStax Brings AIOps to Cassandra Database Management

    DataStax Brings AIOps to Cassandra Database Management

    DataStax today unveiled a private beta release of artificial intelligence tool dubbed Vector that provides advice on how to optimize clusters running the open source Cassandra wide column store database.

    Vector analyzes individual nodes and then compares behavior to other nodes in the cluster to identify opportunities to improve deployments.

    Ed Anuff, chief product officer for DataStax, said the goal is to enable IT teams to take advantage of AIOps for things such as improving performance and query techniques.

    Available for both instances of Cassandra downloaded by IT teams as well as the curated instance of Cassandra that DataStax makes available as DataStax Enterprise, Vector is intended to augment rather than replace IT teams managing Cassandra databases, said Anuff.

    Anuff said by employing algorithms and heuristics, Vector provides IT teams with predictive guidance, which they can determine whether to implement or not.

    As IT becomes more complex the need to rely on AIOps tools such as Vector is becoming more pronounced. The number of variables that could adversely impact the performance of applications deployed on Cassandra or any other database exceeds the ability of most IT teams to monitor manually. AIOps tools such as Vector essentially provide IT teams with a digital assistant to help optimize database deployments.

    Anuff said there will always be a need for a human to be in the loop, but each IT organization will determine the degree it trusts the recommendations being surfaced by AIOps tools such as Vector. In some cases, IT teams will use those recommendations to inform frameworks to automate the management of databases.

    Given the commitment to ruthless automation by IT organizations that have embraced DevOps, Anuff said DataStax expects DevOps teams to be at the forefront of embracing AIOps. In many cases, those DevOps teams have already assumed management responsibilities for both applications and the underlying databases on which they depend.

    Of course, AIOps is still in its infancy. However, in the wake of the economic downturn brought on by the COVID-19 pandemic interest in AIOps as a means to reduce the total cost of IT is rising. Many IT teams are becoming smaller as organizations downsize, while others are limiting headcount. AIOps provides a way to manage IT at scale without necessarily having to expand the size of the current IT staff.

    Regardless of the motivation, AIOps is here to stay. Many of the rote tasks that conspire to turn IT into drudgery should soon be eliminated. That may reduce the number of entry-level jobs that historically have been available. However, as schools adjust to this new reality, it may also mean that new entrants into the field may be able to take on more complex challenges sooner than later.

    In the meantime, IT professionals might want to consider what part of their job might be better handled by a machine and plan the next step in their careers accordingly.

  • Continuous Security Through Developer Empowerment

    Continuous Security Through Developer Empowerment

    Every organization is embracing DevOps to one degree or another. The business impact of shipping software quickly and adapting to market needs is so immense that it has become a requirement—you’re either heading toward DevOps or heading toward bankruptcy. Yet, while our need for speed has increased, so has our need for security—and combining both is far from an easy task.

    The key to achieve the DevOps velocity is developer autonomy. Developers and their surrounding application teams need to make daily decisions about what to build and how to build it, and they need to do them on their own. Bottlenecks appear when teams are required to get external approval, slowing down the process and eliminating the dev team’s sense of ownership. The resulting effects are subpar outcomes in applications and attrition of top performing developers. 

    Yet, security practices, unfortunately, often depend on such reviews. Security audits and reviews are the bread and butter of most security organizations, requiring experts to determine if a decision is secure or not. For security to work at the speed of development, this practice has to change and give developers the power to make security decisions. The only alternative is insecure software and deceleration of software version development.

    How can we achieve such developer empowerment for continuous secure software development? Let’s review some key practices, and look at ops practices for inspiration. 

    Mindset Shift: From Super-Hero Operators to Multiplier Engineers

    Site reliability engineering (SRE) teams hold the same responsibility for a service’s uptime as the sysadmins that preceded them. The change in the role came from how they achieved this resilience. SREs don’t handle most incidents, nor do they review all code that affects reliability. Instead, they engineer the tools to empower developers to handle oncall and build operable software the right way. An SRE should only be pulled in for the extreme cases, be it an incident or architecture review. 

    Security teams must operate in the same manner. Their job must be tactical, working to reduce their involvement in the process and giving more responsibility to the developers. Cases will arise where their expertise is needed, but general inquiries should be kept to a minimum. 

    Tooling Change: From Security Tools to Developer Tools

    Before DevOps kicked in, app performance monitoring (APM) was owned by IT, who used synthetic measurements from many points around the world to assess and monitor how performant an application was. These solutions were powerful, but their developer experience was horrible. They were expensive, which limited tests developers could run. They excelled in explaining the state through aggregating tests, but offered little value to a developer trying to troubleshoot a performance problem. As a result, developers rarely used them. 

    Then, New Relic came on the scene, introducing a different approach to APM. Their tools were free or cheap to start with, making it accessible to all dev teams. They used instrumentation to offer rich results in developer terms (call stacks, lines of code), making them better for fixing problems. This new approach revolutionized the APM industry, embedded performance monitoring into dev practices and made the web faster.

    The same needs to happen for application security. If developers are the ones making impactful security decisions, then the most important users of security tools are no longer security folks—but rather developers themselves. Security tools should therefore focus on achieving developer adoption first and foremost, even when it comes at the expense of more effort by the security person involved. 

    Governance Change: From Blocking to Monitoring

    One of my favourite DevOps adages is, “If it moves, measure it. If it doesn’t move, measure it in case it moves”. It embodies just how critical it is to successfully monitor your running application. While CI/CD pipelines help you get software to production, monitoring gives you the confidence to do it at speed. You don’t need to worry so much about shipping a bug when you’re confident you’ll find out about it quickly and revert or roll out a solution.

    Security needs to embrace this approach. Finding out a security vulnerability has just been deployed and acting on it is almost as good as blocking it just before it was deployed—and far less disruptive. But to embrace this, you’ll need to invest in monitoring. 

    Developers are the first step in the application process. It makes sense that they are also the engineers of security solutions. Empowering developers to make security-first decisions allows IT teams and security professionals to address different parts of the business, saves time in the development process and ultimately creates stronger applications and outcomes.