Tag: monitoring

  • Six Routing Challenges When Managing Microservices in Production and How to Avoid Them

    Six Routing Challenges When Managing Microservices in Production and How to Avoid Them

    Even experienced DevOps teams can struggle with the nuances of managing microservices in production–where a greater spotlight on network communications can introduce new operational challenges beyond those common to traditional architectures. But, by being smart about your software-based routing components, it’s possible to avoid or reduce the impact of roadblocks in the following areas.

    Implementing Tracing and Monitoring

    Even applications that are rigorously tested during development will exhibit anomalies in production. To address these, DevOps teams require effective tracing and monitoring tools to gain visibility into what’s happening within clusters at runtime.

    As a strategy, developers should select routing solutions that integrate well with their existing monitoring and tracing backends. Remember that while a microservice may be developed by a certain internal team, once deployed it becomes available for others. If the application is instrumented to be traceable, compatible tracing tools can dynamically identify the source of service invocations and their call flows–enabling other teams to utilize the microservice. When the application is also designed to provide metrics, monitoring tools can usefully track the microservice’s key resource consumption metrics to assess the scalability of its subcomponents under load, and recognize any performance limitations that require attention.

    Because all inter-service communications travel through software routing elements, you can strategically design your application to enable microservices tracing and monitoring data to be collected. Teams can then put this data to work to more easily overcome challenges when building out new capabilities.

    Mitigating Communication Failures

    Considering the myriad communications taking place within production microservices-based environments, it only makes sense that this architecture will be prone to communication failures in which microservices simply cannot be reached. Whether these failures occur as the result of an error by the container, host, a network partition, or a short-term interruption in the availability of the service itself, resilient safeguards must be in place to mitigate any impact to an application’s user base. 

    For example: When an instance fails, the load balancer can be used to automatically reroute requests to healthy instances, and then return traffic to the failed instance upon detecting that it’s again available. In scenarios where an entire microservice becomes unavailable, client services should leverage circuit breaking to stop requests, return an error and initiate a fallback response. Doing so avoids dangerous repetition of retry requests, which only eat up resources and can lead to cascading failures.

    Each of these mitigation strategies could be accomplished by placing the necessary logic with each client. However, this technique would be both cumbersome to implement and prone to errors. The better approach to these challenges is to leverage routing solutions to perform instance health checks and circuit breaking, allowing DevOps teams to control how their applications respond to faults, rather than relying on logic at the network layer.

    Handling Unanticipated Load Spikes

    In production environments, loads can spike unexpectedly and for any number of reasons–ranging from simple sudden popularity with users to malicious distributed denial-of-service (DDoS) attacks. Whatever the root cause, applications must be well-prepared to withstand these events without failing.

    To ready applications to handle load spikes, rate limiting is a simple (but powerful) technique that allows operators to specify the request rates to front-end services. Implementing this safeguard through a routing solution answers the challenge of avoiding downtime due to surprise changes in load intensity.

    Securing Microservices Communications and Permissions

    Security is always a constant concern when it comes to operating production deployments. However,  microservices environments often have absolutely zero enforcement of internal network communications permissions. They also face the challenge of implementing proper encryption to secure sensitive data within both internal and external traffic. 

    While allowing any service to access any other offers flexibility, the risks are substantial. In order to safeguard microservices that access and expose sensitive data, it’s wise to limit access to only those client services with a vetted business justification. Routing technologies make it possible to enforce these secure policies using network segmentation.

    At the same time, routing solutions can help businesses encrypt the in-flight transport of critical data, which is not only a best practice, but in many industries a necessity from a regulatory compliance perspective. Service meshes can offer the benefit of providing secure TLS encryption for all internal east-west traffic, while edge routers offer to encrypt external north-south using a provided certificate. Also of note for north-south traffic: combining routing technology with services such as Let’s Encrypt can serve to fully automate lifecycle management of trusted certificates, eliminating the need for human intervention entirely.

    Achieving High Availability

    Leveraging software routing technology to achieve high availability is more cost-effective and efficient than traditional hardware failover solutions. It offers the opportunity to build production microservices environments that are quite resilient. For example: Routing implementation should utilize a highly-available architecture that includes a horizontally scalable data plane and a separate fault tolerant control plane. While the data plane allows for adding instances as necessary to meet capacity and resilience needs, the control plane is prepared to tolerate failures and ensure that users experience seamless and uninterrupted uptime.

    Deploying Across Multi-Cloud and Heterogeneous Environments

    Larger enterprises often utilize deployments across multiple cloud and/or on-prem environments, each of which may rely on disparate container orchestration technologies. Highly portable routing technologies capable of supporting a range of orchestration tools can vastly reduce the challenges developers face in supporting multiple environments. This allows them to deploy the same familiar solution and a common routing layer model across deployments.

    Routing technology is a key variable in determining the capabilities and ease with which DevOps teams are able to overcome challenges to the success of their production microservices deployments. By making a carefully considered choice in selecting a routing solution, teams can better prepare for these challenges–or even avoid them altogether.

    — Manuel Zapf

  • Red Hat Bolsters RHEL 8 Monitoring

    Red Hat Bolsters RHEL 8 Monitoring

    Red Hat is looking to expand the number of organizations embracing best DevOps practices by expanding the monitoring capabilities included in Red Hat Enterprise Linux (RHEL).

    The beta release this week of RHEL 8.2 includes an update to Performance Co-Pilot (PCP), a system performance toolkit that now includes collection agents for Microsoft SQL Server 2019 databases.

    Scott McBrien, a principal product manager for Red Hat, said by extending the scope of the performance toolkit, Red Hat is looking to make it easier for IT generalists and developers to collaborate across silos to better maintain application performance levels. Support for Microsoft SQL Server 2019 is an outgrowth of the alliance Red Hat formed with Microsoft way back in 2015. However, McBrien said IT organizations should expect Red Hat to continue to expand the reach of PCP.

    RHEL 8.2 Beta also simplifies the process of invoking the Red Hat Insights analytics service during the installation process and provides tighter integration with the extended Berkeley Packet Filter (eBPF) to better analyze network traffic.

    Finally, the latest version of RHEL extends an Applications Stream capability to segregate runtimes and languages to additional programming environments and provides a tool to test in-place upgrades to RHEL 8 from RHEL 6/7.

    McBrien said Red Hat is trying to keep to a six-month upgrade cycle of RHEL to provide IT organizations with a more predictable timetable. Of course, most of Red Hat customers are still running RHEL 6/7 releases. However, as the rate at which applications are built, deployed and updated continues to accelerate in the age of DevOps, the more pressure there will be on IT teams to maintain application performance levels across an increasingly extended enterprise. Inevitably, IT generalists will need access to a broader range of observability tools at all layers of the stack to keep pace.

    Adoption of DevOps practices across the enterprise remains uneven at best. However, as more IT generalists are exposed to richer monitoring tools at the operating system level, the easier it becomes to augment or supplant legacy ITIL-based approaches to managing IT. In fact, as tools at the disposal of IT generalists become more sophisticated, the need to rely on various classes of IT specialists declines. Most IT organizations are especially keen to achieve that goal because labor stubbornly remains the single biggest cost of IT.

    It remains to be seen to what degree the management of IT will be transformed in the months and years ahead. The one thing that is certain is IT will become more complex as new architectures based on microservices and serverless computing frameworks get adopted. Each additional layer of abstraction may make it easier for developers to build applications, but from the perspective of the IT operations teams, they tend to increase dependencies between systems that are already fairly fragile. The challenge now is to identify where bottlenecks exist between all those systems before a degradation in application performance becomes a full-blown catastrophic event.

    — Mike Vizard

  • IBM Open Sources SysFlow Monitoring Platform

    IBM Open Sources SysFlow Monitoring Platform

    IBM has announced that its SysFlow monitoring platform is now available as an open source project.

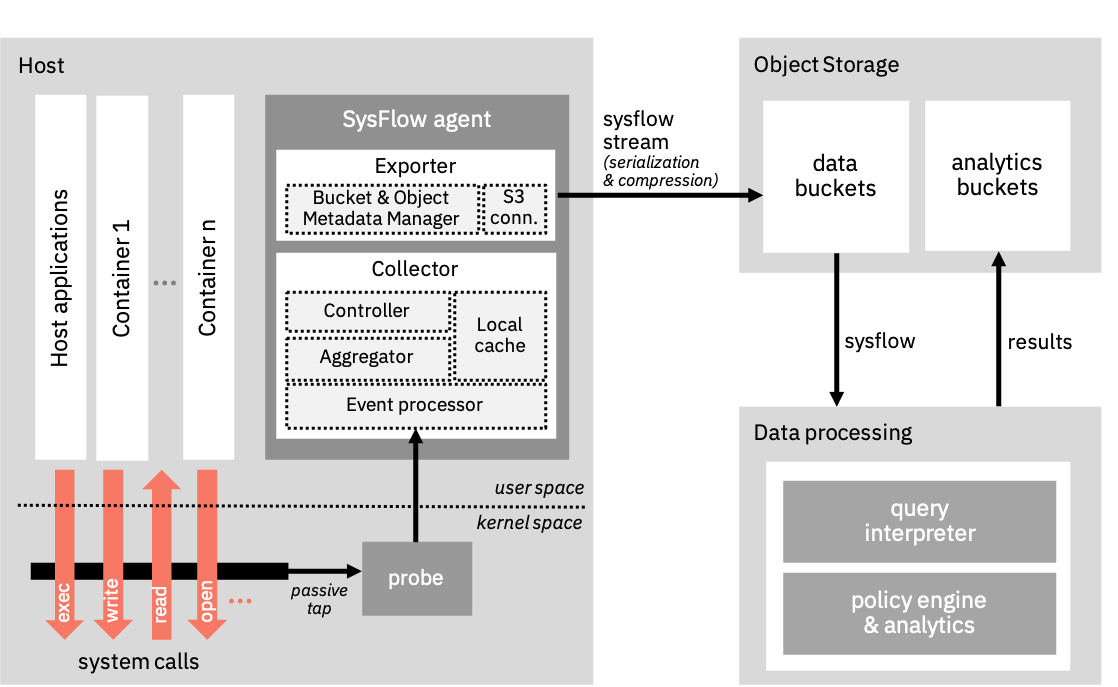
    Fred Araujo, a research scientist in the Cognitive Cybersecurity Intelligence Group at IBM Research, said IBM developed lightweight SysFlow agent software and monitoring tools as a way to provide more context around the telemetry data being collected while simultaneously reducing the amount of data that needs to be stored.

    SysFlow encodes a representation of system activities into a compact format that records how applications interact with their environment, Araujo said, noting that level of context provides deeper visibility in everything from container workloads to cybersecurity forensics. However, unlike existing monitoring platforms, SysFlow doesn’t require IT organizations to collect a massive amount of data to achieve that goal—it is intended to provide for a superset of the NetFlow framework used to analyze network traffic patterns to capture system events, he said.

    Araujo noted IBM doesn’t envision SysFlow eliminating the need for legacy log analytics platforms, as they provide a way to analyze log data. However, SysFlow does enable IT organizations to apply analytics via a graph-like visualization to surface patterns that goes beyond a comparative simple rules-based approach, said Araujo. For example, SysFlow’s approach will make it easier to uncover the relationship between various events that make up a cybersecurity attack and subsequently to identify what countermeasures to employ to create the appropriate kill chain response. It also should substantially reduce the amount of fatigue cybersecurity teams experience from chasing down false-positive alerts, he said.

    SysFlow is designed from the ground up to integrate with both open source frameworks such as Apache Spark and commercial analytics platforms via an open serialization format and associated libraries. IT organizations also can leverage a set of reusable components and APIs to make it easier to deploy telemetry probes. IT organizations also can take advantage of an extensible policy engine that can ingest customizable security policies described in a declarative input language, which then can be checked against records captured by SysFlow.

    Araujo said IBM developed SysFlow to address the challenges associated with managing application workloads in public clouds, but the framework can be applied to any on-premises IT environment to create a single pane of glass through which multiple platforms can be monitored.

    Regardless of the platform on which a workload is deployed, Araujo said as more responsibility for managing and securing applications shifts left toward developers in the age of DevOps, those teams need access to more sophisticated tools that are readily available and simple to deploy. There are several open source initiatives underway to provide that visibility, and one day many of them might coalesce into a single initiative.

    In the meantime, as the dependencies between applications and IT infrastructure continue to increase, it’s clear IT monitoring as a core part of any set of best DevOps practices is now an absolute requirement to achieve and maintain observability.

    — Mike Vizard

  • GitLab Open Sources Monitoring Tools

    GitLab Open Sources Monitoring Tools

    GitLab has decided to make its monitoring and observability tools available as part of its core open source platform to help reduce the total cost of DevOps. Previously, the tools were available as part of the commercial tools in GitLab’s DevOps platform.

    Kenny Johnston, director of product/Ops products for GitLab, said that as responsibility for observability shifts left, it is clear developers are now exercising more influence over which monitoring tools are employed. As developers begin to employ monitoring tools early in the application development process, most of them prefer open source tools because it’s unclear whether the application being developed will ever make it into a production environment, he said.

    However, if the application does make it into a production environment, it can be challenging for developers to make a case for standardizing on whatever monitoring tools they’re using in place of an existing commercial offering employed by an IT operations team. In addition to reducing costs, the GitLab approach could serve to eliminate any potential friction in the DevOps environment, as applications move from development into production environments.

    GitLab’s move to make its monitoring tools available as open source software comes at a time when more telemetry applications being employed to collect data are also based on open source software. In addition, developers of modern cloud-native applications based on containers are taking advantage of open source Prometheus monitoring software developed under the auspices of the Cloud Native Computing Foundation (CNCF) to monitor their applications. GitLab already provides integration with Prometheus.

    GitLab is also making it clear it expects its monitoring tools to benefit from the contributions of a larger pool of developers. Specifically, GitLab is calling for help in the areas of ongoing integrations with Prometheus along with improved logging, tracing and alerting capabilities.

    It’s not at all clear just yet to what degree DevOps teams will prefer to rely on open source versus commercial monitoring tools. While open source tools have some obvious advantages in terms of cost, many organizations have already standardized on commercial monitoring tools for a wide variety of existing applications. Open source tools often are more difficult to deploy and don’t tend to provide as much observability depth for IT operations teams. In addition, most of the providers of commercial monitoring tools are integrating their offerings with both open source telemetry software and Prometheus to bridge any divide that might occur between when an application is developed and deployed in a production environment.

    The one thing that is clear is a lot more individuals within the IT environments will be accessing these tools now that developers increasingly are being held accountable for the performance of their applications in production environments. In addition, modern applications require monitoring tools to make sense of all the dependencies that existing between microservices. Previously, IT operations teams tended to limit usage of monitoring tools based on commercial software to their most critical applications because of the costs involved. With the rise of open source monitoring tools, the opportunity to apply monitoring more broadly becomes more economically feasible.

    Regardless of the path forward chosen, the more visibility into IT environments provided, the easier it becomes to embrace best DevOps practices.

    — Mike Vizard

  • SolarWinds Acquires VividCortex for Database Monitoring

    SolarWinds Acquires VividCortex for Database Monitoring

    SolarWinds announced this week it is extending its portfolio of DevOps tools with the acquisition of VividCortex, a provider of tools for monitoring a wide range of databases that is delivered as a set of software-as-a-service (SaaS) applications.

    Company president and CEO Kevin Thompson said the acquisition of VividCortex adds a database monitoring platform capable of monitoring so-called cloud-native databases such as MySQL, PostgreSQL, Amazon Aurora, MongoDB and Redis, complementing the company’s existing tools for monitoring databases to support legacy applications.

    In addition, Thompson noted the VividCortex tools are highly extensible; support for a new database can be added within 90 days.

    VividCortex claims to have nearly 300 customers today, including Etsy, GitHub, SendGrid, DraftKings and Yelp. SolarWinds, meanwhile, boasts more than 300,000 customers.

    Thompson said the number of databases organizations need to monitor is increasing as open source alternatives gain ground on proprietary databases. The result is a hybrid computing environment that requires tools to manage centrally since it’s not practical to try and master each set of monitoring tools provided for each database platform, added Thompson.

    SolarWinds VividCortex

    IT organizations also want to be able to compare and contrast the cost of deploying workloads on databases running in different environments, he added. Many IT organizations have already discovered that the cost of deploying certain types of workloads on public clouds is more expensive than anticipated.

    Thompson said it’s not really feasible to observe an application without being able to monitor the underlying database on which that application depends. In this respect, VividCortex adds a critical capability for DevOps teams, he said. SolarWinds intends to integrate VividCortex with a growing portfolio of DevOps tools that already includes a range of application performance management (APM) and infrastructure management tools. As is always the case, Thompson said IT organizations should also expect SolarWinds to drive the cost of employing database monitoring tools lower.

    As IT continues to evolve Thompson said SolarWinds believes many more organizations will embrace best DevOps practices. Much of that effort will involve retraining existing staff, because there are not enough college graduates to fill a rapidly expanding skills gap within IT organizations.

    It’s not clear to what degree lowering the cost of tools will accelerate the transition DevOps. Many organizations already rely on open source tools. However, the total cost of setting up and maintaining those tools often winds up being higher than a SaaS platform. In addition, all the upgrades to the SaaS platform are handled by the provider of the service.

    In many cases, developers wind up embracing open source tools to lower the cost of building an application, which the IT operations team then manages using commercial tools once that application is deployed in a production environment. In some cases, however, open source tools embraced by developers also end up being employed in the production environment. In either case, IT organizations now have more tools to choose from than ever.

    — Mike Vizard

  • LogicMonitor Embraces AIOps

    LogicMonitor Embraces AIOps

    LogicMonitor today announced the general availability of LM Intelligence, an extension of its monitoring platform that leverages machine learning algorithms to identify potential issues that are indicative of a major impending outage.

    Sarah Terry, manager of product management for LogicMonitor, said rather than acquiring a separate AIOps platform, it makes more sense to employ machine learning algorithms within the context of a tool that DevOps teams already are using to monitor their IT environment. Monitoring platforms collect the massive amount of data required to train those algorithms, but a separate AIOps platform has to find a way to collect that data, noted Terry.

    The LM Intelligence module created by LogicMonitor provides a root cause analysis (RCA) capability that automatically discovers infrastructure topology in both cloud and on-premises IT environments. Once an issue is discovered, LM Intelligence will aggregate all the alerts being generated into a single notification that pertains to the root cause of any potential issue. That capability will substantially reduce the amount of alert fatigue that today results in IT teams often disregarding what could be a critical alert that would have averted a system failure, said Terry.

    DevOps teams can also employ LM Intelligence to define expected performance ranges for IT resources based on historical trends. Any anomaly outside those ranges will generate a notification.

    As IT environments become more complex, thanks in part to the rise of multi-cloud computing and microservices-based applications based on containers, it won’t be feasible for the average IT team to identify all the relevant events that might be impacting that IT environment without help. There are simply too many parameters that need to be tracked. Tools such as LM Intelligence don’t replace the need for IT operations expertise as much as they augment the capabilities and expertise of the teams trying to manage complex IT environments, where there are large numbers of dependencies between systems. In effect, Terry said, tools such as LM Intelligence will enable DevOps teams to identify the signal in all the noise being generated within an IT environment.

    As IT management tools continue to evolve, DevOps teams should expect to see reliance on machine learning algorithms to become more pervasive. Rather than being a standalone platform, AIOps is quickly morphing into a feature that will become a capability embedded across a wide range of tools.

    Of course, each DevOps team will need to decide to what degree they want to trust any form of AI. However, the longer algorithms collect and analyze data, the more accurate they tend to become. That doesn’t mean DevOps teams should automate processes based on the recommendations of an AI engine; there are likely to be parameters that an AI engine may not have accounted for that could have an adverse impact. However, having the equivalent of a digital assistant that provides timely advice may soon prove indispensable.

    — Mike Vizard

  • Logz.io Adds Monitoring Service Based on ELK and Grafana

    Logz.io Adds Monitoring Service Based on ELK and Grafana

    Logz.io today at the AWS re:Invent 2019 conference launched Cloud Observability Platform, a monitoring and security cloud service based on ELK—open source Elasticsearch, a search engine; Logstash, a data processing pipeline; and Kibana, a set of visualization tools—and Grafana, an analytics and monitoring platform.

    Company CEO Tomer Levy said it’s become apparent that developers have a strong preference for open source tools for managing cloud-native applications. As such, the adoption of ELK has increased substantially. With the increasing maturity of Grafana, it’s also becoming clear that organizations want to meld the open source analytics and monitoring tool with previous investments in ELK tools, he said.

    However, not many IT organizations have a lot of ELK and Grafana expertise. To fill that gap, Logz.io is launching a managed cloud service based on Logz.io Log Management, an instance of ELK that the company has enhanced with machine learning algorithms and data analytics capabilities to enable DevOps teams to discover and resolve issues faster.

    That core platform is being extended via Logz.io Infrastructure Monitoring, a beta release of a monitoring platform based on Grafana, and a security information and event management (SIEM) platform dubbed Cloud SIEM, based on an ELK stack that includes built-in threat detection tools.

    In addition, Levy said Logz.io plans to add support for Jaeger, an open source distributed tracing tool being developed under the auspices of the Cloud Native Computing Foundation (CNCF).

    Levy said it’s apparent to all that observability is a core tenet of DevOps, which he said is why there are already a half-million developers making use of ELK software. The challenge organizations are finding is that monitoring modern IT environments based on cloud-native applications is cumbersome and time-consuming. Logz.io is addressing that issue by providing an enterprise-grade instance of an open source monitoring platform that comes with hundreds of built-in connectors, which enables DevOps teams to employ a monitoring platform without having to be worried about becoming locked in to a specific vendor because they can switch over to open source code anytime they like, Levy noted.

    Developers tend to favor open source tools because they don’t have to wait on purchasing approval to employ them. However, enterprise IT organizations tend to favor platforms that are supported by a commercial vendor. Logz.io is trying to address that issue by providing support for an open source platform that will make enterprise IT organizations comfortable enough to give up relying on a proprietary monitoring platform. Thus far, Logz.io has more than 700 customers, which the company expects to expand now that it has an instance of its platform that can be consumed as a cloud service.

    It’s too early to say to what degree an open source platform might usurp proprietary platforms in the enterprise. Change tends to come slowly to enterprise IT organizations. However, as organizations embrace next-generation applications based on microservices and containers, enterprise IT organizations are clearly evaluating their monitoring platform options going forward.

    — Mike Vizard

  • What It Really Takes to Build a Reliable App

    What It Really Takes to Build a Reliable App

    What makes an app reliable? If you ask most IT professionals that question, their minds immediately go to uptime. That’s not surprising; after all, it’s fashionable for software and infrastructure vendors these days to boast about how many nines of uptime they guarantee.

    To be sure, uptime is one component of delivering a reliable application experience for developers and end-users. But it’s only one. In order to build reliability into your application patterns, you must think beyond uptime alone.

    Keep reading for an overview of all the factors that go into achieving reliability.

    What Is Reliability?

    A reliable application is one that meets the needs and expectations of everyone it serves. While those needs and expectations will vary from case to case, reliability is characterized by the ability of an app to:

    • Be accessible when needed.
    • Respond within the time frame needed.
    • Be updated or modified as needed.
    • Provide security and privacy to the extent needed.
    • Meet the needs and expectations not just of end-users, but of everyone else who helps create or support the app.

    Maximizing Reliability for Cloud-Native Apps

    Achieving these features for modern, cloud-native applications requires a multi-pronged approach. The following are the core considerations to address in order to build reliability into an app pattern:

    Uptime

    We’ll start with uptime, which is the most obvious aspect of reliability. Uptime refers to the amount of time that your application is available, at least to some extent (as we’ll discuss below, merely being available does not necessarily mean that the app satisfies other requirements of reliability).

    Maximizing uptime typically involves solutions such as distributing workloads across different servers or data centers (so if part of your infrastructure fails, others remain available) and using automated failover to move a workload to new infrastructure if it fails in one location.

    Culture and processes are part of the picture, too, since you need to make sure your team is prepared to respond quickly to any incidents that arise, in order to minimize downtime.

    It’s worth noting, by the way, there can be such a thing as too much uptime. If you reach the point where adding more uptime doesn’t deliver any additional value to your organization, then it’s probably time to stop. Adding another nine to your availability, just because you can, might be a poor use of resources. So, be sure to factor this part of the equation into your uptime calculations and strategy.

    Performance and Efficiency

    In order to meet stakeholder needs and expectations, an application must not only be available, but also able to respond within the time frame required by those stakeholders. A website that is up 100% of the time but takes 20 seconds to load each page is not a very reliable website.

    This is why performance testing and monitoring must be built into your application delivery chain. You should also ensure that you rightsize infrastructure (for example, by choosing the right types of cloud instances) in order to guarantee that your applications have enough resources available to perform adequately. (Of course, this priority must be balanced with cost-control.)

    Accessibility and Usability

    An application that is available all of the time and responds quickly may still fail to meet stakeholder needs if it is difficult to work with due to poor design.

    From an end-user’s perspective, user-experience testing is the most obvious way to help mitigate the risk of poor accessibility or usability within your applications. But keep in mind that you also need to think about usability from the perspective of your own team. Make sure that access-control systems, infrastructure architectures and documentation can be navigated easily. You don’t want an application or a delivery chain that is too complex for your team to be able to support effectively.

    Security and Data Privacy

    A reliable application is a secure application. There are many obvious ways to help secure applications, such as using vulnerability monitoring tools. But remember security is not just about finding vulnerabilities as they arise or deploying certain tools. You must also build security into the design of your infrastructure, processes and culture.

    Backup and Recovery

    You don’t need to be a seasoned IT professional to know that backing up data is important for achieving reliability. When something goes wrong–which it occasionally will, despite your best plans and efforts–having a backup in place often means the difference between experiencing a blip in service and a major catastrophe.

    The thing that can be easier to overlook is the importance of having a disaster recovery plan in place as well as a backup routine. Simply backing up your data isn’t enough; you must also know how you’re going to restore it to new application instances quickly if disaster strikes. If, for example, all of your cloud-based virtual machines go down, what is the exact process you’ll follow for standing them back up? Identifying the steps ahead of time–and, ideally, scripting them so the recovery process can be as automated as possible–is crucial.

    Also important is quantifying how often you need to back up data, which is determined by a metric called Recovery Point Objective (RPO), and how quickly you need to be able to recover it to avoid serious business disruption–determined by Recovery Time Objective (RTO). Along similar lines, error budgets, which define how much time you can tolerate your production systems being down, can help you define the available time monthly for making system improvements.

    Modifiability

    Few apps are deployed and then never modified again. Instead, they must be updated or scaled constantly to meet changing needs and demands. That’s why designing an application pattern that can be easily modified is critical for achieving reliability over the long term.

    In practice, modifiability entails having the right tools (such as automated deployment solutions) and the right processes (such as clear feedback loops between ITOps and developers) in order to decide efficiently what modifications to implement. It might also involve taking advantage of infrastructure technologies (such as containers) that make it easy to update a running application without imposing downtime on users.

    Conclusion

    Reliability is more complex than it may seem. No matter how many nines are included in your SLAs, you are not guaranteeing true reliability unless you also address requirements such as performance, usability and modifiability.

    This sponsored article was written on behalf of Eplexity.

    — Chris Tozzi

  • The Challenge of Scaling Metrics in Distributed Systems

    The Challenge of Scaling Metrics in Distributed Systems

    Whether migrating from a monolithic architecture or building a distributed system from ground zero, there are many benefits to leverage from a microservices architecture–faster software deployment cycles, enhanced scalability, improved isolation of risk. However, distributed systems are complex and as such, accompanied by many challenges, particularly when it comes to the scalability of metrics.

    The Importance of Observability in Distributed Systems

    In order to realize the benefits of a distributed system, a strategy of data-driven optimization is essential. The paradox here is visibility simplifies complexity, while the complexity of visibility is dramatically increased in distributed systems.

    As New Relic points out in their eBook Cloud Native Is the New Normal, traditional monitoring approaches need to be adapted to meet the demands of decentralized architectures, including:

    • Overcoming the loss of end-to-end monitoring capabilities by learning how to connect the dots across a complex network of environments.
    • Developing tactics to quickly drill down into issues across interconnected parts to reduce mean time to resolution (MTTR).
    • Introducing proactive reliability strategies that focus on measurement first, followed by improvement.

    Finding the Right Balance Between Monitoring Nothing and Monitoring Everything

    Most application engineers leverage some sort of metrics tooling such as Grafana, Prometheus or Graphite to track vitals for their system health. While monitoring is essential, there is such a thing as bloat when it comes to metrics ingestion; and this overload translates to scalability challenges that affect performance, cost and reliability.

    So, how do you know what to monitor? In order to derive the most valuable insights from your system, you must first understand and identify the components, and more specifically which attributes within those components drive key metrics. Knowing this requires an intimate familiarity with how all the pieces work together in your distributed system.

    Google’s Site Reliability Engineering book provides a framework for determining what to monitor in distributed systems. They break signals down into four different categories:

    • Latency: Understand resource requirements and identify bottlenecks.
    • Traffic: Monitor system response to varying levels of load; most useful when paired with other indicators.
    • Errors: Track frequency and nature of interruptions in request/response flow.
    • Saturation: Surface capacity-related issues.

    Even when you’ve identified the most important metrics to track, scalability is still a challenge that must be addressed, particularly when dealing with applications that handle massive volumes of data across a complex application architecture.

    M3: Uber’s Open Source Large-Scale Metrics Platform

    A solution directly addressing the challenges of distributed metrics at scale is M3, an open source project developed by Uber’s engineering team.

    Before using M3, the Uber team sent metrics to a Graphite stack with storage handled using the Whisper file format in a shared Carbon cluster. From there, they created Grafana dashboards to visualize the data and used Nagios for alerting based on Graphite threshold checks via source-controlled scripts. As the volume of metrics continued to expand, manual processes to scale the solution became unsustainable and repeat failures resulting in permanent data loss led them to build a more fault-tolerant, scalable system.

    M3 is focused on providing a reliable storage solution for large-scale metrics over long retention periods, solving inherent single node-associated limitations with Prometheus by offering a multi-tenant store for Prometheus metrics. A key component of this solution is M3DB, the scalable storage backend for M3.

    M3DB, built in Go, is a distributed time series store and reverse index with configurable out-of-order writes. By enabling the storage of real-time metrics over long periods of retention, M3DB can replace a Prometheus cluster. In developing the M3DB solution, the Uber team essentially deconstructed Prometheus into microservices to enable the scaling of each component individually. By taking this approach, M3DB is able to offer better reliability, efficiency and performance.

    At a minimum, M3DB can be leveraged as remote storage for Prometheus (or used to replace any other remote storage solution). There are, however, other features the solution offers, including an external aggregation engine and a separate query engine.

    The M3DB project is still under development with a growing community of contributors.

    To learn more about containerized infrastructure and cloud native technologies, consider coming to KubeCon + CloudNativeCon NA, November 18-21 in San Diego.

    — Molly Wojcik

  • New Relic Bolsters Serverless Monitoring Strategy

    New Relic Bolsters Serverless Monitoring Strategy

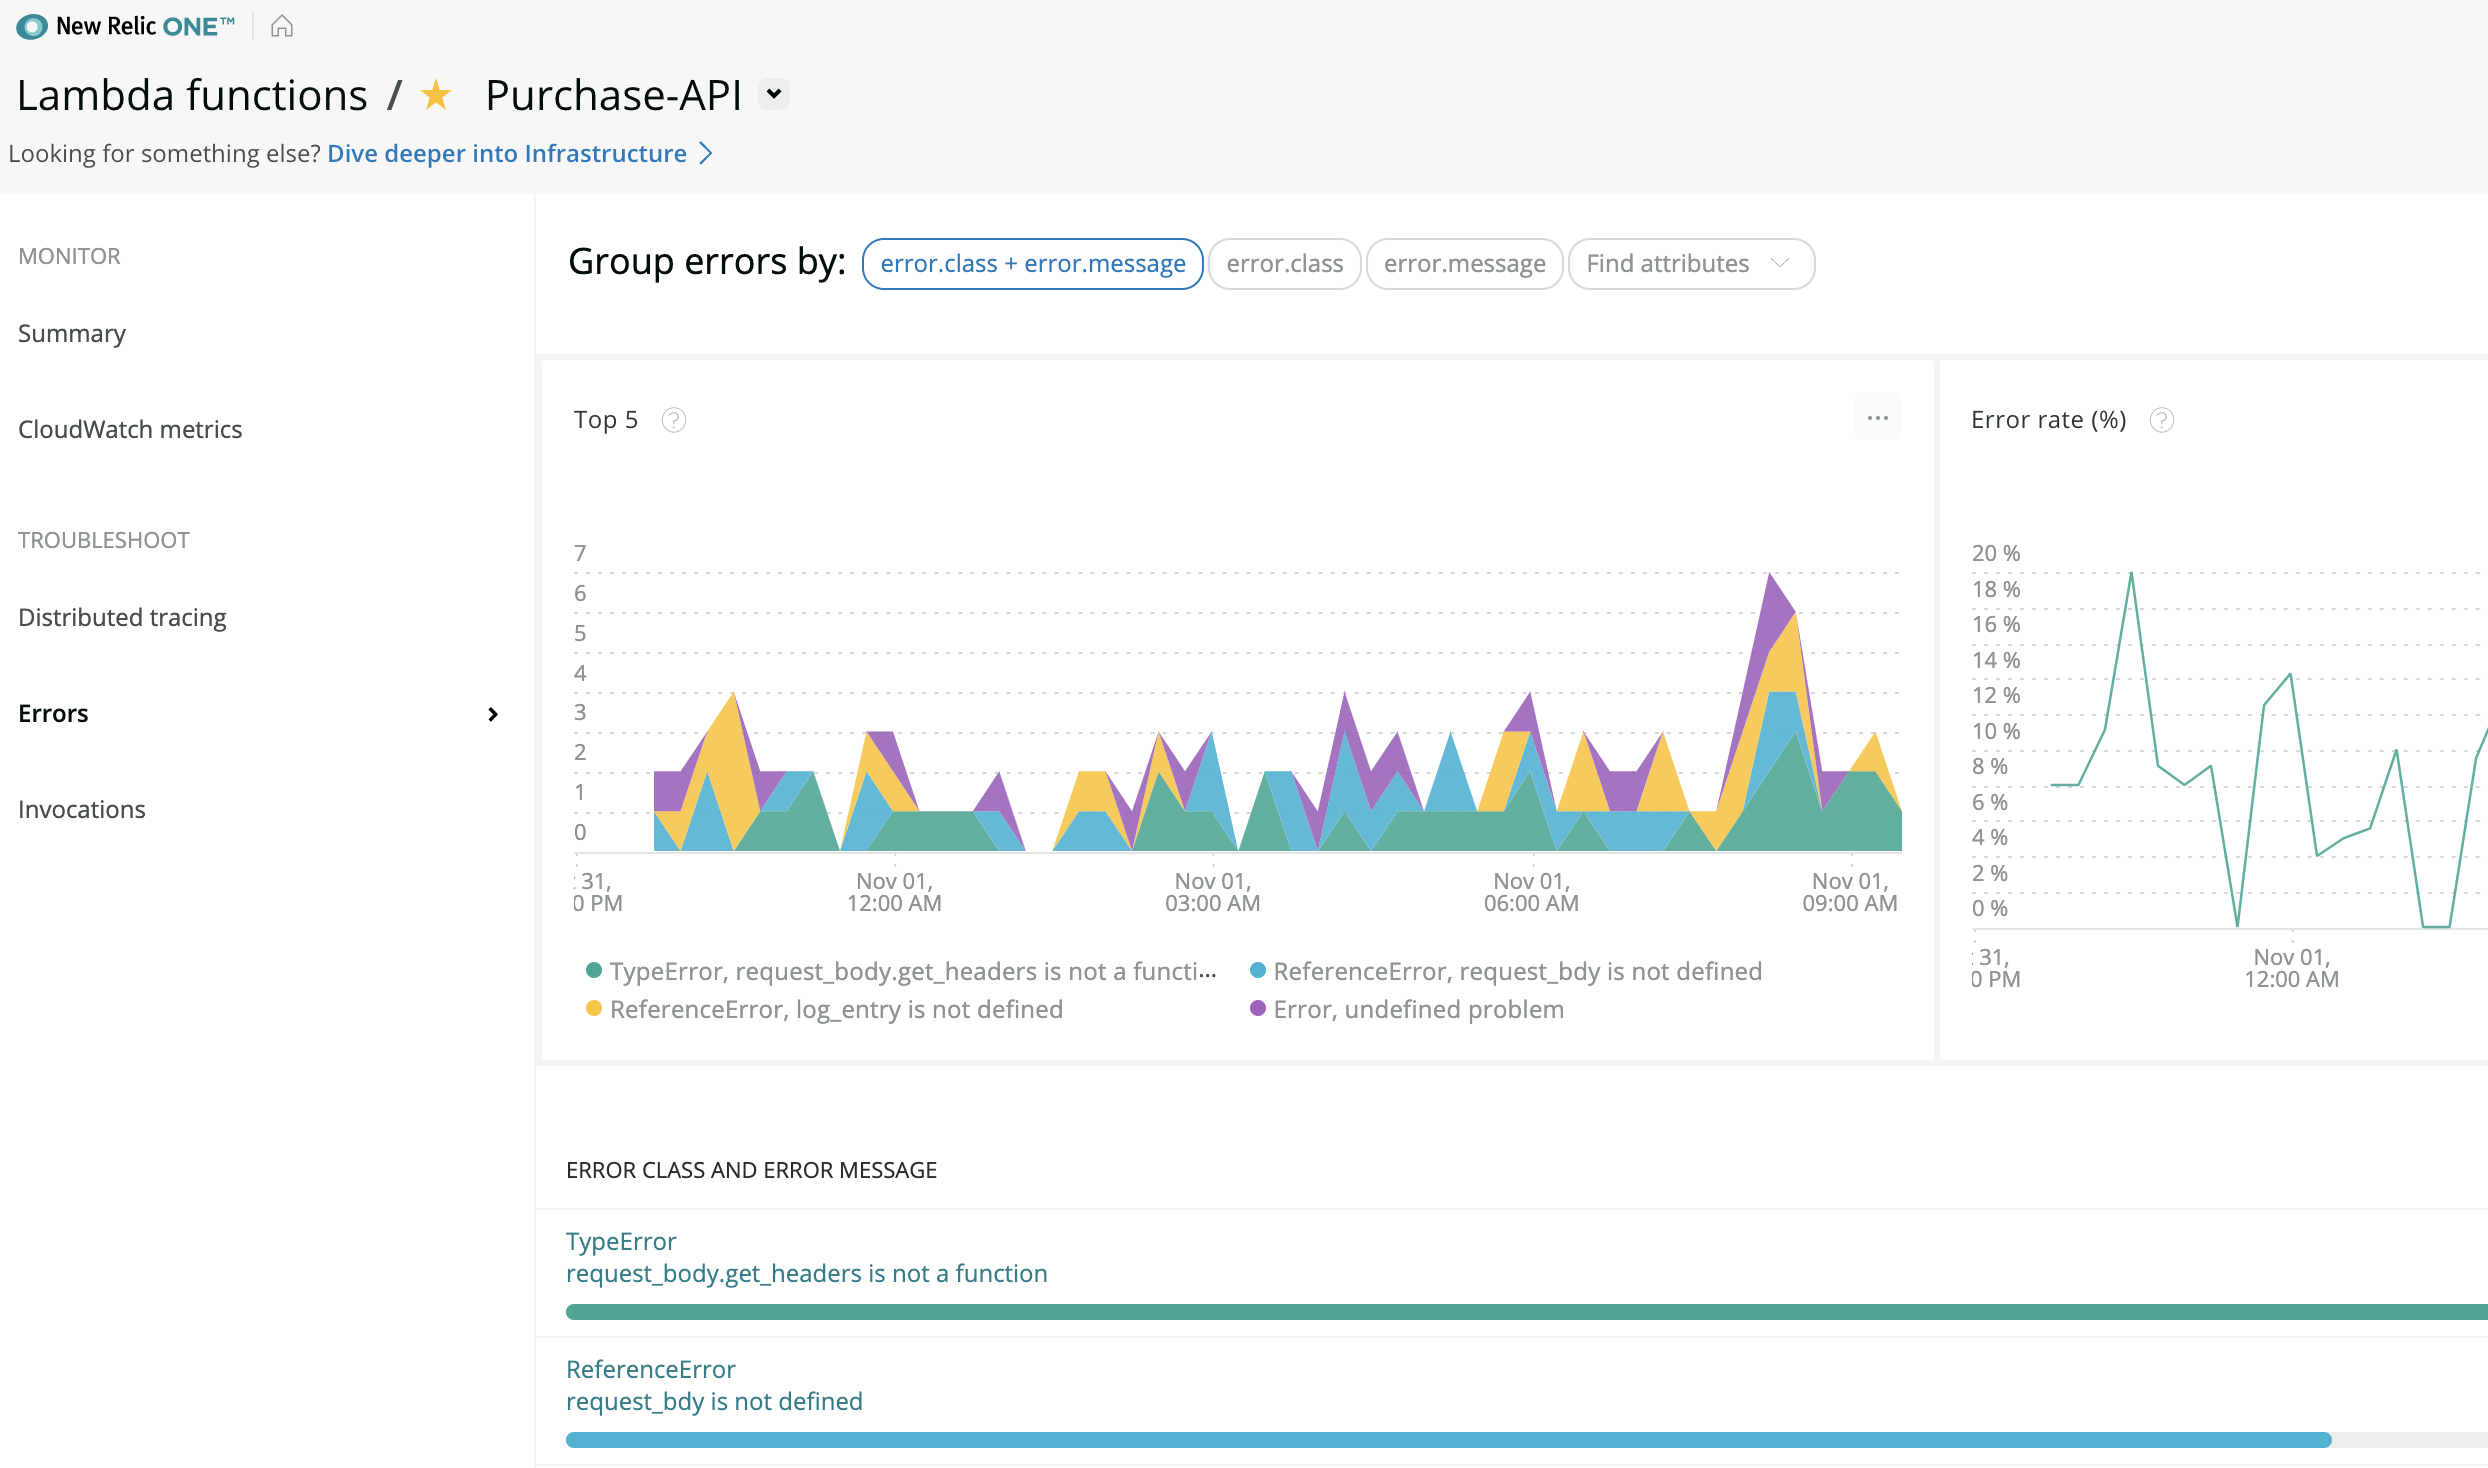
    New Relic has strengthened its ability to monitor serverless computing frameworks by acquiring IOpipe, a provider of a monitoring tool for the serverless computing framework service provided by Amazon Web Services (AWS).

    Andrew Tunall, general manager for serverless and emerging cloud services at New Relic, said IOpipe’s monitoring technology will be used to augment the monitoring tool for AWS Lambda included in the New Relic One platform, which was launched earlier this year.

    New Relic also plans to expand its observability capabilities for serverless computing to other platforms based on customer demand, said Tunall.

    Serverless computing frameworks are gaining traction because they enable developers to write less code within their applications by allowing them to employ functions to call on a cloud service to process, for example, analytics externally rather than within the application itself. The challenge serverless computing frameworks create from a DevOps perspective is they don’t create any logs that can be analyzed. Instead, monitoring tools need to be able to employ distributed tracing tools to analyze the streams of metadata that serverless computing frameworks create based on event-driven architectures. That requirement has forced providers of monitoring tools to extend the capabilities of their core platform to enable the consumption of that metadata.

    Adoption of serverless computing frameworks is already outpacing the ability of many DevOps teams to observe. According to AWS, hundreds of thousands of customers are already doing trillions of invocations a month of AWS Lambda. Gartner has predicted that by 2023, 100% of enterprises using IaaS or public cloud will also use some form of serverless platform-as-a-service (PaaS) capability in production applications, up from 25% in 2019. In most cases, those serverless computing frameworks will be employed to process stateless workloads, while stateful workloads continue to run on a virtual machine or within a container.

    While most of the usage of serverless computing frameworks thus far is on public clouds, it’s only a matter of time before organizations increasingly make use of multiple serverless computing frameworks in on-premises IT environments. There are already more than a dozen different types of serverless computing frameworks, most of which are being made available as open source projects.

    Naturally, the rise of serverless computing frameworks complicates DevOps even further. DevOps teams will now need to build, deploy and update applications that are making frequent external application programming interface (API) calls to potentially multiple serverless computing frameworks. Rather than requiring organizations to acquire separate tools to monitor serverless computing frameworks, New Relic is making a case for extending a single platform to monitor all the various types of IT platforms being employed.

    There’s almost no doubt most organizations will wind up invoking serverless computing frameworks in one fashion or another, but it’s too early to say how pervasive serverless computing frameworks will be. However, DevOps teams will be required to monitor those serverless computing frameworks alongside every other platform already being employed across an increasingly diverse IT environment.

    — Mike Vizard