Tag: monitoring

  • Datadog Adds Additional Generative AI Capabilities to Platform

    Datadog Adds Additional Generative AI Capabilities to Platform

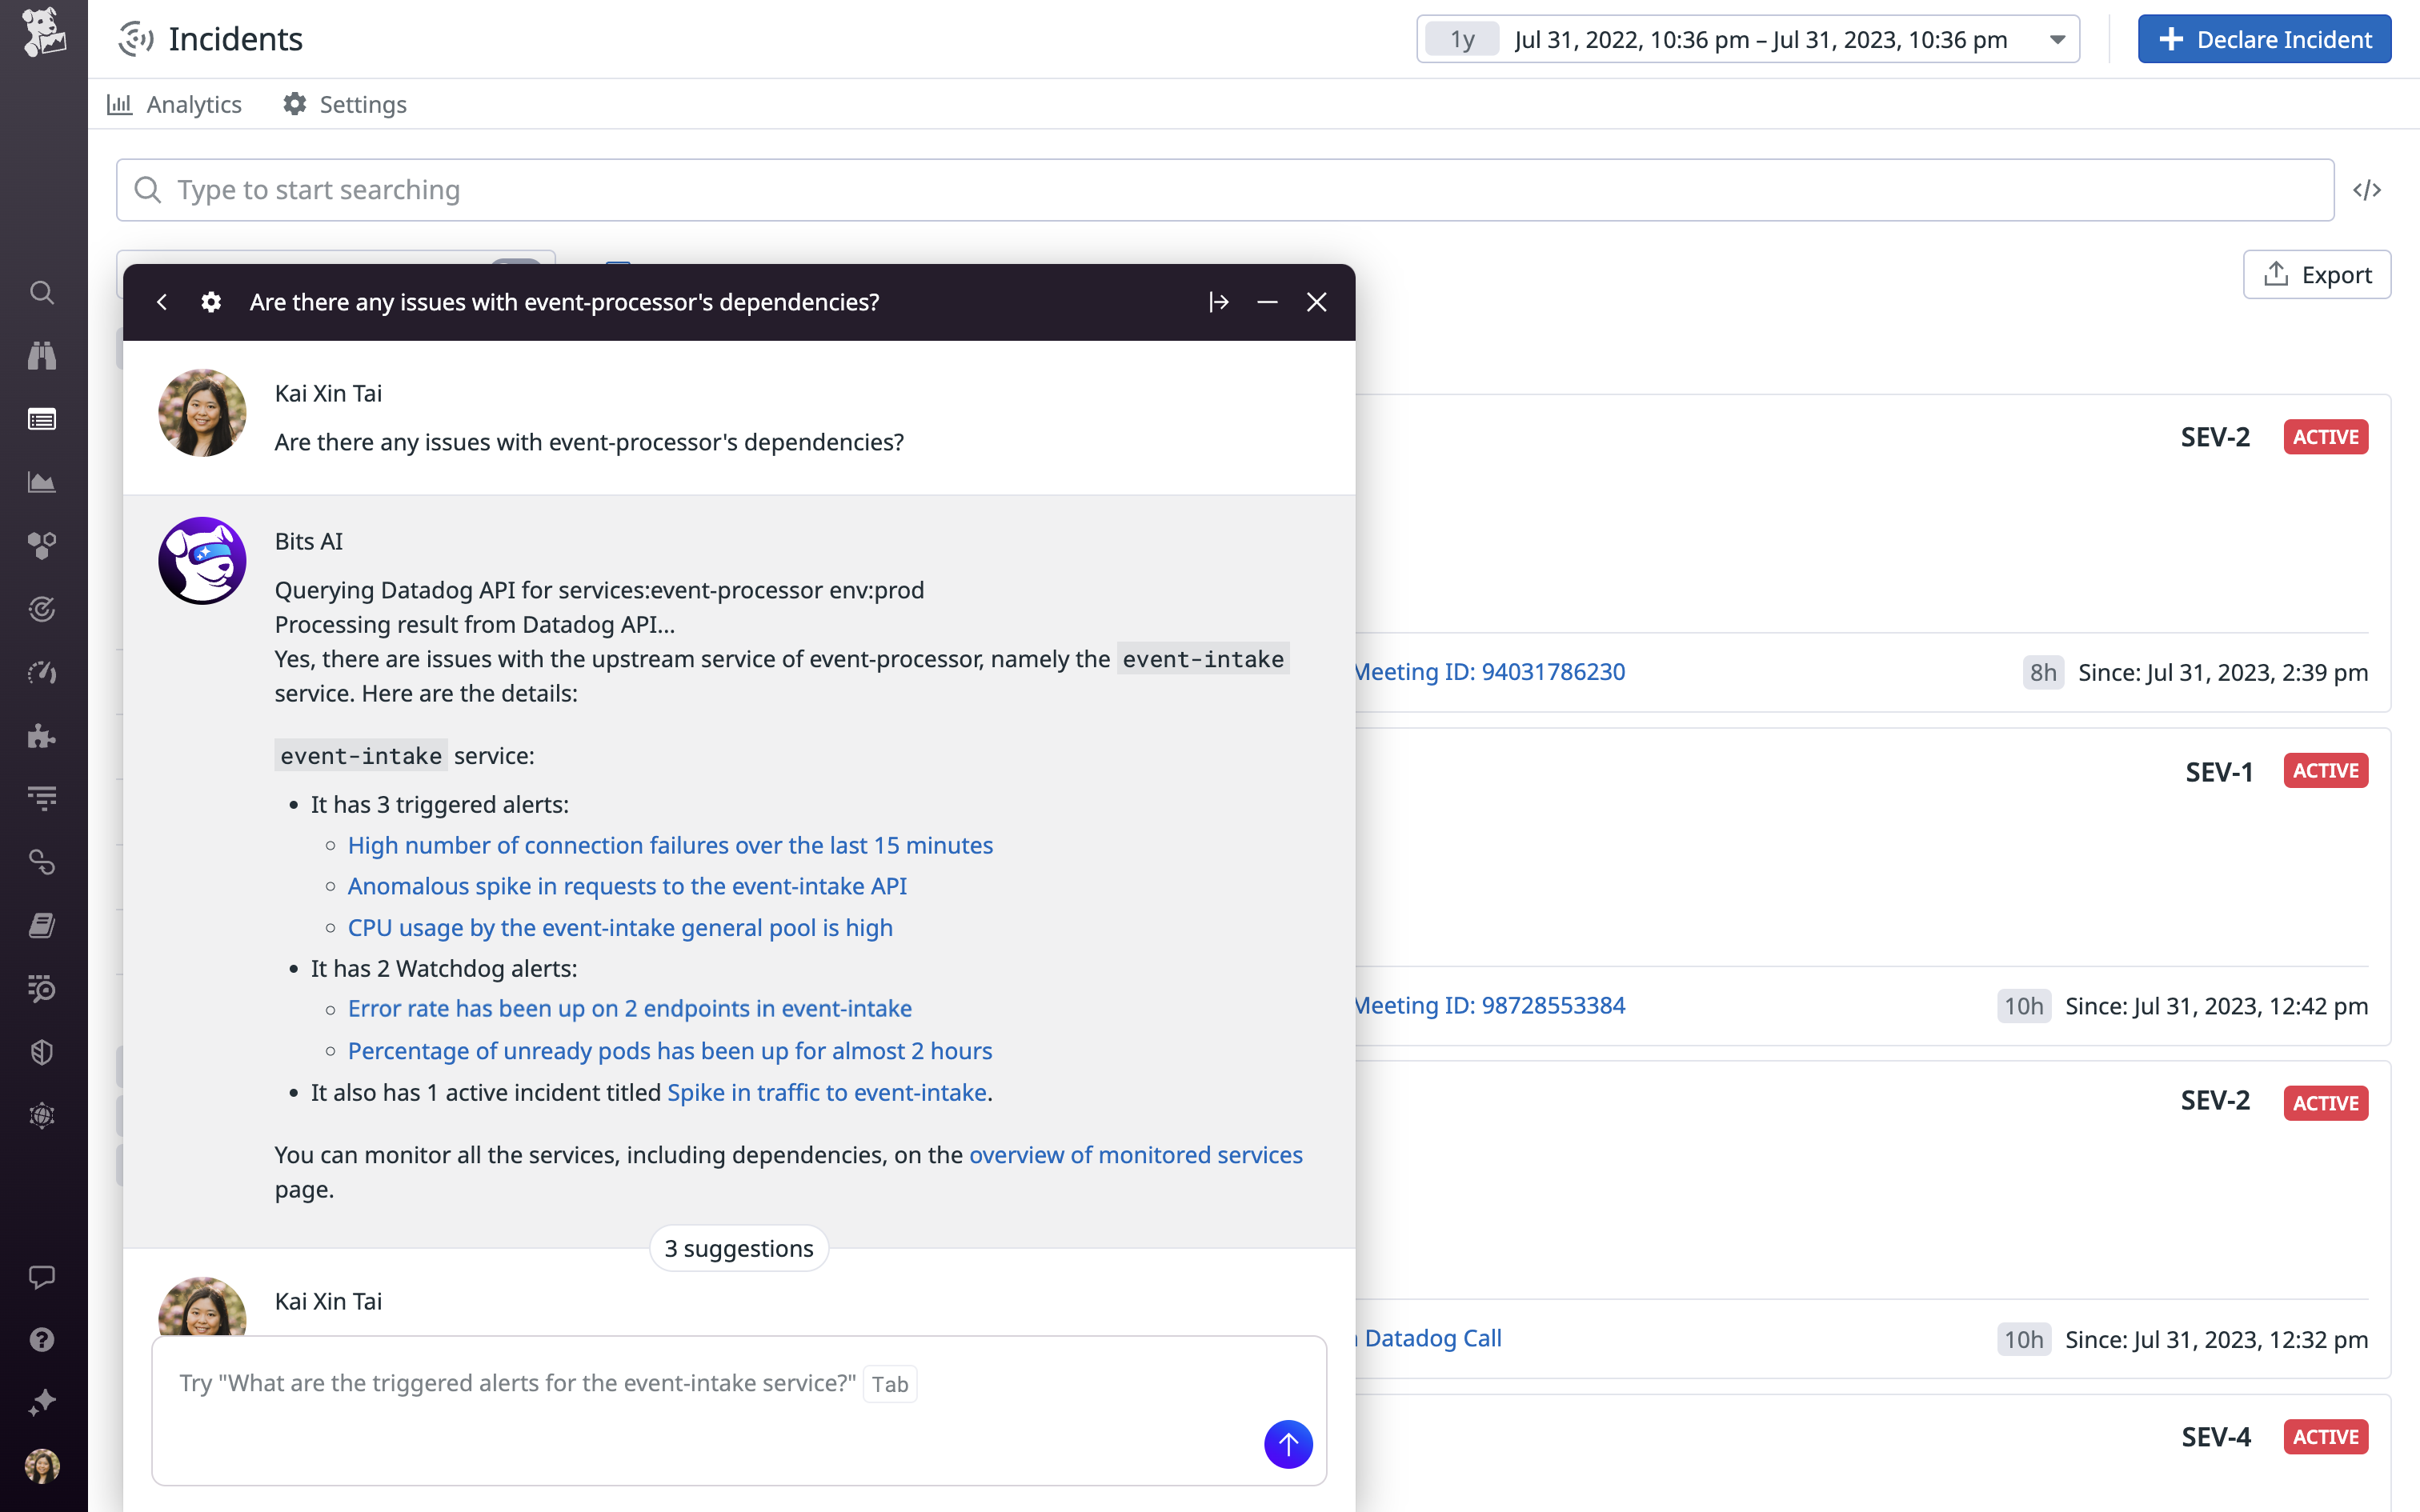
    At its DASH 2023 conference, Datadog today launched Bits, a digital assistant that uses generative artificial intelligence (AI) from OpenAI’s ChatGPT platform to provide real-time recommendations to resolve issues surfaced by the company’s observability platform.

    At the same time, the company announced it is extending the reach of that platform to enable IT organizations to monitor the large language models (LLMs) many are now embedding within custom applications.

    Datadog also released an LLM Observability platform in beta, which brings together data from applications, models and various integrations to help engineers discover and resolve AI issues in applications such as performance degradations, drift and hallucinations in real-time.

    Those extensions complement an existing ability to monitor the usage patterns of application programming interfaces (APIs) making calls to the OpenAI ChatGPT platform.

    Yrieix Garnier, vice president of product at Datadog, said the generative AI capabilities in beta are enabled by data the company used to extend the core capabilities of OpenAI’s ChatGPT platform.

    Bits AI learns from both customer data and other sources to answer queries via a natural language interface that makes the Datadog platform more accessible to a much wider range of IT professionals, noted Garnier.

    The overall goal is to reduce the mean-time-to-resolution for issues by, for example, explaining errors and suggesting code fixes that can be easily shared with developers via a Slack communication channel.

    Those capabilities extend the functionality of the machine learning algorithms that Datadog has already embedded within its platform, noted Garnier.

    While the generative AI capabilities added to the core Datadog platform will make DevOps teams more efficient, it’s not quite clear what role those teams will play in monitoring LLMs created by data science teams. In theory, DevOps teams should be responsible for optimizing the performance of any element of an application, but most DevOps engineers today don’t tend to have much experience with LLMs that are created by data science teams.

    At the very least, however, DevOps engineers should be able to share the root cause of an issue that is adversely affecting those LLMs with those data science teams.

    It’s not clear how quickly LLMs will be incorporated into applications, but most DevOps teams should expect them to soon be pervasive. In effect, Datadog is now providing DevOps teams with the AI tools they will need to effectively monitor applications infused with AI capabilities. The issue is not so much whether DevOps teams will be taking advantage of AI to better manage application environments but how quickly. Given the overall level of complexity DevOps teams regularly encounter, few are likely to want to take on that challenge without some level of AI augmentation.

    The challenge is determining exactly what DevOps tasks might be best handled by a machine that enables software engineers to focus on more complex issues they previously didn’t have the time to address.

  • Is Your Monitoring Strategy Scalable?

    Is Your Monitoring Strategy Scalable?

    Every company is trying to get better insights into its operational effectiveness, and they are running into the same problem: Scale. So what does a scalable monitoring strategy look like and how can you safeguard against the most significant issue in observability?

    What is a Scalable Monitoring Strategy?

    We’ll begin by identifying the two things most impacted by scale: Cost and performance. Cost can be broken down into storage and computation. It is obvious that to hold more data, more storage is needed, but what about compute power? This is important because queries need to search through more data—and thus, use more compute power—to return a result.

    This creates a trade-off between performance and cost-effectiveness. It becomes more and more challenging to have queries that resolve instantly as the dataset increases, so engineers will often simply tolerate a performance decline. This further impacts usability and the general usefulness of the system. If it takes 10 seconds to resolve every query, you’ve just cut down your data discovery efficiency by a factor of 10.

    Scaling Means Performance and Cost-Effectiveness

    To scale a monitoring strategy, a wise architect needs to break this standoff between performance and cost and approach the problem like a data scientist. A scalable monitoring strategy starts with a simple question: What is the use case for this data?

    Some data is only ever ingested because it might be needed. It spends its entire lifetime undisturbed and is eventually compressed or deleted. On the other hand, some data is queried every minute of every day and is integral. Knowing how data is used means an engineer can decide the value of that data.

    In the battle to create a scalable monitoring strategy, there’s a three-step approach.

    Step One: Track Data Usage

    Which data is ingested and never queried? Which data never spends any time at rest? Build a map of how often data is consumed so that any strategic choices are informed by the use case.

    It is most common to group data into three different use cases:

    Frequent Access – Data that is constantly queried and needs to be available at a moment’s notice.

    Monitoring – Data that drives dashboards or trains machine learning models but which is largely useless after it has been processed.

    Compliance – Data that is held in case it is needed, but it is only queried sometimes. For example, audit logs.

    Step Two: Optimize Storage and Consumption

    Once the use case of data—whether it’s logs, metrics or traces—is understood, the next stage is to optimize. This means creating different storage and query solutions for the different usages we’ve seen above.

    Frequent Access – Rapid queries that can be optimized and tuned. OpenSearch is a good option, although management overhead can be painful, especially at scale.

    Monitoring – This is largely about transforming data. For example, ingesting logs, converting them into metrics and deleting the original log. This is very powerful because metrics take up far less space than logs and can be stored much more cost-effectively.

    Compliance – Low-cost storage like Amazon S3 is a good option, but this data must still be accessible, even if simply by reindexing.

    How Easy is it to Build These Capabilities?

    It is trivial to create an OpenSearch cluster, but it’s challenging to manage it at scale. Likewise, it’s simple to convert logs to metrics, but doing so in a performant way at scale is complex. Holding onto compliance logs as they scale near infinitely can be difficult, and reindexing this data is a non-trivial operation when dealing with large data volumes.

    However, the key takeaway from this analysis should be that these are capabilities that any organization should have if they intend to scale their monitoring solutions. If they can be attained through a SaaS vendor, then this is a serious option to consider because it enables companies to immediately take advantage of this capability without the upfront, unpredictable and often ongoing cost of in-house engineering.

  • Observability Costs are too Damn High

    Observability Costs are too Damn High

    Today, any business that deploys software faces an obscene amount of expenses. It has to pay for cloud hosting, assuming of course that it’s among the 92% of companies that use the cloud. It needs trustworthy networks to connect its apps to its employees and customers. It probably pays for a suite of cybersecurity software in a bid to stay ahead of the ever-growing list of cybersecurity threats. All of these costs, which are unavoidable for any company that wants to host modern software, add up to higher overall IT bills.

    But there’s a source of excess spending that has grown tremendously in recent years: Observability. If a company deploys software, they also need to monitor and observe that software to ensure that it meets performance and availability requirements. In recent years, the cost of observability has skyrocketed.

    In fact, according to Charity Majors of Honeycomb, the total cost of observability at an organization today is equivalent to up to 30% of total infrastructure spending. That’s a truly astounding figure, if you think about it. For every dollar spent on the infrastructure that powers applications, 30 cents ends up paying just for the tools and services needed to make sure the apps running on that infrastructure are doing what they’re supposed to.

    On top of this, spending on observability tools has become very unpredictable, meaning companies have no idea what they are going to be paying next week, next month or next year to get the insights they need to manage their applications and infrastructure. In this sense, observability is worse than taxes. With taxes, at least you know ahead of time what you’re going to have to pay in most cases.

    Getting Observability Spending Under Control

    Observability costs won’t go down on their own,  but there are practical steps that organizations can take to get observability spending under control–and they can do it without sacrificing the critical visibility they need to manage complex systems.

    To prove the point, we’ll discuss the reasons why observability has become so expensive. It’s partly about technology, but it also has to do with who gets to make decisions about adopting observability tools and how cultural inertia inside organizations impedes the ability of practitioners to migrate to more cost-efficient observability solutions.

    Then, we’ll talk about actionable strategies for getting observability costs under control. By taking advantage of some new tools and strategies, observability spending can be reined in while also–and this is the best part–actually increasing the organization’s ability to observe and manage complex systems.

    Why Observability Costs so Much

    There’s no one simple reason why observability costs for the typical organization today have increased. Instead, several factors have conspired to bloat observability bills.

    Drowning in Data

    One issue is the sheer volume of observability data that organizations have to collect.

    That’s partly because businesses deploy so many individual applications–207 on average, according to Okta–each of which generates observability data, to say nothing of the infrastructure on which the apps are hosted. But it’s even more so because of the fact that cloud-native architectures have vastly increased the number of application components and services that we need to observe.

    Instead of having one monolithic app and one host server to monitor, today, companies might have two dozen microservices, a Kubernetes orchestration plane, a bunch of nodes and perhaps an underlying IaaS platform, all of which they have to observe just to keep a single app running healthily. That adds up to tremendously more observability data than businesses had to manage in the past.

    Viewed from one perspective, having more observability data is a good thing. The more data there is, and the more granularity that can be associated with particular parts of the stack, the more insights DevOps teams can glean, at least in theory. But the problem is that, in many cases, only a small fraction–perhaps as little as 1%–of the data that is collected and ingested into observability tools is actually ever used to detect or troubleshoot performance issues.

    Granted, part of the reason we collect so much data but use so little is that it’s impossible to know ahead of time which observability data we’ll actually need. But that’s not an excuse for paying for data that never serves a useful purpose. If we’re going to spend so much on observability data, we might as well use more of it while also finding ways to pay less for it.

    Inefficient Data Collection

    The problem of ever-growing data volumes is compounded by the challenge of inefficient data collectors, which translate to higher infrastructure costs.

    Here’s why: The traditional way to deploy observability tools is to rely on agent-based data collectors that run essentially as standalone applications alongside the applications they are monitoring. As a result, the observability agents suck up a non-insignificant amount of CPU and memory, which require more infrastructure resources to support them and, thus, higher costs.

    Hence, one of the grand ironies of our times: To figure out whether their applications are consuming resources efficiently, businesses deploy observability software that actually decreases resource efficiency, while also bloating costs.

    Complex Pricing Models

    The pricing models of the typical observability tool are, in a word, complex. Most vendors charge in part based on how much observability data is ingested into their tools (this is usually the biggest contributor to overall cost), but they might also charge based on how many agents are deployed, how many users the tool has within the organization, and which features are wanted to access. The costs might also vary depending on where the data is chosen to be stored, how long of a retention period, how often it needs to be accessed  and so on.

    Complex pricing makes it hard in many cases for organizations to cost-optimize their observability spending. Determining exactly which features and usage tiers are needed can be a tough job, and companies might easily end up overspending as a result (after all, who wants to risk underspending and ending up with observability gaps that lead to critical failures?). Plus, unlike, public cloud services, there are no cost-optimization tools designed to help businesses “rightsize” their observability tool deployments or architectures.

    Organizational Inertia

    Historically, most observability and APM solutions were designed first and foremost for developers. To use them, developers had to instrument observability into applications. Then, it fell on the operations or DevOps team to connect the apps to APM tools and figure out what to do with the observability data they generated.

    There’s nothing wrong with involving developers in the observability process. However, the pitfall of the developer-centric approach to APM and observability that organizations have tended to follow is that developers typically don’t actually know very much about what the operations team needs to observe. After all, developers build apps; they don’t monitor or troubleshoot them. The result of this is that developers design apps to generate all sorts of observability data that may or may not be useful (which is why, again, organizations end up paying for a whole bunch of data they don’t actually use).

    This might not be much of an issue if it were easy for the operations team to come in and say, “Hey, we’re collecting all this data and it’s dumb. Let’s be more strategic.” But sadly, it’s not. Organizations being organizations, effecting change is not easy, especially if the change means getting people to adopt new tools or practices. So, businesses end up stuck with observability solutions that may have worked well in the past, but that are not efficient by modern standards, due simply to organizational inertia.

    Cost Unpredictability

    As mentioned, the problem with observability costs today is not only that they’re too damn high. It’s also that they’re too damn unpredictable.

    Observability vendors don’t hide their costs, so those are easy enough to predict. But those costs, again, are based largely on how much data is ingested into the observability tool. And how many engineers do you know who can predict with any kind of accuracy how many logs and metrics their applications will generate from one day to the next?

    Most can’t because data volume is tied to application demand, and that’s inherently unpredictable. After all, if we knew exactly how many requests our applications were going to receive from one moment to the next, we probably wouldn’t really need observability at all. But we don’t, and part of the core purpose of observability tools is to ensure that we can detect the issues that arise due to unexpected software usage patterns.

    I am not exactly criticizing observability vendors here, but rather pointing out that their pricing models capitalize on a fundamental limitation of modern applications: The amount of observability data they’ll produce is unpredictable in most cases, which can lead to wild fluctuations in observability spending.

    Keeping Observability Costs in Check

    Just as there’s no one single cause of high or unpredictable observability costs, there’s no one trick that can rein the spending in. But there are several strategies that, used in unison, will bring observability costs under control:

    Analyze Data at the Source

    The more data is moved in order to observe it, the more it will end up costing. By the same token, the more data analyzed at its source, the lower the cost will be.

    This is why, for instance, Kubernetes observability will cost much less if the data is collected and analyzed right inside nodes, instead of shipping it out to an observability platform first. Not only will the results be faster (because there is no need to wait for the data to move) but data that isn’t critical will be able to be ignored , which reduces how much data is ingested into the observability tools and cuts down on overall costs.

    Keep Data at the Source

    In a similar vein, not all data needs to leave its source at all. There might be datathat needs to be kept handy in case it is needed later, but  can not be analyzed right now. Instead of moving it into external storage, which will cost more, it should be kept right where it originated – inside the nodes. It’s there if needed, but there is no need to  payi extra for it.

    Add Efficiency With eBPF

    I mentioned before the grand irony in which organizations end up wasting infrastructure resources to deploy observability tools: There’s a pretty simple solution for that. It’s called eBPF, and it’s an ultra-efficient way to collect observability data. Unlike conventional observability and APM software, eBPF data collectors run directly inside the operating system kernel instead of running as user space applications. That leads to much lower levels of CPU and memory consumption. With eBPF, there is  all the observability needed, without sacrificing resources in the process.

    Affordable Observability

    The cost of deploying software these days is going up overall, but observability costs can actually go in the opposite direction. Thanks to new observability tools and techniques, it’s possible to collect all of the data neeeded, without allocating a tremendous portion of the overall IT budget to it.

    So, say goodbye to bloated budgets, and say hello to affordable observability.

  • The Fallacy of Continuous Integration, Delivery and Testing

    The Fallacy of Continuous Integration, Delivery and Testing

    We know that continuous integration and continuous delivery (CI/CD) have become a DevOps best practice. And many have learned that by adding continuous testing (CT), they can create a virtuous loop, ensuring perpetual code quality and security. They’re not wrong.  Yes, testing continuously is good practice, but some incorrectly equate the concept of continuous with monitoring, thinking they’re able to see everything that could eventually affect a customer’s experience (CX) with their software application. That’s a fallacy. Many of the most glaring blind spots that wreak havoc on CX exist outside the environment that CI/CD/CT is able to “see.” CI/CD/CT, even when supported by application performance monitoring (APM), doesn’t and cannot monitor for and alert to blind spots across the internet stack. And there are many. Only internet performance monitoring (IPM) can take CI/CD/CT as input streams and shift to continuous resilience as a measurable outcome.

    How CI/CD/CT Typically Works

    As customer requirements evolve, software development teams write code that triggers a new software build. In the continuous model, each new build moves to a runtime environment for integration and quality assurance and, ultimately, is deployed to end users across public or hybrid clouds. This is an application-specific view of the world.

    Since quality assurance is part of the typical continuous process, monitoring is an assumed benefit or outcome. This assumption might be because many now complement their CI/CD/CT processes with APM. What is achieved with APM in this approach is testing, not monitoring. While testing provides a better picture of performance at the application level, it doesn’t provide full visibility into the blind spots that exist between the application layer and the end user.

    APM Isn’t Enough

    While APM tools focus on code—including everything that negatively affects an application such as database wait times and inefficient code—IPM focuses on the internet, which has become your network. IPM monitors what impacts your customers, workforce or application (API) experiences across the internet.

    While APM and IPM may seem similar, they are nothing alike. They may share common tools, such as using synthetic agents, but the difference is in what they monitor and how. In this age of highly distributed applications, that difference means everything.

    Where APM can “simulate” what a user may see from cloud location to cloud location, which can confirm application performance, this simulation isn’t true or comprehensive monitoring because it is blind to network-related problems with end-user experience, which are vast. Customers and employees each have a unique internet performance fingerprint and access applications from myriad devices across multiple locations and network infrastructures, not through the individual cloud locations that APM synthetics simulate.

    IPM approaches synthetic testing more holistically, replicating multiple user journeys across a much more complex Internet infrastructure to proactively flag performance issues before they impact end users. This true monitoring takes place 24/7, not as point-in-time tests.

    Forensics vs. Monitoring

    With APM and similar observability solutions that embrace real user monitoring (RUM), it’s important to focus on what monitoring really means. APM passively collects data that is a proxy for user experience, enabling postmortem assessment of causes and possible fixes, but after the fact. Observability looks at logs, metrics and traces and provides an assessment of whether users are having a good experience or why they did not. Neither solution by itself will prevent poor experience, and many fixes won’t take place until a postmortem analysis feeds the next iteration. The poor experience has already done its damage, and the costs are already sunk.

    With thousands of potential blind spots across the globe that can slow or disrupt applications, from ISPs and wireless carriers to CDNs, it’s not hard to grasp the increasing and differentiated importance of IPM. Where the combination of CI/CD/CT with APM can proactively prevent deployment of poor code that would affect user experience, only IPM is continuously replicating – even more valuable than monitoring–millions of experiences across a dynamic multi-node network where the unexpected is now expected.

    Internet Resilience Vs. Retrospection

    Businesses today understand the importance of resilience: It’s a board-level concept. Any business that has lost market share and market cap during sustained downtime or poor user experience understands what’s at stake: Millions if not billions of dollars. IPM is squarely focused on “internet resilience,” and its pillars are availability, reachability, performance and reliability. For businesses reliant on the cloud and employers operating with highly distributed workforces, retrospection alone is a risky proposition. Now that the internet is the new corporate network, internet resilience is a new organizational mantra.

    The Takeaway

    Whether your organization embraces CI/CD/CT already or is rethinking its approach to DevOps, this article should give you pause. Your job–perhaps as part of a larger team–is to catch performance issues and potential disruptions with your application before client impact is realized. Without IPM, only part of that job is being done.

    Why is this so important? Even conservative estimates put the cost of an outage at $6,700 per minute (Gartner) and the “cost of slow,” where something causes an application to perform poorly and it goes unnoticed, is likely significantly higher because it happens all the time. The fallacy isn’t that there’s value in CI/CD/CT–there is. The fallacy is that you’re in control of the entire CX of your internet-deployed products without monitoring the internet stack and ensuring internet resilience. Only by adding IPM can you have this assurance.

  • 5 Key Performance Metrics to Track in 2023

    5 Key Performance Metrics to Track in 2023

    It’s never a bad time to adopt healthy new habits for the mind and body, and for developers, it’s always a good time to consider new best practices at work. As 2023 rolls on, I’ve been thinking about some key performance metrics that help to ensure critical applications and websites perform optimally throughout the year—especially during unpredictable spikes.

    To see why this is important, just look at the problems Ticketmaster had in November 2022 when Taylor Swift’s concert tickets went on sale. Fans of the pop idol (including me!) swamped the Ticketmaster site and brought the system to its knees, resulting in frustrated customers and a wave of bad publicity for the company.

    These usage spikes and the problems they can produce are not uncommon. The holiday sales period, starting with Black Friday and Cyber Monday, is notorious for technical issues that can cost retailers millions due to lost sales and other problems. And it’s not just retail. A few years ago, the Internal Revenue Service (IRS) had to extend its tax deadline after a rush of last-minute filers knocked its systems offline.

    Fortunately, developers can mitigate these problems with the right planning and practices in place. There are key performance metrics that developer teams should monitor, especially in times of peak traffic, to avoid application crashes, long wait times—and burnout for the teams who have to fix these problems when they arise.

    Here are the five performance metrics developers should be tracking in 2023—especially on their busiest days of the year.

    Web Vitals

    The largest contentful paint, or LCP, measures the load speed of a webpage. Having a fast LCP is a clear sign that a customer’s experience is optimal as they toggle between pages. In tandem, the cumulative layout shift, or CLS, scores how a user is experiencing unexpected layout shifts. This plays out on busy shopping days: Typically, these pages have ad and sales notifications that affect a brand’s main page layout, potentially causing shoppers to experience unexpected shifts. This can reduce their ability to shop and becomes a hindrance if a developer cannot quickly access and address the issue.

    Error Count Vs. Error Rate

    Error counts typically increase alongside site traffic as more people flock to a website—that’s a natural occurrence. The error rate is more telling because it reveals if a greater proportion of users are experiencing issues with your application or website. Developers who see an increase in this metric should investigate and take action.

    Mobile Monitoring

    More and more consumers are using their mobile devices to shop and manage all aspects of their lives. For example, mobile accounted for 45% of sales during the holiday shopping period in 2022 from October to December. Mobile performance metrics are critical to understanding what is happening on your users’ devices during these busy times. Vitals like frozen and slow frames or cold and warm starts when an app opens provide visibility into how fast views are loading for your users. As became obvious with the Taylor Swift incident, a slow shopping experience can lead to an outcry and a lot of upset customers.

    Outside of vitals related to mobile performance, it’s important to monitor mobile changes through application release health. Developers can see this in the rate of crash-free sessions and crash-free users as traffic to an application increases—which helps to identify abnormalities in the overall health of the app.

    Slow Database and HTTP Ops

    During sustained traffic spikes, database queries and HTTP requests that take too long to execute harm the user experience. Hitting a slow checkout process, or seeing the dreaded spinning beach ball after adding a product to the cart, confuses shoppers. They don’t know if they should refresh the page, and often they will abandon a purchase completely.

    What’s more, if a developer is working on a backend framework, slow database and HTTP ops could also be a sign of an N+1 query problem. At that point, an application is making database queries in a loop and causing performance issues for the purchaser.

    User Misery

    This is a homegrown metric we use at Sentry; tracking user misery helps developers understand a customer’s experience with an application. It is a ratio of unique users who have experienced load times at 4x a configured threshold in a Sentry project and thus serves as a proxy for customer frustration. With this user misery score, our developers can see which transactions have the highest negative impact on users and prioritize fixing them.

    Providing a smooth end-user experience is table stakes for businesses throughout the year, but especially during high-pressure, culturally-driven spending moments. In any of these scenarios, developers behind the scenes often work long and odd hours to address performance issues and ensure the most seamless experience. You can’t prepare for everything that can possibly go wrong, but you can be equipped with the right tools and metrics to quickly identify and remediate any problems that occur.

  • Checkly Adds Monitoring-as-Code to Testing Platform

    Checkly Adds Monitoring-as-Code to Testing Platform

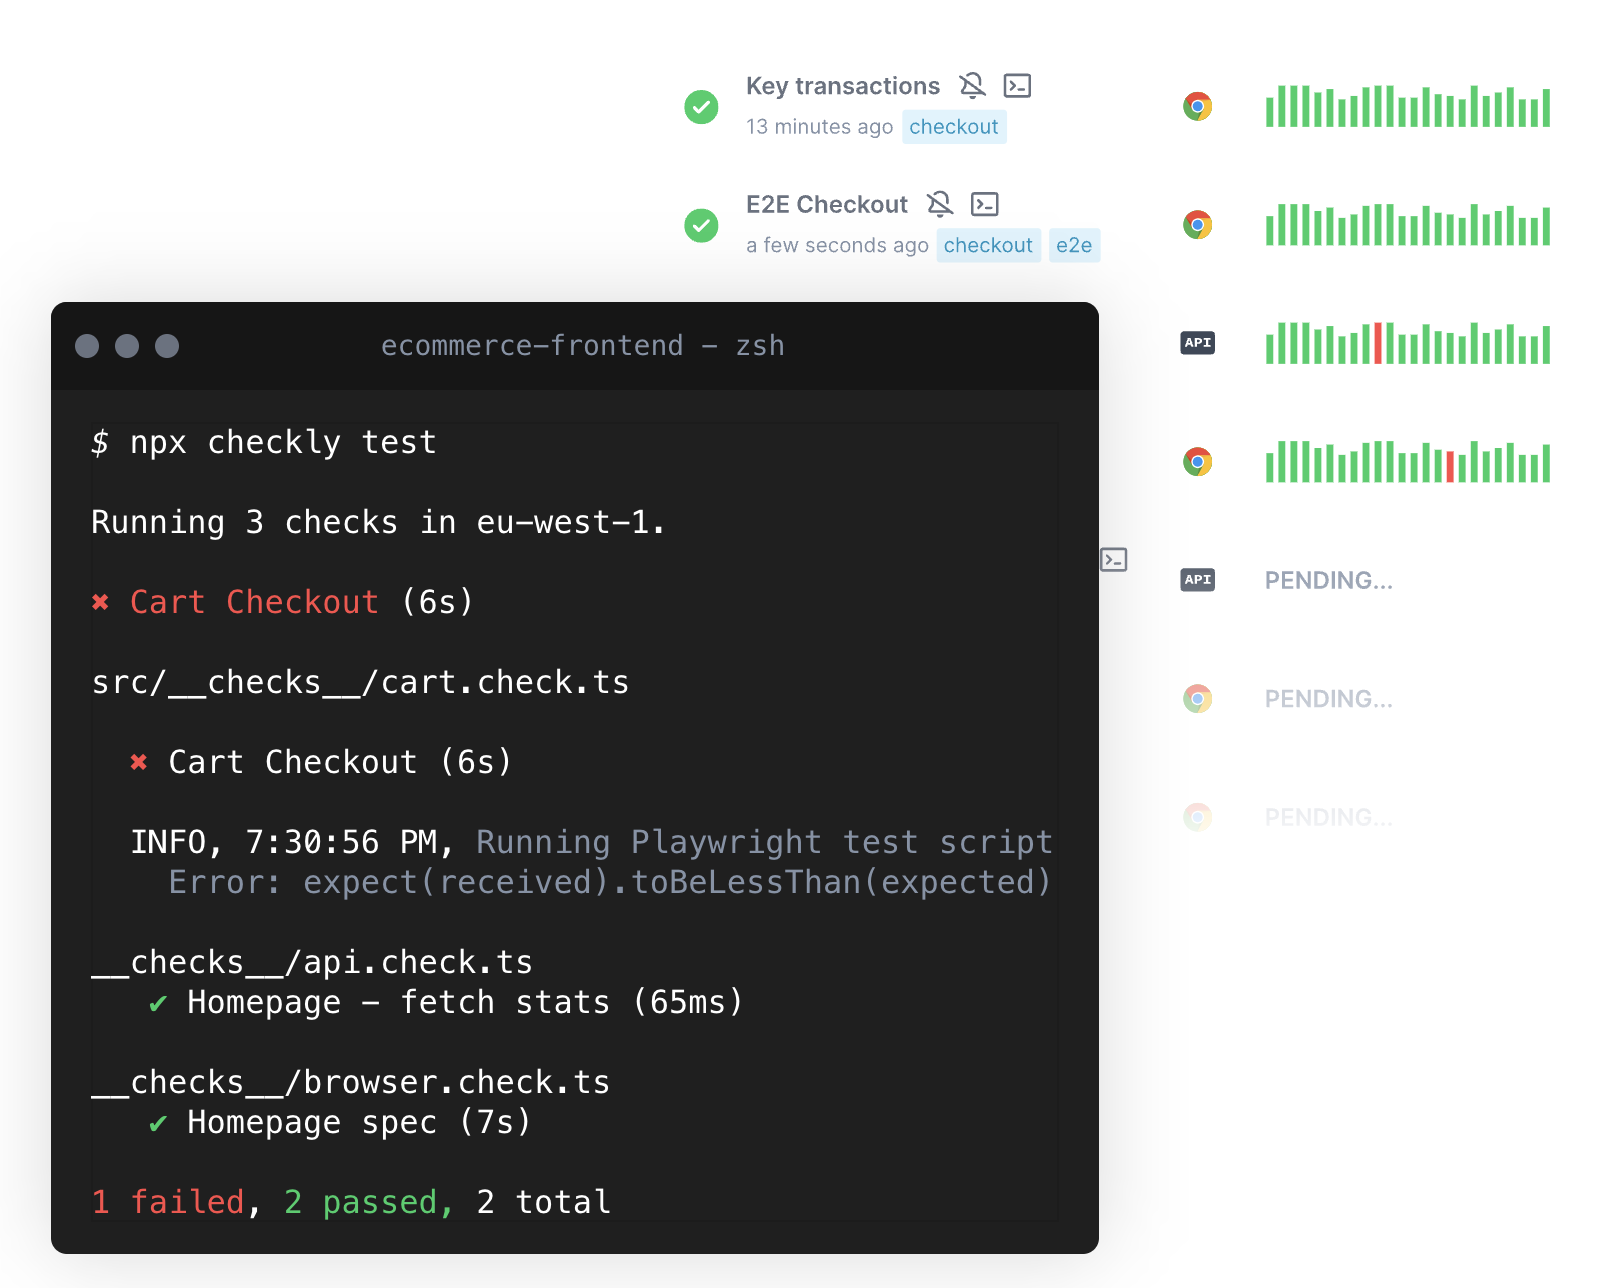
    Checkly this week added a monitoring-as-code (MaC) workflow capability to its software-as-a-service (SaaS) platform that is used to create synthetic tests for applications.

    The Checkly platform spins up browsers to test and can now monitor how applications are performing at both the user interface and application programming interface (API) level. That capability, currently available in beta, is enabled via a command line interface (CLI) for accessing an instance of TypeScript to invoke MaC workflows.

    Checkly CEO Hannes Lenke said that integrated approach enables application development teams to observe applications in as little as 60 seconds without instrumenting them with agent software.

    As part of that effort, Checkly also made generally available Playwright Test, a testing platform for web applications that spins up modern browsers on demand in addition to updating its public dashboards and adding an analytics API.

    Finally, the Checkly SaaS platform has passed a SOC 2 Type II security audit.

    Lenke said the overall goal is to make it simpler for developers to discover and remediate issues as they assume more responsibility for the ongoing management of applications.

    It’s not clear whether developers are taking over responsibility for testing and monitoring applications, but as more responsibility for applications shifts left, organizations are looking to give developers the tools they will require to succeed. That doesn’t mean IT operations teams won’t need to continue to monitor IT environments, but developers do need integrated tools that give them enough meaningful context to address them as they write code. Synthetic testing tools also enable developers to address many routine issues long before they might be discovered by a dedicated testing team that should be focused on ensuring the overall quality of the user experience.

    Regardless of the approach to testing and monitoring, Lenke noted that the silos that make up the software development life cycle are becoming more tightly integrated in modern application development environments. The primary objective is to make it possible for organizations to accelerate application development without compromising quality, he added.

    Of course, the more testing that occurs early in the application development process, the fewer issues a DevOps team should encounter after an application has been deployed in a production environment. The issue is that, historically, much of that testing occurs late in the application development process. Each time a project falls behind schedule, there is naturally a greater temptation to reduce the amount of time spent on testing to ensure the on-time delivery of an application. Providing developers with tools for testing and monitoring applications as they are being built should ensure that the proper level of testing is occurring before an application is deployed.

    There will, however, never be a perfect application. Over time, DevOps teams will discover that every application is impacted by drift to varying degrees as updates are made and the underlying infrastructure is upgraded. The most critical issue is reducing the number of potential issues overworked DevOps teams may need to address later on by ensuring the code being deployed is of the highest quality possible.

  • Vercel Adds Observability Tools to Web Application Framework

    Vercel Adds Observability Tools to Web Application Framework

    Vercel today announced it has added a suite of observability tools to its platform for building web applications using Next.js, an instance of the open source React framework based on a JavaScript library.

    Vercel CTO Malte Ubl said the Vercel Monitoring tools make it simpler for developers to troubleshoot applications without relying on a DevOps team to surface data. Instead, developers can take advantage of Vercel Monitoring tools to access metrics that track user interface and application programming interface (API) issues, he added.

    That capability is not intended to replace the need for observability tools employed by DevOps teams. Instead, the goal is to provide metrics that are specific to issues that developers encounter as an application is being built or after it has been deployed so they can be addressed.

    Developers can select from pre-made queries provided by Vercel or create their own by defining what metrics they want the Vercel Monitoring tools to track, including bandwidth and web traffic spikes and requests by bots that are indicative of a cyberattack. In total, there are more than 500 potential errors that developers can track. Logs then make it possible to drill down into errors and issues once they are identified to pinpoint the root cause of an issue.

    As more responsibility for applications shifts left toward developers, there’s a clear need for tools that provide more visibility into the applications they develop. Many of the issues that DevOps teams encounter today could have been resolved if developers had been aware of them earlier.

    The Vercel platform employs caching, routing and a React framework to optimize application performance in a way that reduces the dependency on backend infrastructure to optimize application performance. That approach puts less strain on backend infrastructure as more requests are automatically processed using a framework that spans clients and servers. In effect, developers can take advantage of frameworks such as React to treat the underlying IT infrastructure as if it were serverless whenever possible with tools that have a familiar JavaScript construct. The overall goal is to increase developer productivity at a time when many organizations are much more focused on the issue.

    As a result, DevOps teams will need to make some adjustments as more applications capable of providing richer experiences are built and deployed without relying as much on backend infrastructure. That shift has implications for everything from the amount of network bandwidth consumed to the performance of web applications. Frameworks such as Next.js also tend to increase the overall rate at which web applications can be built and deployed.

    One way or another, it’s clear that the way web applications are being built is fundamentally changing. The only issue now is determining to whether DevOps teams are prepared to absorb that level of change across an ever-increasing portfolio of applications that still need to be deployed, secured, updated and optimized.

  • Opvizor Extends Monitoring Reach to the Cloud

    Opvizor Extends Monitoring Reach to the Cloud

    Opvizor, a unit of Codenotary, has extended its monitoring capabilities to cloud computing environments starting with support for Amazon Web Services (AWS) and Microsoft Azure.

    Codenotary CTO Dennis Zimmer said Opvizor aggregates data to provide a more efficient approach to applying analytics to surface performance and risk issues.

    Previously, Opvizor was optimized for instances of VMware vSphere running in an on-premises IT environment. Now the unit of Codenotary, a provider of a service for generating software bills of materials (SBOMs), is extending those monitoring capabilities to the cloud.

    That transition comes as many organizations are looking to strike a balance between monitoring pre-defined metrics and observability platforms that make it possible to surface unknown potential issues that could adversely affect IT environments.
    It’s still early days as far as observability is concerned, so Opvizor is focused on meeting most IT teams where they are today as they further embrace cloud computing, said Zimmer.

    Observability, in general, promises to query not just logs and metrics but also distributed traces that are applied to specific processes. In that way, observability allows organizations to detect patterns that have not been predefined. In effect, an observability platform makes it simpler to debug application environments where the number of dependencies that exist between services are becoming too complex to track manually, much less decipher. Without the aid of an observability platform it can take weeks to discover the exact cause of an application’s performance degradation.

    Of course, those applications will need to be instrumented using agent software capable of generating the data observability platforms require. Fortunately, open source projects such as OpenTelemetry are helping to drive down the total cost of instrumentation.

    However, in the absence of observability, most IT teams will rely on existing monitoring tools. Opvizor is making a case for centralizing monitoring across multiple platforms to reduce costs, noted Zimmer.

    Heading into 2023, each IT team will need to decide how and when to rely on traditional monitoring tools versus observability platforms. Many observability platform providers are justifying the acquisition of a new platform based on cost and the ability to eliminate the need for multiple monitoring tools. However, it remains to be seen whether IT organizations will prefer to employ both monitoring tools to track predefined metrics alongside observability platforms.

    Regardless of approach, the reality is that IT environments are becoming more complex to manage. In addition to running workloads in multiple cloud platforms and on-premises IT environments, organizations are deploying emerging cloud-native applications based on containers alongside existing monolithic applications deployed on legacy virtual machines. As workloads are deployed on multiple platforms, the total cost of IT starts to rise. One way to contain those costs is to standardize on a set of tools that can be applied to multiple platforms.

    The pressure to rationalize toolsets only increases during any period of economic uncertainty. The challenge, of course, is convincing one team to give up their preferred tool in favor of another to reduce costs.