
As we close out 2018, we at devopsy.kinsta.cloud wanted to highlight the five most popular articles of the year. Following is the fifth in our weeklong series of the Best of 2018.
As organizations face outages and various security threats, monitoring an entire application platform is essential to understand the source of threat or where the outage occurred, as well as to verify events, logs and traces to understand system behavior at that point in time and take predictive and corrective actions. Monitoring the logs and logs analysis are important for any IT operations teams to identify intrusion attempts and misconfigurations, track application performance, improve customer satisfaction, strengthen security against cyberattacks, perform root cause analysis and analyze system behavior, performance, measures and metrics based on the logs analysis.
According to a Gartner report, the market for monitoring tools and APM tools is expected to grow to $4.98 billion by 2019, and log monitoring and analytics will become a de facto part of AI Ops. Log analysis tools are emerging as a low-cost solution for monitoring both application and infrastructure (hardware and network).
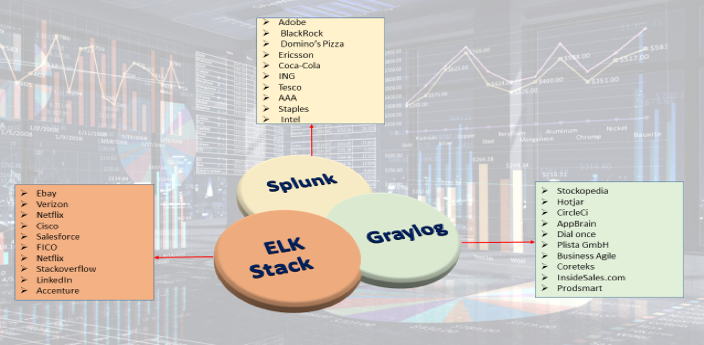
There are mix of commercial and open source tools available as the log monitoring analysis tools market has matured. Some of the key features of log monitoring tools include powerful search capabilities, real-time visibility with dashboards, historical analytics, reports, alerts notifications, thresholds and trigger alerts, measurements and metrics with graphs, application performance monitoring and profiling and tracing events. This article focuses mainly on the differences in log monitoring tools ELK, Splunk and Graylog.
ELK, Splunk and Graylog
Elastic has put together arguably the most popular log management platform for both open source and commercial (cloud and enterprise) log monitoring tools. The Elastic Stack—more commonly known as ELK Stack—combines Elasticsearch, Logstash and Kibana. Elasticsearch is a modern search and analytics engine based on Apache Lucene, while Logstash provides data processing and enrichment. Kibana offers logs discovery and visualization.
Splunk is a platform for searching, analyzing and visualizing the machine-generated data gathered from the websites, applications, sensors, devices etc. covering the entire infrastructure landscape. It communicates with different log files and stores files data in the form of events into local indexes. It provides the easiest way of search capabilities and has wide array of options to collect logs from multiple sources. Splunk is available in both SaaS and enterprise editions.
Graylog offers open source log monitoring tools providing capabilities similar to ELK and Splunk. Graylog performs centralized log monitoring; where Graylog is used for data processing and Elasticsearch, MongoDB used for search and storage. It provides log archival and drill-down of metrics and measurements.
The below table provides the comparison analysis based on the open source/free trial editions of ELK, Splunk and Graylog.
Features Comparison
| Features | Elastic Stack | Splunk | Graylog |
| General | |||
| License/Edition Available | Open source, Commercial
Cloud: based on the cluster (memory, storage, data center region) Enterprise: pricing based on / instance Free Trail: Available for 14 days |
Commercial
Free: 500MB indexing / day Splunk Cloud: Pricing based on ingested data to cloud / day & Free Trial of 15 days with 5GB data available for search & analysis Splunk Enterprise: Pricing based on ingested data
|
Open Source: Based on daily volume, price per month
Enterprise: Free for Under 5 GB/day |
| Implementation Language & Logging Format | Java
JSON |
C++, Python
JSON,.CSV, Text file |
Java
GLEF-Graylog Extended Log Format |
| Community Support
Enterprise Support |
Available: Well Documented
Available 24* 7 Support
|
Available: Well Documented
Available: Direct access to the Customer Support Team |
Available: Well Documented
Available : Unlimited Support from the Graylog Engineers |
| Supported Server Platforms | All OS-x, Window, Red hat | Linux,OS Solaris and Windows | Linux ,Ubuntu, Centos, Windows |
| Ease of Configuration | Need to set up Elasticsearch, Logstash, Kibana, beats with cluster configuration and medium complex to setup. | Single platform with server and forwarder from clients, with less complexity to set up. | Need to set up Graylog – Graylog web server, Elasticsearch, MongoDB and medium complex to set up.
|
| Basic Components Involved | Elasticsearch – Search and storage
Logstash – data processing Kibana – visualization Beats – logs collector and shipper |
Splunk Server
Splunk Forwarder |
Graylog – Data processing and web interface
Elasticsearch – log storage MongoDB – Configuration data storage |
| Data | |||
| Data Collection | Beats, Logstash, Elasticsearch Ingest nodes
|
Using app-add-ons and Splunk forwarders
|
GELF TCP/UDP
Message Inputs & Content Packs (inputs, extractors, outputs streams, dashboard configuration) Graylog Side car
|
| Data Formats | Common Log files format
Ex: nginx, tomcat logs common formats. |
Accepts any data type including .csv, JSON, log files , xml, etc. | Common log files formats. Ex: nginx [ error_logs, access_logs]
Syslogs, rsyslogs, GLEF format |
| Additional Data Inputs | HTTP,TCP, Scripted inputs, Syslog input | HTTP, TCP, Syslog input, various Log stash plugin
|
GLEF Kafka, GLEF HTTP, Beats, Message Inputs, rsyslog and syslog-ng |
| Data Base & Database Schema Creation With Fields | Elastic search – document oriented DB
Schema defined in the specific beats plugins / log forwarders. |
Splunk uses built-in data structure, and stores the indexes to disk.
|
Elasticsearch – to store the logs
MongoDB – storing metadata and dead letter queue messages Schema defined in the specific content packs |
| Data Correlation
& Aggregation |
Done through Aggregate filter and logstash correlation event filters | Done through index event correlate commands
Decorators. |
Done through aggregate filters, decorators. |
| Centralized Logging Support | Available with log shippers | Available with Splunk Enterprise Forwarder, Universal Forwarder | Available with Logs collector Graylog sidecar, RSyslog. |
| Data Import / Export | Import / Export data from various sources like Influx DB | Export / Import can be done through Splunk DB Connect to relational databases | GELF output plugin
REST API |
| Data Transport | Kafka, RabbitMQ, Redis | Persistent Queue
Processing Pipeline Components |
Apache Kafka, RabbitMQ (AMPQ) |
| Data Collection Intervals | Real time Stream and in Batches | Real time Stream and in Batches | Real time Stream and in Batches |
| Search | |||
| Search Capabilities | Provides a highly scalable full-text search and analysis engine with Elastic search | Offer dynamic data exploration to extract everything as it having its ow search language. | Full-text based search on Real-time UDP/GELF logging with Intuitive Search interface |
| Search Language | Query DSL (Lucene) | SPL (Splunk Processing Language) | Very close to the Lucene Syntax |
| Protocol Used For Read / Write operations | REST API, HTTP API | REST API, HTTP API | HTTP API, REST API |
| Log Filter
Search filtering |
Grok Filter Plugin
Search filter with fields levels, saved searches, graphs, etc. |
Filter logs applying transforms to events | Uses Drools rules, extractors, fields filter
Blacklisting,
|
| Visualization | |||
| Reporting
Historical Data Management
|
Available in X-Pack component
Quickly generate reports of any kibana visualization or dashboard and any raw data.
Each report is print-optimized, customizable and PDF-formatted
|
Built-in feature
Reports are created for saved search, visualization or dashboard, set up schedule report, configure the priority of schedule report with support on Historical and streaming data
|
No built-in reporting capability
REST API can be used to generate own reports on the history data and streaming data.
|
| Alerting | Supported through X-pack / watcher configurations can be created
Integrations available to send alerts to AIOps tools |
Built-in feature, support real time or scheduled alerting
Integrations available to send alerts to AIOps tools |
Built-in feature
Alerts raised based on stream Integrations available to send alerts to AIOps tools |
| Monitoring | |||
| Server, Device Logs Monitoring | Uses Metricbeat, Filebeats for capturing server-related logs | Using Splunk Insight For Infrastructure | Uses Graylog Beat , NXlog |
| Network Logs Monitoring | Captures network logs through Packetbeat | Uses Splunk MINT to capture network logs | Uses SNMP & netflow Plugin |
| Cloud Logs Monitoring | Using Logstash, Filebeat, modules | Configurable via add-ons in Splunk, for different clouds
|
Plugins available to pull logs from cloud. |
| Containers Log Monitoring | Using Logstash, File Beat & Metric Beat, Logstash processors for Docker logs | Splunk logging driver for Docker | Uses Filebeat & Native Graylog (GELF logging driver) Integration |
| Kubernetes Orchestration Monitoring | Using Fluentd, metric beat to ingest logs from Kubernetes | Using collector built for Kubernetes | Using Filebeat collector sidecar |
| DB Log Monitoring | Enabled through Filebeat modules, Logstash | Enabled through Splunk add-ons for different databases and Splunk DB connect | Enabled through Add-on plugins and GLEF libraries for different databases including mysql, mongodb, etc. |
| End User Transactions Monitoring, Application Performance Monitoring | Enabled through APM and different beats, Logstash correlation, X-Pack components. | Enabled through Splunk App for Synthetic monitoring, Splunk ITSI Modules, Splunk MINT SDK. | Application logs and add-ons from marketplace. |
| Analytics
(Causal Analysis, Anomaly detection, etc) |
Supports Machine Learning via X-Pack. | Splunk IT Service Intelligence Modules provides machine learning algorithms for anomalies, etc. | No out-of-box machine learning support |
| Others | |||
| Customization / Extensibility | Can create customized dashboards with Kibana controls and search queries.
Custom Metricsets and Plugins
Custom rules can be created to define thresholds and alerts
Can extend / integrate with other tools via webhooks / plugins and programmatic access via REST HTTP/JSON API
Hosted Elastic Stack provides out-of-box user management features, via X-Pack.
|
Flexible to add/ edit new components and views to Splunk dashboards using SplunkJs stack and Javascripts.
Can create custom metrics indexes and collect data using statsD, collectD.
Can extend / integrate with other tools via webhooks / plugins and programmatic access via REST HTTP/JSON API with 1000+ add-ons.
Out-of-box user management. Slunk Enterprise Security
|
Flexible to add Custom dashboards based on stream using widgets, graphs, CLI stream dashboards.
Can create custom index models, custom extractors with metrics needed using REST API, content packs.
Provides few out-of-box alerting with default conditions with custom alerts defined on the streams and conditions.
Plugins are available in Graylog, to integrate with other tools
Provides user-management, LDAP and other authentication mechanisms (single-sign on/two-factor) integrations.
|
| Scalability | Supports scalability(horizontal) and high availability with master / slaves cluster. | Scalable with distributed deployment of Splunk Enterprise components for data input, indexing and search. | Scalable with multiple nodes on ES, MongoDB, Graylog server, along with any queues (Kafka / RabbitMQ). |
| Backup / Restore | Can take snapshots backup of indexes to any external repository such as S3, Azure, etc.
Retention on ES through Elasticsearch curator. |
Supports backup of configuration, indexes, warm db buckets based on policies. | Archival Plugin available in Graylog Enterprise, to back up indexes and restore to new cluster, via web UI, Rest API
|
Log monitoring is very essential as part of full stack monitoring, which can provide better insights for faster troubleshooting. The choice of log monitoring tools will depend on your requirements, infrastructure, price and monitoring and maintenance needs. Elasticstack, Splunk and Graylog have enterprise-ready platforms and solutions for log monitoring, and all are widely used across multiple enterprises and domains.