Author: Gayle Levin

  • The Changing Role of APM in a Microservices World

    The Changing Role of APM in a Microservices World

    Microservices usage has skyrocketed. Fully 91 percent of organizations are using or have plans to use microservices and 92 percent expect to grow their use of microservices in the coming year. It is no longer if but when: 86 percent of organizations expect microservices to be the default within five years.

    With the growing use of microservices and containers, applications have become orders of magnitude more dynamic. It’s not unusual for containers or building blocks of the application to have a shelf-life of less than a week. However, what is great for application development can create challenges when it comes to monitoring ­and diagnosing performance issues in ever-changing applications. How does application performance monitoring (APM)  change to support microservices and dynamic cloud-native apps?

    More Moving Parts

    Small, specialized microservices may facilitate shorter development cycles, continuous releases and greater agility, but when deployed across dynamic cloud infrastructure, the sheer number of moving parts also makes it much more difficult to troubleshoot application performance. Highly distributed and transient containerized components need to be tracked and measured continuously, demanding a big data approach for APM tools. To be effective, monitoring containers and microservices requires high-definition visibility across all transactions, machine learning to pinpoint problems and a shift in focus to users from servers.

    High-Definition Data

    Because the dynamic, containerized environment is constantly changing, measurement data must be collected at high frequencies—think seconds rather than minutes. Collecting infrastructure performance metrics at one-minute intervals, or longer, can distort the real situation and sometimes miss entire events altogether. For example, at low definition, a pattern of recurring but brief spikes in CPU usage will either be averaged out or not register at all—but if detected would be a tell-tale sign of a systemic configuration issue. High-definition infrastructure metrics, collected at one-second intervals, are crucial for a comprehensive view of resource utilization and shared resource dependency issues.

    However, infrastructure metrics alone are not enough. Building a complete view of the operating environment calls for data from multiple sources, including application traces, system metrics, application logs and network behavior. The resulting data set is very large, necessitating big data collection methods and processes. In-line data compression, NoSQL back-ends, non-intrusive client agents and cloud scaling are foundational technologies for modern APM tools.

    Correlating Data End to End

    Big data analytics and visualizations are necessary to process APM data into human-scale patterns and events. Identifying root cause of a performance problem often involves following a transaction from end to end, through multiple containers, shared resources and downstream infrastructure dependencies. Next-generation APM tools dynamically map the flow of every single transaction, through all intermediate relationships. Machine learning and artificial intelligence, while still in their early stages, are proving essential to finding patterns and anomalies in the data, suggesting probable causes and flagging them for human investigation. Combining the best of machine and human skills results in faster problem identification, diagnosis and resolution. IT operations teams benefit with improved application performance, reduced repair times and higher uptime even in dynamic application environments.

    Putting the Focus on the End User

    Legacy APM tools tend to focus on infrastructure components and resources, monitoring the health and utilization of servers, storage and networks. Organizations today, driven by digital competition and customer satisfaction, need to concentrate on the user’s perspective. This means monitoring multiple types of user devices for health indicators and mapping each transaction to the backend system. Automatic instrumentation delivers real-time end user metrics that trigger alerts much earlier than server-side monitoring, and enables more effective prioritization. End user insights also help DevOps and product owners track feature and application adoption rates, compare performance before and after upgrades and directly relate technical issues and investments to business priorities.

    Monitoring Apps for Today and Tomorrow

    Clouds, containers and microservices require a different approach to performance monitoring that takes into account the speed, size and life cycle of application modules. Effectively watching these distributed and transitory processes demands a big data approach that can handle the scale of end-to-end transaction data in modern enterprise environments.

    Legacy APM tools that only take snapshots result in an incomplete view of application reality and lengthen problem resolution times. Instead, modern APM systems collect a complete data set, enabling DevOps to quickly resolve intermittent and complex issues that impact business productivity and user satisfaction. They augment their skills with machine learning to quickly identify anomalies and guide them to probable causes. The results are better application performance, enhanced competitiveness and perhaps most important, increased user satisfaction.

    — Gayle Levin

  • How to Use APM to Hold Cloud Providers Accountable

    How to Use APM to Hold Cloud Providers Accountable

    Here’s the challenge: Cloud providers’ service level agreements (SLAs) typically stop at the edge of their cloud, while your internal service level expectations run end to end. Measuring performance from the end user to the application and back, including device details, user productivity and page load times, is essential for customer satisfaction and continuous performance tuning. How long does it take to launch an online app, open a work order or complete a claim form? What are execution and completion rates in different locations? The metrics and associated metadata provided by application performance monitoring (APM) tools can help your DevOps teams rapidly identify actual performance issues, troubleshoot them quickly and efficiently and optimize cloud spend and service level agreements.

    Automate Data Collection

    Collecting performance details for multiple web browsers, operating systems and devices is impossible if you have to manually tag and instrument the code. Modern APM solutions automatically deploy JavaScript snippets, page tags or agents to your web pages, Java and .NET applications and mobile apps. Small binary agents and efficient compression algorithms ensure minimal performance impact to the end user device or the network as they send telemetry information to the APM back end. Your DevOps team can then work with the actual attributes of every device, including manufacturer, model, operating system type and version and resource consumption to monitor the end user experience across IaaS, PaaS, SaaS and hybrid environments.

    Early Warnings with APM

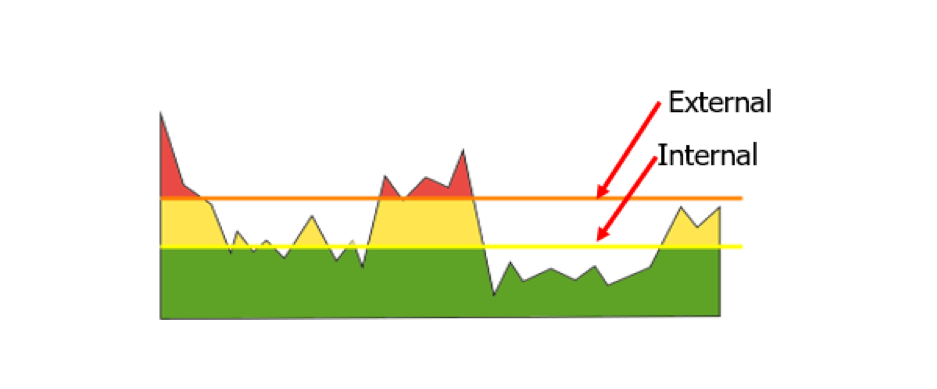
    To trigger early warnings, APM systems automatically determine an application baseline, or you can manually set specific thresholds. Typically, internal thresholds are set up to provide early warnings of possible issues before users are negatively impacted, while external thresholds can be linked to your actual SLA terms.

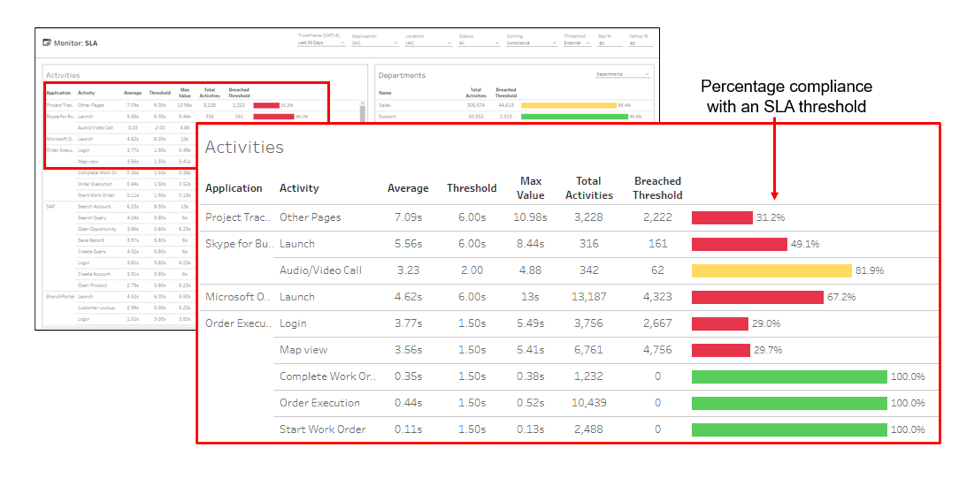
    These SLA reports are more than colorful views. By using dashboards that color-code SLA status based on the end user experience, you can better enforce service levels with your cloud providers. For triage purposes, you can break out details by department, geography, operating system, device type, target server, carrier and other characteristics as needed. You can also see at a glance your compliance measurements, which show the percentage of response times that are meeting the agreed-upon targets with your cloud providers to hold them accountable for performance.

    Streamlining Remediation

    Automation is key to accelerating mean time to repair (MTTR). When an alert is triggered, APM tools integrate with your service desk systems to automatically open trouble tickets, identify probable causes and analyze the business impact for prioritization. This level of detail and integration significantly reduces delays that are historically associated with performance troubleshooting, as it provides the necessary context for troubleshooting. Another option with advanced APM solutions is the ability to automate remediation of common end user experience issues, without involvement of the service desk staff.

    Comparing Before and After

    Another useful outcome of these detailed metrics is the ability to compare parameters before and after a change. By baselining performance, APM tools help you document and validate the actual end user experience impact of code releases, device changes or service provider upgrades. It’s not uncommon for users to complain after a new release, but using APM reports you can take a data-driven approach to quickly investigate user complaints by comparing different time intervals. You can start by exploring various characteristics and isolate the affected group based on device health, network subnet, geography, server or cloud provider. Once you have determined whether the problem is within your control (code, architecture, etc.) or within your service providers’, you then can have more productive discussions with service providers to demonstrate exactly where and when an SLA violation occurred.

    Keeping Track of SaaS Applications

    As you expand use of SaaS applications such as Office 365, end user experience monitoring and SLA management can be used to hold these providers accountable. Slow application launches, logins, page loads and other performance issues can impact user productivity, adoption rates and deployment schedules, costing the organization support resources and unused license fees. That’s why SaaS-based APM tools give you immediate usage measurements, enabling you to quickly adjust license quantities and optimize costs. Real-time monitoring of user wait times, crashes, device health and other experience metrics gives your team comprehensive awareness of how performance, device type or operating system versions are affecting employee productivity. This information can be used to quickly identify problem areas, validate migration plans and prioritize future investments.

    Monitoring for Accountability

    Getting what you pay for from your cloud providers is much easier if you incorporate detailed user experience measurements into your SLAs. A best practice is to monitor everything that happens on every device across the organization such as how long it takes to boot up, login, open specified apps and perform business-critical tasks. If any of these are off target, your APM solution can open and prioritize a trouble ticket with a list of probable causes, before the affected users can call support. Automated end user experience monitoring, reporting, and policy management, backed by self-instrumenting devices and apps, are essential links between a service provider’s commitment and your actual results.

    — Gayle Levin