Category: Application Performance Management/Monitoring

  • Splunk Aims to Trigger DevOps Processes

    Splunk Aims to Trigger DevOps Processes

    Splunk this week at its .conf18 conference continued a campaign to extend the reach of its operational analytics platform into the realm of DevOps through a partnership with Puppet.

    Spunk also announced the 4.0 release of Splunk IT Service Intelligence (ITSI), which extends a platform for managing IT using machine learning algorithms by integrating it with incident management software Splunk gained via its acquisition of VictorOps. Other new capabilities include support for a set of key performance indicators (KPIs) for tracking metrics such as application workloads and the ability to do root cause analysis on any event the machine learning algorithms predict.

    Andi Mann, chief technology advocate for Splunk, said the alliance with Puppet furthers Splunk’s ambitions to be a primary source of data used to inform automation frameworks that are at the heart of any set of DevOps processes. Over time, Splunk will continue to expand its DevOps partnerships with an eye toward being the analytics platform used to trigger automated processes using frameworks developed by Puppet and others, he said.

    At the same time, Splunk continues to develop orchestration capabilities of its own based on technologies it gained via its acquisition of Phantom. While that orchestration software primarily is used today in a security management application, Mann said Splunk is now looking at applying that software more broadly, as it encouraged developers to build applications using a Splunk Developer Cloud now in beta.

    Mann said that when it comes to machine learning in IT operations, otherwise known as AIOps, the most challenging task ahead is establishing trust. IT professionals are not going to sanction a “black box” approach that doesn’t enable them to see how a machine learning framework is determining what to automate. Because of that issue, Mann said, providing a root cause analysis capability in ITSI is critical.

    The next big issue facing organizations, he noted, is improving the quality of the data being used to inform a machine learning framework. One of the benefits of the DevOps movement is that, as developers take responsibility for both building and running applications, more of them are paying attention to how log data is being created. Mann said the notes developers leave within an application on how to resolve issues are becoming more detailed, a process that Splunk refers to as “semantic logging.”

    Mann noted the goal is to create a closed-loop system where every IT issue eventually creates a ticket in a DevOps system for developers to address. The bridge between those processes will be the chat capabilities provided by the VictorOps incident management platform. In fact, Mann said Splunk is moving from being a provider of log analytics software to being a provider of a continuous monitoring solution that analyzes data both stored in logs and in near real-time using a Splunk Data Stream Processor, which is currently in beta.

    It may take a while for that loop to be completely closed. But it’s clear that many of the tools that IT operations teams rely on today are becoming increasingly DevOps-friendly.

    — Mike Vizard

  • Log Management: What DevOps Teams Need to Know

    Log Management: What DevOps Teams Need to Know

    One of the most important shifts of this decade is the rise of interconnected data across distributed systems. This explosive growth not only sparked the need to rethink cloud and global IT strategies, but it also disrupted traditional development, DevOps and ITOps practices. These changes are pushing requirements for higher-velocity development of features and products—together with more responsive support requests—onto technology professionals. These new requirements have prompted teams to evaluate new tools and agile processes that help support the needs of a competitive modern business.

    Regardless of the pace of change within your group, basic functions such as infrastructure monitoring are crucial to operating production applications. At this new speed of business, concepts such as observability are important for enabling successful deployments with fewer user interruptions—not only in production, but also in the early stages of your continuous integration/continuous delivery (CI/CD) pipeline. As part of “shifting left,” log and event management in your CI/CD pipeline empowers developers to monitor and observe application behavior before releasing it to production. While some might say this adds additional layers of process, time, effort and due diligence in dev environments, it can help you evolve your organization’s fundamental software development behaviors while reducing preventable issues from post-deployment into production. It can create a smoother, more seamless user experience and reduce the need to fight fires or rearchitect your solution after the application is live in production and at scale.

    Setting the Testing and Dev Stage

    The rapidly evolving technology landscape has increased the need for log management and observability across distributed systems and containers. Changes to how applications and services are created, the ability to deploy applications across combinations of global logging-as-a-service (LaaS) providers and the pervasiveness and volatile lifespan of containers, along with the capacity to build services using various development languages, has increased the need to collect, monitor and trace data points across connected systems, which provide critical end user-facing value.

    Traditionally, many considered log management a tedious task because each instance of a new server required you to run a search command across the logs local to that server. That approach isn’t scalable when every cluster of more than 20 servers is built up in minutes, and each application has independent logging formats. In this scenario, you’d need to run 20 individual searches across multiple systems, compare timestamps across servers residing in different time zones and so forth. With the decreasing cost and increasing prevalence of containers and virtual systems, the number of systems running within a typical organization has grown exponentially as the business prospers.

    In addition to increased usage of virtual systems and containers, independent scrum teams of developers can build in parallel using technologies which are the best fit for the services they are producing, while also sharing environments for builds, staging and production. With these distributed services, aggregated log systems can quickly determine the root cause for debugging their application’s errors, exceptions or performance bottlenecks. A log aggregation system can reduce the element of “personalization” that can often happen when developers are using different technologies with various logging formats, and also reduces the noise by filtering out information that delays the team’s ability to find the source issue. This can cause confusion or slowed productivity when one developer is left to understand another’s non-standardized, yet shared, workload.

    The reduced cost, increased collaboration and prevalence of container services are collectively driving an uptick in virtual environments and containers, often requiring more logs to be created in testing and dev environments, which can force organizational shifts to enable full observability across their infrastructure.

    The 3 Pillars of Observability

    Businesses are in the midst of a shift toward adopting these principles—the three pillars of observability—and using a three-pronged method of monitoring that takes data from several vantage points to depict a more accurate and consumable view of overall health and stability:

    1. External Monitoring: An example of this is health checks run against your internal and external applications and websites to see the “digital experience” of your users.
    2. Metrics and Distributed Tracing: This enables you to trace communications between applications distributed across systems/containers to identify errors and exceptions from your applications and resolve latency quickly.
    3. Events and Logs: Data, which helps provide contextual information about events, enables you to identify issues in the code when combined with information from the first two pillars.

    The above types of information are critical to DevOps to provide elastic and resilient services. Bringing application, system and infrastructure events into logs together with external monitoring and metric collection is quickly becoming the standard. With powerful log-parsing features such as live-tail search accessible from a web browser and the ability to visually pair log insights with added health metrics, the real value of log data is made apparent with little effort.

    Site reliability engineering (SRE) is another area where significant evolution has occurred. ITOps has always been asked to react to fire and run from fire to fire. The evolution from ITOps to DevOps to SRE is forcing the alignment of different types of data to be used very early in a CI/CD pipeline, and enabling SRE teams to get involved in architectural discussion at project inception instead of in the latter stages or at release. The SRE is more involved in monitoring, understanding the development and architectural principles used to develop application services and build in automation, and high availability and circuit breaker patterns from inception.

    This approach has allowed teams to be proactive and responsive rather than reactive. It has equipped our teams (which keep our business running successfully and our customers loving what we do) with the ability to focus on being scalable, elastic and resilient. Instead of troubleshooting systems in production, we auto-scale and replace to minimize disruptions and investigate that incident offline when possible.

    Best Practices

    Given the increasing pace of application development required to support the needs of the business, the spread of containerized applications and virtual environments and the emergence of new disciplines for observability (due to the lowered costs and increased reliability), log and event management has become a critical aspect for all involved in building, supporting and even using mission-critical applications. It’s moving to a defined area where logs should be compartmentalized, and access control should be defined:

    1. Compartmentalizing Logs: Critical as a best practice so we can differentiate development, staging and production environments and segregate logs based on practical grouping. Using a log aggregation service provides you with a consistent experience and a common set of capabilities across all your environments.
    2. Access Control: Another best practice that should be implemented more broadly; for example, developers don’t need access to all of your production logs if approximately 95 percent of their work happens prior to reaching production environment. In other words, even though tech pros are working to “de-silo” log management, we still want to silo access control and manage visibility. This can also help to ensure personally identifiable data (PII) isn’t exposed to anyone it shouldn’t be.

    Looking Toward the Future of Log Management

    As the landscape evolves and best practices become more defined, we should expect revitalized strategies with elevated expectations for the traditional scenarios where basic/free monitoring is leveraged. While the pillars of observability are leveraged more broadly in the ITOps and DevOps communities, we’ll be able to move more efficiently from an end user-facing incident—for example, an application error traced across distributed systems—straight into the logs to find the specific error causing the issue. We’ll be able to see greater correlation between logs and other custom metrics, as well as much broader use of these techniques outside of production environments.

    DevOps teams need an intuitive event and log management system that is as de-siloed as we are. No longer can log management systems be relegated just to one on-premises storage system or one virtual environment; they need to fit the reality of how work is increasingly done today and will be in the future.

    — Keith Kuchler

  • The Art of Software Performance Testing

    The Art of Software Performance Testing

    When users turn away from applications or have critical feedback, it’s often because the application is slow, hangs/freezes or, worse, it isn’t available when needed. In this era of limited—or, zero—patience for app instability, delivery teams should ensure that their performance testing capability is sound. First though, let’s start with definitions. Despite popular opinion, performance testing is not the same as load testing. Load testing checks how systems function under a heavy number of concurrent users performing transactions over a certain period of time, while performance testing is much broader in that it checks how the system behaves and performs. Performance testing examines responsiveness, stability, scalability, reliability, speed and resource usage of your software and infrastructure.

    Performance testing doesn’t always get the attention it deserves. Testers have a tendency to focus on features and component functionality, even when verifying performance on application architectures designed leveraging APIs. As software development methodologies and application infrastructure evolve, so should performance testing. We observe that in Agile teams, performance testing typically executes at least one sprint behind other testing methods. Performance testers don’t start testing until the application’s features are deemed stable. They operate separately from the delivery team. Yet, performance testers should run tests as soon as new code is available, which in turn helps developers receive real-time feedback on issues that they then can fix immediately.

    To ensure a successful strategy in validating the performance of an application, here’s a look at three fundamental performance test categories:

    • Endurance: This involves running a transaction or scenario continuously for a period of time to detect memory leaks or anything else that causes a system to slow down.
    • Breakpoint: The goal here is to increase the load on a system until it reaches a threshold, after which it crashes. These tests are critical to understand at what point the system or underlying components will buckle.
    • Scalability: By increasing the number of concurrent users, instances or database size, you can measure how applications will handle growth.

    Performance Testing: Recommended Tools and Skills

    Performance testing is difficult without automated tools that can simulate scenarios and user activity so that you can test comprehensively. Many good tools are free or available as open source. Some of the popular ones include JMeter, Grinder and Locust.io.

    To be successful, performance testers need a DevOps mindset. Technical skills are a must, since understanding software code behaviors and interpretation of hardware and software utilization is necessary. An understanding of how to interpret the technical concerns observed from the business perspective is also a great skill to build. Tests should always answer a “what if” scenario and occur within the sprint. Hence, the ability to apply a continuous testing approach as part of the holistic testing strategy is a great skill to learn! Finally, learn how to provide real-time feedback to developers, as a form of hypothesis about changing code to support better performance tracking.

    Guidelines to Make Your Performance Testing a Success 

    These steps will  help structure your performance testing to achieve results for the business success of the delivered application:

    1. Map your tools and environment. You’ve got to understand the environment infrastructure that will host the application under test. The ability to quickly configure, build and tear down the environment to test is a crucial time-saver.
    2. Set acceptance criteria. Getting concise goals of application performance among all stakeholders will chart your path and allow you to gauge success. An example metric is page load times for your mobile application.
    3. Define KPIs. The acceptance criteria will dictate the KPI goals for performance tests. These may include percentile response times, throughputs, garbage collection performance, heap utilization and resource utilization.
    4. Set up test runs, execute and monitor. After completing the preparatory steps above, you can define test scenarios and create the test cases. Don’t forget to incorporate monitoring. This entails creating alerts in the testing environment to ensure that monitoring services are working as expected.
    5. Analyze, repair and assess. After each performance test cycle has completed you’ll want to assess the results against your acceptance criteria and fix any problems immediately. Over time, acceptance criteria will change and so should your test scenarios and anticipated outcomes.

    As with all testing activities, early involvement and collaboration with developers, analysts and business stakeholders will save time and headaches later. The more you know about the technology stack and upcoming application changes, anticipated maturity of the application and evolving business goals, the better prepared you can be for any testing need as it arises.

    In the evolving shift to a modern software development environment, performance testing has become central to building confidence in software. It’s time we give it our full attention.

    — Mush Honda

  • The Value of APM in Application Building and Management

    The Value of APM in Application Building and Management

    There are literally billions of smartphone users on the planet. Many of these users interact with apps on a daily basis. With all of the competition in the app market, developers have to stay on the cutting edge of technology to keep their programs both functional and popular.

    It is imperative that you adequately monitor your app after it has launched. Getting an idea of how well your app is performing can alert you to issues that may need to be addressed. Reading articles such as, “What is application performance management? 10 APM features” is an excellent way to wrap your mind around this concept.

    The following are just some of the things you need to know about app performance management and what it can do for your programs.

    Launch and Resume Times

    When trying to get a handle on how well your app is performing, be sure to focus on both the start and resume time users are experiencing. In most cases, startup will take much longer than resume time if the app is continuously running in the background.

    Both launch times affect the user experience in a significant way. If startup and resume times are getting increasingly slower, chances are your app needs a bit of retooling to keep up with your user’s needs.

    UI Response Times

    In the past, app developers would use network request times to gauge how fast users could submit and complete actions on their program. However, users only care about how fast their action completes, now how fast the network actually responds.

    When measuring UI response times, do so according to the device or OS the user is working with. This will allow you to:

    • Focus more on individual platforms and the problems they may have.
    • Respond to performance issues on a case-by-case basis.
    • Develop solutions for these problems in an easy and comprehensive way.

    When measuring UI responses times, be sure to rank the tasks by importance. By focusing on the issues that will affect user experience, you can keep your app running efficiently. Focusing first on tasks that don’t really matter will lead to the user experience suffering as a result.

    Monitoring App Crashes is Crucial

    Crashing apps are bad for both you and the user. Not only will they result in a lower user experience, app crashes also mean an increased amount and lost revenue for you. When your app crashes, you need to look at all angles to figure out why this happened and what can be done to fix it.

    Did this user’s actions cause the crash? What types of crashes are affecting UI? The answers to these questions will help you diagnose and prevent future issues. Having an adequate error logging system in place will allow you to get in-depth information when crashes occur. This information will help you fix issues in a hurry and avoid excessive app downtime.

    Helpful Tips and Tricks That Make Application Monitoring Easier

    Now that you know what types of things you need to be monitoring, you will have to figure out how to make application performance monitoring (APM) work for your company. Ideally, you want to provide users with apps that are both easy to use and reliable. If you are developing apps for your employees, you need to ensure they are able to boost productivity.

    By adequately monitoring your applications, you can find and address issues that exist with ease. Closely monitoring your apps will also give you a better understanding of how users are interfacing with them.

    Here are some of the things you should keep in mind when trying to put an app monitoring plan in place:

    Decide Which Apps Need to be Monitored First

    The first decision you have to make during this process is which apps you want to monitor. If you are monitoring the apps you provide to your employees, pick the most popular ones get metrics from. Are you unsure about what apps your employees use the most? If so, you need to get them to weigh in on this important decision.

    Often times, employees will be able to provide you with an outside perspective. With this perspective, you can clearly define the parameters of your application performance management plan. Neglecting to get this type of guidance may lead to you monitoring apps that are rarely used, which is a waste of time and money.

    What Critical Transactions Will You Monitor?

    To figure out what type of app transactions  you will monitor, you have to put yourself in the mindset of the end user. By doing this, you should be able to create a map of user functions. Once you have this map in place, you should be able to easily see what types of transactions you need to monitor.

    If you are monitoring an app you have given to employees, you need to map out workflows. Is the app in question making them more productive? If employees or users are having to go through too much hassle to access common functions, you have to work on streamlining your app. While this will take a bit of trial and error, it is definitely worth the effort.

    Polling Frequencies and Alerting Policies

    Adequately monitoring key transactions within your app allows you to identify performance problems earlier. When things such as threshold violations occur, you need to determine who should be alerted. Not only will you need to set alerting policies, you also need to figure out how many times a certain violation needs to happen before you send out an alert.

    Setting the violation count too low can lead to false alarms, setting it too high can put the functionality of your app in jeopardy. By taking control of your app’s monitoring, you can avoid user issues and crashes.

    Custom Reports are a Good Thing

    The performance reports you provide shareholders, employees or investors should be tailored to their needs. In most cases, investors and shareholders will only be concerned with how much productivity and capital an app is generating. This is why you will need to avoid giving them app performance reports with in-depth error reports on them.

    Generating detailed reports for employees with the various error messages an app is generating is crucial. Providing your team with this information can make it much easier for them to address ongoing app issues. Failing to get help with the monitoring and maintaining of your app can lead to a number of problems in the future.

    Create a Centralized IT Response to Deal with App Performance Issues

    While closely monitoring how your app is performing is important, you will need a system in place for dealing with the problems this monitoring can discover. Oftentimes, large businesses will have multiple apps in use at any given time. This is why having the right team and response plan in place is so important.

    Even the slightest misstep can lead to an app becoming unreliable and unusable. The information you get through monitoring the performance of an app can help you nip problems in the bud before they cause any real damage. The last thing you want to do is ignore signs of app trouble due to the serious issues it can cause.

    Keeping Everyone in the Loop is Vital

    Some business owners think that app performance monitoring is a solo sport. Usually, this attitude will cause a variety of missteps that will make an app less useful and more problematic. To use the data from APM properly, a business owner will need to involve their entire team. With all hands on deck, a business owner can delegate certain parts of the app monitoring process to various team members.

    Not only will this take a lot of stress off of a business owner, it will make this process more successful. In most cases, business owners who attempt to handle the app monitoring process alone will become overwhelmed and will make crucial mistakes as a result.

    Use App Performance Data to Optimize a Program

    One of the biggest misconceptions about app performance monitoring is that it can only be used to find functionality issues. The reality is that this data can help you see how to make your app more useful to employees or consumers. Failing to constantly improve and optimize the apps you have can lead to them becoming obsolete. In the world of technology, you either roll with the changes or the changes roll over you.

    Embrace the Power of Technology

    Creating a competitive edge should be one of the main concerns you have a business owner. Utilizing the power of technology is a great way to make your company unique. By providing both employees and consumers with useful apps, you can stay on an upward trajectory.

    The time and effort you put into adequately monitoring app performance will definitely pay off. If you are unsure about how to start the app monitoring process, reach out to an IT professional for help.

    — Wendy Dessler
  • Moogsoft Extends AI Reach into IT Operations

    Moogsoft Extends AI Reach into IT Operations

    Moogsoft, at a Moogsoft 2018 AIOps Symposium last week, extended the reach of its IT operations analytics software out to where applications are deployed, rather than requiring data to be moved into a Big Data platform.

    Will Cappelli, CTO and vice president of product strategy for Moogsoft, said Moogsoft Observe, available in beta, discovers anomalies by applying algorithms where data is generated, versus requiring IT organizations go to the trouble and expense of moving massive amounts of data into a central data lake.

    Moogsoft Observe ingests time-series and metrics data in real-time and then applies artificial intelligence (AI) to detect incidents at the source of the problem. The single-agent technology can deployed anywhere, including cloud instances and on-premises systems and applications running containers and virtual machines.

    Cappelli noted Moogsoft Observe doesn’t require data scientists to configure it. IT generalists can employ Moogsoft Observe on their own without having to rely on a centrally managed IT operations analytics platform managed by someone else. Moogsoft claims this approach reduces the time to detect a problem by up to 60 percent while cutting nearly 90 percent of the storage and communication costs.

    Analytics generated by Moogsoft Observe can then be stored in the Moogsoft AIOps platform to enable IT organizations to run additional analysis against data collected from multiple data sources.

    Moogsoft also announced that version 7.0 of the Moogsoft AIOps platform will be available this October. This update adds Vertex Entropy and Situation Topology Visualization, algorithms that enable IT teams to visualize the root cause of an issue via a system topology map. That capability makes it possible to apply algorithms capable of generating contextual analysis that pinpoints the source of issues rather than generating a series of probabilities based on when a set of events occurred, said Cappelli.

    Advances in how AI can be applied to automate IT operations are now coming at a rapid rate. Those advances increasingly are becoming affordable for the average IT organization to employ. Most IT teams spend more time trying to determine the source of problem than they do fixing it once the root cause is discovered. AI technologies promise to eliminate many of the rote tasks that IT administrators are required to manually perform time and again, which will make it simpler to manage IT at scale. It also means more IT teams can expect to not have work as many odd hours of the day because fewer things are likely to go wrong. There may never be a perfect IT environment. But IT environments should be a lot more predictably reliable.

    Of course, the rise of AI undoubtedly will have a significant impact on the IT staff. Many IT administrators will need to be retrained as more processes become automated. It’s not likely the need for IT administrators will go away anytime soon. But as some tasks become automated, many entry-level IT roles will change dramatically or, in some cases, be eliminated. At this point, those changes are now all but inevitable.

    — Mike Vizard

  • How to Use APM to Hold Cloud Providers Accountable

    How to Use APM to Hold Cloud Providers Accountable

    Here’s the challenge: Cloud providers’ service level agreements (SLAs) typically stop at the edge of their cloud, while your internal service level expectations run end to end. Measuring performance from the end user to the application and back, including device details, user productivity and page load times, is essential for customer satisfaction and continuous performance tuning. How long does it take to launch an online app, open a work order or complete a claim form? What are execution and completion rates in different locations? The metrics and associated metadata provided by application performance monitoring (APM) tools can help your DevOps teams rapidly identify actual performance issues, troubleshoot them quickly and efficiently and optimize cloud spend and service level agreements.

    Automate Data Collection

    Collecting performance details for multiple web browsers, operating systems and devices is impossible if you have to manually tag and instrument the code. Modern APM solutions automatically deploy JavaScript snippets, page tags or agents to your web pages, Java and .NET applications and mobile apps. Small binary agents and efficient compression algorithms ensure minimal performance impact to the end user device or the network as they send telemetry information to the APM back end. Your DevOps team can then work with the actual attributes of every device, including manufacturer, model, operating system type and version and resource consumption to monitor the end user experience across IaaS, PaaS, SaaS and hybrid environments.

    Early Warnings with APM

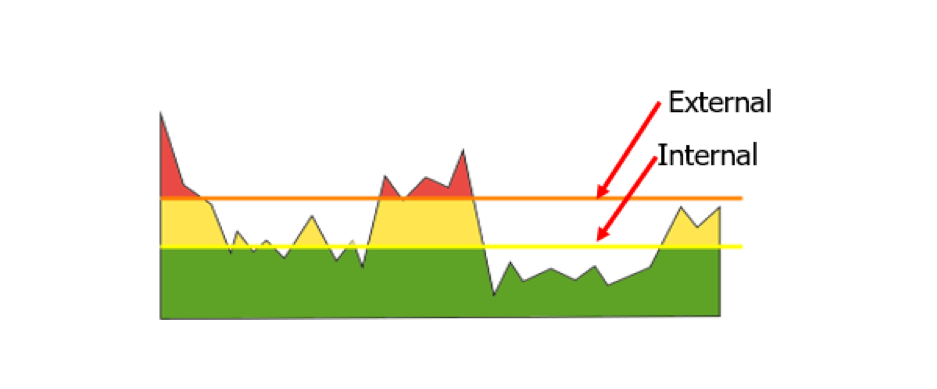
    To trigger early warnings, APM systems automatically determine an application baseline, or you can manually set specific thresholds. Typically, internal thresholds are set up to provide early warnings of possible issues before users are negatively impacted, while external thresholds can be linked to your actual SLA terms.

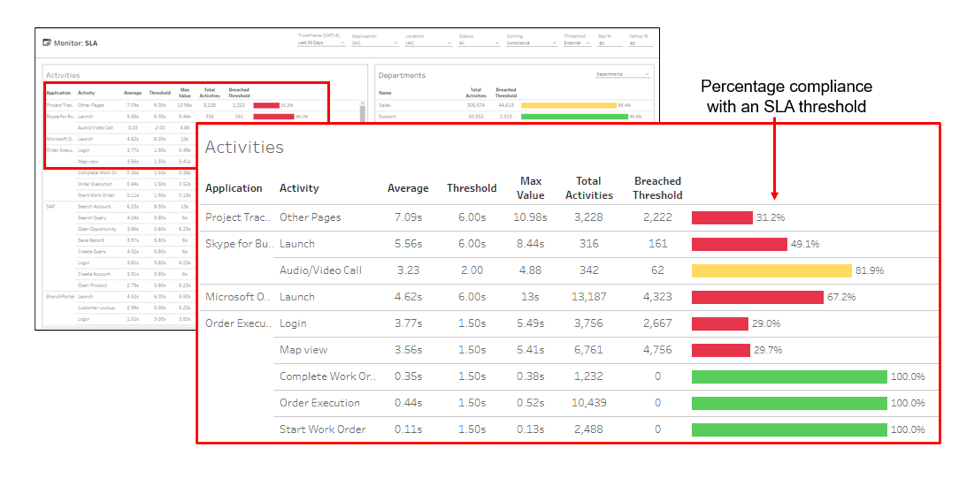
    These SLA reports are more than colorful views. By using dashboards that color-code SLA status based on the end user experience, you can better enforce service levels with your cloud providers. For triage purposes, you can break out details by department, geography, operating system, device type, target server, carrier and other characteristics as needed. You can also see at a glance your compliance measurements, which show the percentage of response times that are meeting the agreed-upon targets with your cloud providers to hold them accountable for performance.

    Streamlining Remediation

    Automation is key to accelerating mean time to repair (MTTR). When an alert is triggered, APM tools integrate with your service desk systems to automatically open trouble tickets, identify probable causes and analyze the business impact for prioritization. This level of detail and integration significantly reduces delays that are historically associated with performance troubleshooting, as it provides the necessary context for troubleshooting. Another option with advanced APM solutions is the ability to automate remediation of common end user experience issues, without involvement of the service desk staff.

    Comparing Before and After

    Another useful outcome of these detailed metrics is the ability to compare parameters before and after a change. By baselining performance, APM tools help you document and validate the actual end user experience impact of code releases, device changes or service provider upgrades. It’s not uncommon for users to complain after a new release, but using APM reports you can take a data-driven approach to quickly investigate user complaints by comparing different time intervals. You can start by exploring various characteristics and isolate the affected group based on device health, network subnet, geography, server or cloud provider. Once you have determined whether the problem is within your control (code, architecture, etc.) or within your service providers’, you then can have more productive discussions with service providers to demonstrate exactly where and when an SLA violation occurred.

    Keeping Track of SaaS Applications

    As you expand use of SaaS applications such as Office 365, end user experience monitoring and SLA management can be used to hold these providers accountable. Slow application launches, logins, page loads and other performance issues can impact user productivity, adoption rates and deployment schedules, costing the organization support resources and unused license fees. That’s why SaaS-based APM tools give you immediate usage measurements, enabling you to quickly adjust license quantities and optimize costs. Real-time monitoring of user wait times, crashes, device health and other experience metrics gives your team comprehensive awareness of how performance, device type or operating system versions are affecting employee productivity. This information can be used to quickly identify problem areas, validate migration plans and prioritize future investments.

    Monitoring for Accountability

    Getting what you pay for from your cloud providers is much easier if you incorporate detailed user experience measurements into your SLAs. A best practice is to monitor everything that happens on every device across the organization such as how long it takes to boot up, login, open specified apps and perform business-critical tasks. If any of these are off target, your APM solution can open and prioritize a trouble ticket with a list of probable causes, before the affected users can call support. Automated end user experience monitoring, reporting, and policy management, backed by self-instrumenting devices and apps, are essential links between a service provider’s commitment and your actual results.

    — Gayle Levin

  • VMware Looks to ‘Ruthlessly’ Automate IT

    VMware Looks to ‘Ruthlessly’ Automate IT

    VMware, at VMworld 2018 this week, advanced an ambitious campaign to automate IT management by announcing a deal to acquire CloudHealth Technologies and then previewing a Project Magna initiative that employs machine learning algorithms and other forms of artificial intelligence (AI) to create what VMware describes as self-driven data centers.

    VMware CEO Pat Gelsinger told conference attendees that, as part of achieving that goal in the era of the cloud, every aspect of IT now needs to be automated.

    “The rule of the cloud is to ruthlessly automate everything,” he said.

    Project Magna represents an effort to centralize AI research and development to enable IT organizations to reallocate resources to building applications by eliminating many of the manual tasks that conspire to make IT inflexible.

    At the same time, increased levels of automation will serve to reduce the cost of labor associated with managing IT, which remains the single highest cost within most IT budgets. Without increased levels of automation, those costs inevitably will rise as IT organizations embrace not only public clouds but also emerging new platforms such as Kubernetes.

    Gelsinger this week made it clear VMware views being able to automate the management of Kubernetes as an opportunity to expand the reach and scope of its management offerings.

    The addition of CloudHealth Technologies to the VMware portfolio adds a cloud operations platform that spans Amazon Web Services (AWS), Microsoft Azure and Google Cloud Platform (GCP). Once the acquisition is formally closed, VMware has pledged to integrate its cloud automation services, Secure State and Wavefront cloud services with the CloudHealth platform. The CloudHealth platform will be rebranded VMware Cloud Operations. Those moves come on the heels of a significant expansion of the portfolio of DevOps tools the company also announced this week.

    VMware also revealed its is working on the Dimension project with Dell EMC and Lenovo, which will create a hyperconverged architecture optimized for deployment at the network edge. Project Dimension will make use of VMware NSX network virtualization software and the software-defined wide area networking (SD-WAN) platform gained by the company’s acquisition of VeloCloud to connect servers running at the network edge. That initiative complements the existing Pulse project for managing internet of things (IoT) devices, for which VMware announced REST application programming interface (API) support and which will be available as an on-premises or a software-as-a-service (SaaS) application.

    VMware this week also unveiled updates to updates to its vRealize automation portfolio that enable organizations to rightsize workflows and automate host-based placement of those workloads. The core vRealize Automation platform also sports a new user interface and integration with open source Ansible Tower automation software and integration with Pivotal Container Service (PKS), an instance of Kubernetes. Version 7.5 of vRealize Automation 7.5 also features enhanced AWS and Azure support.

    It’s unclear to what degree increased automation will transform how IT is managed within the context of modern DevOps processes. But the one thing that is clear is the economics of IT are being altered. Via automation VMware is sharply reducing the need for IT specialists in favor of “super” administrators capable of managing compute, storage, networking and security at unprecedented levels of scale in a much more integrated fashion. How much of that will be accomplished by AI is still anyone’s guess. But it’s already clear the job of the average IT administrator will soon be transformed utterly.

    — Mike Vizard

  • Rethinking the APM Paradigm: A New Vision for Enterprise Application Monitoring

    Rethinking the APM Paradigm: A New Vision for Enterprise Application Monitoring

    Traditional APM systems today can’t measure up to tomorrow’s processes

    IT today is inordinately complex; continually pushing the boundaries and comprehension for even the most sophisticated minds. And while modern IT is unlocking new, innovative experiences and capabilities, the advent of cloud computing and its distributed, ephemeral nature has also made it extremely difficult for IT managers to keep apprised of their infrastructure stacks.

    This reality has taken shape so swiftly and with such a vengeance that Gartner estimates by 2021, enterprises will be able to monitor only 20 percent of their applications accurately. In a digital world, that is like a department head saying he or she knows what happens in only 20 percent of your factories or storefronts. Twenty percent, regardless of the industry or circumstance, is both unacceptable and a grave risk to business continuity and success.

    APM Helps, But Not Much

    Enterprises need to know what the other 80 percent is doing. Unfortunately, the traditional application performance management (APM) tools on which enterprises typically rely are no longer up to this task for three reasons.

    First, the modern application suite looks very different today than it did just a short time ago. The monolithic and custom ERPs, CRMs and other enterprise systems that were the hallmark of big businesses a decade ago are giving way to cloud-based, off-the-shelf, as-a-service solutions constantly updated with iterative DevOps and agile development techniques.

    Second, most traditional APM tools rely on embedded monitoring agents installed on the monitored system, or they need code-level insertions tactics to monitor. Either way, that type of burden is unsustainable at today’s enterprise scale and doesn’t work when applications are launched in containerized cloud environments. It also fails to account for the shift to more off-the-shelf or as-a-service solutions created without APM data outputs.

    Finally, the very infrastructure enterprise operates on looks nothing like it did even five years ago. Most enterprises have moved (or are in the process of moving) to cloud, multi-cloud, or at least hybrid infrastructure. The advent of cloud and the ephemeral nature of microservices and containers means that application topology looks very different at 8 a.m. when only early-bird employees are in the office, then it does at 10 a.m. when the remaining employees arrive. That unpredictability is a nightmare for APM tools, which, at best, now offer only a keyhole view of the entire IT enterprise; performance management now relies as much on the infrastructure as it does the application.

    So, What Needs to Change?

    Traditional APM tools are battleships in an asymmetric warfare age: highly specialized and designed for a single mission, but at the cost of the flexibility to adapt to modern environments as needed. We need carrier groups, not battleship armadas.

    The ideal APM solution for modern enterprises is an “agent-less” or “agent everywhere” approach. A modern solution must holistically consider how one application interacts with other applications. For instance, how does online ordering generate data and feed into warehouse processing tickets? And it must understand how those applications interact with the underlying infrastructure. For example, where are databases or applications stored and how reliable is that infrastructure?

    Current APM solutions miss the mark entirely, scratching only the most superficial layer of today’s technology stack when instead, they need to understand the relations from the deepest layers of infrastructure out to the end users’ experiences. Such an approach will allow enterprises to see into the other 80 percent of applications and deliver the insight and automation needed to drive robust and innovative digital experiences.

    However, knowing you need visibility and having it are two very different things. Fortunately, innovation within AIOps through agent and agentless technologies promises to deliver what conventional APM can no longer.

    By making visibility into application layers easier and deploying machine learning-enabled topological mapping between infrastructure and applications, AIOps is allowing for more detailed insights into the health of mission-critical business services than ever before. It allows enterprises to regain the visibility they’ve lost to an ephemeral world and be able to understand, organize and innovate with the agility they need to compete in today’s business environments.

    It is time to leave traditional APM behind and move forward into an AIOps enabled world. Neglecting to do so puts the business at ever-greater risk.

    — Erik Rudin

  • Predictive QA: Why Performance is so Important in a ‘Big Data’ World

    Predictive QA: Why Performance is so Important in a ‘Big Data’ World

    As organizations across all industries face opportunities and threats in the new digital era, they increasingly look to leverage their full power of the data they possess. Data is a treasure trove for enterprises, and big data mining has grown into much more than a sales tool. Advanced, predictive analytics are now used to hone processes, improve product quality and deliver those products more rapidly.

    Companies that are serious about digital transformation know the importance of big data. And, increasingly they are turning their attention to predictive analytics techniques as a means of assessing the whole product life cycle. In test automation terms, there are several benefits from a predictive QA approach: Getting the most out of the defect management and test automation data enables you to create better models, optimize testing processes and predict defects like never before.

    Features matter a lot with any product or service, of course, but what keeps users truly engaged is the overall experience. More than ever, that experience is dictated by performance—and why product performance matters so much.

    In today’s market, a company that can deliver quality products to market faster than its competitors gains a significant advantage. So, now the performance of teams in the software development life cycle (SDLC) is being closely analyzed to deliver quality at speed. However, enterprises that prioritize product performance over SDLC performance are not taking full advantage of the possibilities digital has to offer.

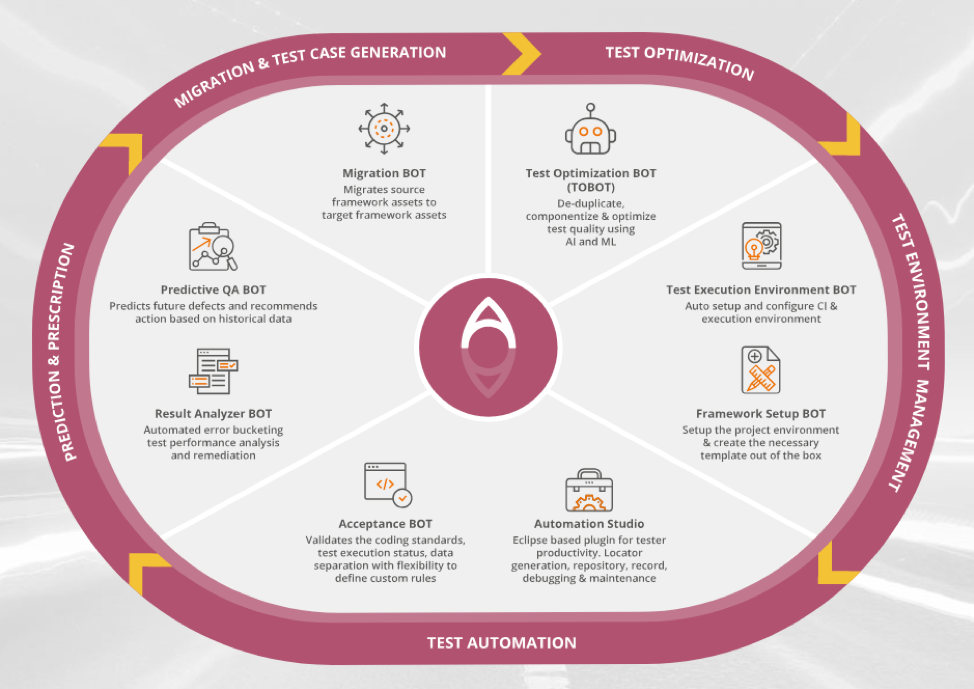
    SDLC QA ecosystem, with analytics engine at the core

    Just as with product performance, the ability to analyze SDLC performance is predicated on the amount of data you have to for analytics. The more data you have, the better—and the best way to gather that data is by automating activities, mainly because of the vast traceability and identification capabilities that technology provides. Because of this, automating testing activities is one of the biggest activities that organizations are implementing to enhance their SDLC performance. This is, in fact, a key driver in enabling digital transformation within any organization.

    However, the issue we see over and over again is this: The sheer quantities of testing activities that need to be automated are actually slowing organizations down. In part, testing complexity is to blame. Teams often feel there is a lack of skills in-house to ensure all the working parts operate and interact seamlessly. While these challenges with regards to automating test cases is valid, test data should not be seen as a huge obstacle, a mountain to be scaled.  With the right tools, that test data is an enabler to optimizing performance and holds the keys to the future success of your product through the analytics it can provide.

    Yet, compounding these challenges is the fact that toolsets have a habit of changing, so the data isn’t always structured uniformly. Now, organizations are going a step further with predictive analytics, powered by artificial intelligence (AI) and machine learning (ML) techniques, by leveraging their large volumes of structured and unstructured data available from defect management tools and test automation results.

    This means organizations are now able to successfully analyze SDLC performance by being able to incorporate data from all their testing activities to give them predictive QA capabilities.

    How predictive QA gives organizations an advantage over traditional QA comes in the form of intelligence. Predictive QA converts test data into actionable insights.

    Here are just some of the ways predictive QA will impact testing efforts:

    • Faster time-to-market
      • The first thing predictive QA will help with is reducing test cycles so that organizations can get top-tier software into customers’ hands faster. Predictive QA calls out inefficiencies, optimizes testing efforts and helps cut down on test cycles. We recently worked with a leading hotel chain that was able to boost test automation efficiency by 30 percent using AI and ML-driven predictive analytics.
    • Better defect detection
      • Defect detection is one of the first things that comes to mind when we talk about improving quality, and it is certainly true that predictive QA can do that with the available data. Using predictive techniques, software teams can drill down to understand root causes and failures, predict defect ranges and the risk of modules for future versions.
    • Understand what’s working (and what’s not)
      • With predictive QA, teams get unprecedented insight into what’s going on in their testing efforts. Using these techniques, teams can assess what is driving greater application lifecycle efficiencies—and they will plainly be able to see what is not. They will be able to address under-performing test cases and prioritize those with the greatest impact. And, it will enable them to better select the right types of testing and resources required for optimization.

    The growing demands of digital are pushing enterprises to the limit, requiring faster release cycles that consume a significant amount of resources. According to the latest World Quality Report, 99 percent of organizations face challenges testing in their agile environments while the average level of automation is only around 16 percent.

    Predictive analytics is beginning to address this in many ways. Invisible to the consumer eye, our increasingly connected world is reliant on accurate, actionable, automated analytics to power it. Predictive QA has proven essential in helping leverage machine learning and advanced analytics techniques, targeting both end-product and the design life cycle as a whole.

    Enterprises are looking to AI to exploit the wealth of data found in various levels of their IT organizations, whether at the software development level or on the production side, said Dominique Raviart, IT Services practice director for analyst firm NelsonHall. “With AI, they have an untapped opportunity to better identify where defects lie, increase the quality of applications, and ultimately improve the user experience of end-users, customers, and other stakeholders.”

    — Manish Mathuria

  • Automated Management with Modern Architectures

    Automated Management with Modern Architectures

    We’ve come a long way. Just five years ago, with virtual machines (VMs) and decent monitoring, I would never have considered active automated system repairs for the average organization.

    There were many reasons for that. Monitoring was spread out and required a lot of work to spin together. The volume of logs from monitoring was generally huge once logging was consolidated, and that was the best source of automated recovery information. The time it takes a VM to start up and the space that a fully installed VM took up on disk were both negatives to doing automated response.

    But that was then, this is now. And the world has changed. A lot.

    Most companies using cloud or container based architectures with DevOps are doing monitoring. Tools such as DataDog and ExtraHop between them monitor the application side of performance and the networkwide responsiveness of the application infrastructure. Most container-based architectures are using one or both with alerting to keep track of their system’s and instance’s performance. Add in container management systems, and the infrastructure to support systemwide automation is starting to look pretty darned complete.

    Beyond Monitoring

    The most advanced DevOps and automation shops have gone a step further and are using these tools to do automated management on top of monitoring. While tooling varies—and I do not mean to use the above two as the only solutions—they show well the two sides of monitoring: application and environment (in the case of ExtraHop, networking). Most organizations have a wider selection, including in-source tooling and other monitoring systems. But a few have stepped up to basing the decision to auto-correct on these tools. If ExtraHop is showing extreme response times from an instance, but other instances are responding just fine, that scenario can trigger spinning up a new instance and taking the old one down. The same is true if DataDog shows one instance is taking forever to process requests, while other instances are performing admirably. If the overall system response time is lagging, new instances can be automatically added, either by directly spinning them up or making a call to the container management system to do so.

    In the case of the failing machine, companies that have been doing this for any length of time will happily tell you to keep the instance taken offline so you have a record of what went wrong and can fix it. Heartbleed would have been a different beast had this been followed, and others will give you the same story of, “It’s hard to troubleshoot when the evidence is destroyed.” So while many companies tend to think along the lines of, “If we pulled it down and replaced it, we don’t need it anymore,” what should be done is, from the start, set up to keep the container and take time to look at it to help determine what went wrong before it goes wrong again on a different instance.

    No Muss, No Fuss

    The idea of the “self-healing network” is certainly nothing new. The difference is that machine speed, monitoring tools, management tools and platform have all evolved to a point where all of us can implement it. That doesn’t remove work around problems with responsiveness, but it does offer a stopgap that will keep many applications up and responsive while you figure out why they’re having issues.

    One key is to have an alert system that lets the team responsible know what has happened. If automation replaces an instance, the team needs to know which instance it took down so it can grab the files and figure out what happened. If three of those notices come across in 10 or 15 minutes, you have a definite problem that needs more proactive interaction.

    For clarity: My caveats every time I say “this works” are simple—network issues (inside or outside your network) may be causing perceived performance issues, and these systems can’t do much about that. Hardware failures are not resolved by dropping an instance and spinning up a new one, etc. But until monitoring and management alerts reach alarming stage, the application is likely humming along. And the team can focus on enhancements, not spinning up replacement instances. The larger the server base, the more important this is.

    New products, enhancements to existing products, fixed bugs, improved architectures—concentrating on these issues instead of keeping the system live is always a win.

    So if you’re not using automated management, it certainly is worth a look. Your environment is unique, and it fits better in some than others. So I’ll leave it to you to evaluate in light of your architecture. But if you can free up time, I highly recommend you do.

    — Don Macvittie