Category: Application Performance Management/Monitoring

  • Black Box vs. White Box Monitoring: What You Need To Know

    Black Box vs. White Box Monitoring: What You Need To Know

    The word monitoring possesses a meaning most people are familiar with. But what does monitoring actually break down into if you’re monitoring servers, applications and hardware?

    One way of answering this question is in terms of black box and white box monitoring. The latter term refers to application monitoring, and the former to server or hardware monitoring.

    In this article, I’ll explain white box vs. black box monitoring in more detail.

    What is White Box Monitoring?

    White box monitoring is the monitoring of applications running on a server. This could be anything from the number of HTTP requests your web server is getting to the response codes generated by your application. Other types of white box monitoring include:

    • Monitoring MySQL queries running on a database server.
    • Looking at the number of users utilizing a web application throughout the day, and alerting if this goes above a predefined threshold.
    • Considering the above example of HTTP requests—splitting these out into monitoring the different kinds to ascertain how the application is performing, or whether users are getting served the correct content. For example, a 403 would demonstrate a user has tried to get to a part of the website they’re not allowed to visit. Likewise, a 200 would indicate their request was successful and they were served the content.
    • Performing advanced detection of behavior we don’t expect to see, such as a user not going through the normal steps you’d expect when signing into your application or resetting a password.

    What is Black Box Monitoring?

    Black box monitoring refers to the monitoring of servers with a focus on areas such as disk space, CPU usage, memory usage, load averages, etc. These are what most in the industry would deem as the standard system metrics to monitor. Other types of black box monitoring include:

    • Monitoring of network switches and other networking devices such as load balancers from the system metrics perspective, as defined above.
    • Looking at hypervisor-level resource usage for all virtual machines running on the hypervisor (such as VMware, KVM, Xen, etc.).
    • Alerting on hard disk errors that may present a problem if a disk isn’t replaced soon (using SMART, for instance).

    Differences Between Black Box and White Box Monitoring

    There are differences between these two types of monitoring. Traditionally, systems administrators would take care of both white and black box monitoring; however, with the advent of DevOps and modern changes in the IT industry, we’re increasingly finding that application developers are taking responsibility for the monitoring of the applications (white box) they’re writing and as a result, are building monitoring solutions or writing checks for monitoring systems deployed by DevOps engineers.

    Systems administrators and DevOps engineers tend to take responsibility for the monitoring of black box items such as servers. There is some crossover where DevOps engineers can also take responsibility for white box monitoring, but this depends on the business or environment you’re working in.

    White Box vs. Black Box Monitoring: Which is More Important?

    It’s important to realize the significance of both types of monitoring. Historically, there was a gap in monitoring applications, and this presented lots of problems because black box monitoring would pick up issues with systems, such as high load or high network traffic, but there would be no information on the application side to show why this was happening—and more often than not these issues are caused by application issues, not server issues.

    A good example of white box monitoring and its importance can be demonstrated with a black box monitoring check alert, and showing how the two work together. Take, for example, a black box monitoring alert that tells us that our server’s CPU usage is at 100 percent. We go on to investigate this issue and see that MySQL processes are the cause of this alert. If we have white box monitoring in place to also monitor the queries running in MySQL, the amount of connections into MySQL and the amount of time it is taking for queries to run, then we have a lot more information to help diagnose the issue. This could allow us to demonstrate that an application is running a query that is too resource-intensive or is badly designed, and provide feedback to the application teams with hard evidence.

    Conclusion

    There have been many changes to the way in which we implement monitoring systems over the last few years. We’ve moved away from implementing purely black box solutions to implementing white box solutions alongside them. And there are new solutions available that allow both types of monitoring to be performed from within one single application.

    This is incredibly important, as it allows us to have more synergy between our development and systems teams, plan properly for capacity enhancements and deal with issues that may arise. As a DevOps or systems engineer in the modern IT industry, I think it’s vital to take these different monitoring methodologies into account when building out any support/monitoring solution for your team.

    — Keith Rogers

  • An Easy Way to Optimize Network Performance Monitoring

    An Easy Way to Optimize Network Performance Monitoring

    Network performance monitoring, and especially network optimization, is more of an art than a science because there are so many factors that figure into network and application responsiveness. In addition, because there is a vast amount of data traversing the network, determining the right kind of data you need to monitor (and where you should you be capturing the data from) can become very difficult. As an example, according to research conducted by Enterprise Management Associates in October of 2016, 41 percent of IT personnel spend more than 50 percent of their time working on network and application performance problems.

    The data collection process is further complicated by the fact that tactical data loses up to 70 percent of its value after 30 minutes. This makes the speed and accuracy of data analysis critical if you hope to resolve your network or application issues.

    There is one easy way to improve your lot in life, though: Add a network visibility architecture. Most IT personnel have a security architecture and a network architecture, but very few have a visibility architecture. Network visibility is what enables you to capture the right data at the right time, so you can do something useful such as quickly isolate potential problems.

    Setting up a visibility architecture is straightforward. There are four main components:

    • Data access
    • Data manipulation
    • Application intelligence
    • Purpose-built analysis tools

    Data access can be provided by physical taps, virtual taps and bypass switches. These devices give you timely access to the data you need. A SPAN port also can be used; however, there can be issues with the quality of the data from this type of device, so it is not recommended.

    After you have acquired the monitoring data you need— probably along with a bunch that you don’t need—the next step is to send it to a network packet broker (NPB). This device provides granular filtering capability to maximize the flow of relevant information to your monitoring tools. Specific types of data can be segmented out and sent to specific tools to improve efficiency and faster time to resolution. NPBs can provide the following services as well: data aggregation, deduplication and load balancing of Layer 2 through 4 (of the OSI model) packet data.

    Application intelligence is another capability available through an NPB. This functionality provides additional filtering and analysis at the application layer, i.e. Layer 7 of the OSI stack. For instance, you can leverage application intelligence to prevent application bandwidth overloads on your network. You can literally see the amount of traffic on your network based upon application type (e.g. Hulu, Netflix, Pandora, FTP, HTTP, RTP, etc.). You also can use it to identify slow or underperforming applications.

    The final layer of the visibility architecture is made up of your security and monitoring tools. These devices typically are special-purpose tools (e.g., sniffer, network performance monitoring [NPM], application performance monitoring [APM], etc.) that are designed to analyze specific data. For instance, APM tools can provide real-time data analytics to help you manage your network and lets you see problems before your users do.

    However, standalone deployments of these tools can run into different problems, such as overloaded disk space and processing, the need for different interface ports based upon network traffic speed and the need for lots of input ports to capture data across the network. An NPB can be used to capture network data and filter that data before it goes to the NPM tool. This increases the efficiency of the tool by reducing clutter. The additional filtering of duplicate data further enhances the efficiency and also removes the storage waste associated with storing irrelevant data.

    Network administrators need network visibility solutions to help them discover, isolate and solve problems related to the network and its applications. This architecture gives your network tools a complete picture of the network so they can resolve issues faster.

    — Keith Bromley

  • Cloud Performance Management Needs Precedence Over APM in a Cloud World

    Cloud Performance Management Needs Precedence Over APM in a Cloud World

    A majority of today’s businesses follow a cloud-first strategy. DevOps engineers with these businesses prefer using infrastructure as a service (IaaS), platform as a service (PaaS) or cloud services from leading cloud services providers (CSPs). Given the rate at which the IT is evolving now, from on-prem to XaaS, the future seems a lot more promising for Dev and Ops of an application.

    But while the IT has evolved, have the monitoring and management tools evolved along these lines, too? Many DevOps engineers still use the good-old application performance monitoring (APM) tools for measuring the performance of apps and for debugging issues.

    This article deliberates on shifting the focus from application performance management (APM) to cloud performance management (CPM).

    APM is Good,  Infra-Centric APM is better, CPM is the Best

    Use of cloud services is a norm in DevOps today. On the one hand, these services act as building blocks for developing or running application(s) and contribute heavily to the performance of that application. On the other hand, they bring with them several layers of idiosyncratic abstraction layers. To top it, new cloud services or SaaS occasionally introduce new trends.

    The monitoring and management market has yet to catch up with the pace at which IT is evolving. There are only a handful of cloud monitoring tools available in the market, and they provide siloed reports and dashboards. Result: DevOps engineers are still stuck with good-old APM tools.

    APM tools are good at offering insights. However, these insights are just enough to understand what’s happening in the application tier.

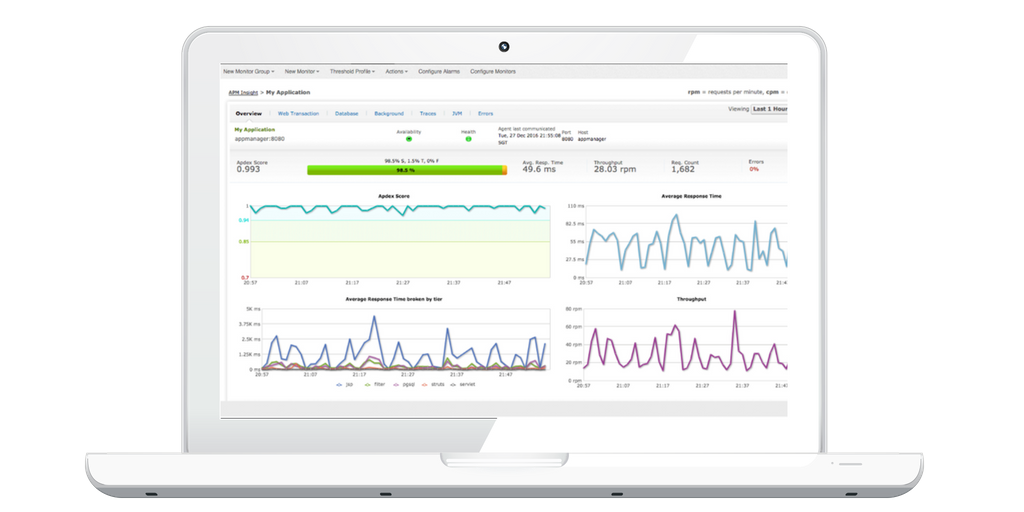
    If you observe the above APM dashboard, there’s the summary of server status and app throughput, response time and more beautifully packaged with visualization graphs. If there’s a need, one can even get information on CPU usage, memory usage, disk usage details, etc.

    Then there are infra-centric APM tools that go one level beneath the app tier to provide information on network statistics, such as bandwidth or opened ports. However, none of the tools provide complete contextual information. Day in and day out, a DevOps engineer must dabble with several dashboards.

    Let’s take a look at a very simple scenario. Assume there is an image processing web application leveraging AWS cloud services such as EC2, S3 bucket for storage and SQS for queuing:

    From the APM tool, you can continuously monitor the application for response time, then app servers for metrics such as throughput (with <=10 images), CPU utilization, etc. Everything looks fine on the top while the pipeline is moving smoothly.

    Then one day, the number of users using the app at a particular time increases and the jobs start queuing up quickly on SQS, and the response time of the application suddenly goes low. However, the performance of all the servers seems fine on the APM tool.

    In such a scenario, how do you debug the root cause that is affecting the response time without having a monitoring tool that is watching the AWS SQS?

    Of course, AWS provides its own console to monitor its services. If the DevOps engineer is aware of the root cause, debugging is a child’s play. However, when the underlying issue is unknown, it leads to dependency on several tools, which can unearth facts for them.

    When a business’ application or applications are dependent on several cloud services that do not have a monitoring tool yet, how can an APM tool, which can pull only specific data, help provide complete visibility?

    In this cloud-driven world, a developer needs to be aware of how their application interacts with different tech stacks, and how that interaction drives performance, availability and cost.

    Unified CPM Complements APM Bringing the Complete Context

    The industry has traditionally separated the performance management of applications and infrastructure, resulting in multiple toolsets in each of these domains.Neither APM nor IPM alone will successfully address and solve shift-left monitoring requirements.

    APM focuses only on the application tier providing visibility into just part way down the tech stack. If you are a DevOps engineer with an enterprise or an SMB looking into different customer applications, you know it is difficult to make sense of all the resource usage across availability zones and make a case of each application’s cost/performance trade-off, ability to scale, time-to-market, etc. While the cloud services make it easier for development, each service has its own learning curve and abstraction.

    A unified CPM tool thrusts the context up to the shore of APM, in a tech stack. Developers need such tools where they can monitor all the services and get end-to-end visibility from a single pane of glass.

    Conclusion

    Analyzing performance of each dynamic service in context with other dynamic players (services) in the tech stacks will quickly provide the right context and help detect an underlying problem easily—especially, in cases where the problem lies with the cloud resources rather than the application code itself.

    — Pradeep Kumar

  • Choosing the Right Monitoring Tools for a Full-Stack Solution

    Choosing the Right Monitoring Tools for a Full-Stack Solution

    According to the marketsandmarkets report on APM tools, the monitoring tools market is expected to grow to $4.98 billion by 2019, at a CAGR of 12.86 percent and the DevOps market would attain market size of $8,763.8 million by 2023, growing at a CAGR of 18 percent during 2017 -2023 (source: markets business insider), with more focus on monitoring and performance management, delivery and operations management, lifecycle management, analytics and other solutions.

    Selection Criteria for Full Stack Monitoring Tools

    With the amount of DevOps tools and new tools coming up in the market, it is highly essential to choose the right tool for the right need before investing in it and expecting the desired outcomes. One has to make several considerations and analysis in choosing the right tool for the need. The monitoring tool you select should be capable of doing full stack end-to-end monitoring and should enable faster troubleshooting and quick remediation.

    Following are some of the key criteria that can be used as factors for the monitoring tools analysis.

    Monitoring Features

    The mix of platforms, operating systems, devices and applications can be extremely diverse in the enterprise, which needs monitoring of infrastructure, platforms, cloud environments, application performance, network monitoring, orchestrations, containers, databases, end user monitoring, covering heterogeneous workloads and its performance. Check out what features are supported in the monitoring tools which suits the need.

    Infrastructure Monitoring

    The infrastructure monitoring tools should measure response time, availability, uptime, CPU usage, memory usage, disk usage, process level usage and load of the servers, components, storage, databases, virtual systems, network switches, security, user permissions, performance and throughput on the application and web servers, DB level queries and DB transactions, latency, transfer rate, connection time of databases, and provide time series data of the measurements, aggregation of data with process level drill down and history of trends. Tools that can do infrastructure monitoring should be able to provide most of the above mentioned measurements.

    Network Monitoring

    Network monitoring tools should provide performance metrics such as bandwidth, latency, responsiveness, different port level metrics, network packets flow, CPU usage of hosts and provide custom metrics and aggregation of these metrics. Network monitoring tools need a comprehensive platform that works across varied network topology (heterogeneous networks (wired/wireless), cloud-based networks and software defined networks). Choose the tools that are capable of auto discovery of nodes, devices, routers, firewall rules, ports and protocols, automatic rules, thresholds and alerts, and which are application-aware, that can detect the applications, services in the network with network path, network flow analysis and provide graphs/tables about network status to determine if the performance problem arises from network or application itself, and can generate network topology map.

    Containers Monitoring

    Monitoring containers/micro services include capturing container level states on CPU usage, memory, network, disk usage, processes running inside the containers, as well as usage of containers hosts, container level logs, containers running/stopped, orchestration level metrics on pods states, cluster stats, container networks, application endpoints at container level, pod level, and system level, performance metrics at container levels as well as services running in it, etc. Containers run in clusters and monitoring ephemeral container workloads are necessary in production; choose tools that provide the above capabilities for container monitoring beyond the out-of-box monitoring data provided by the container orchestrators.

    Application Performance Monitoring

    Application performance monitoring is a key component in full-stack monitoring, where logs are collected and centralized with profiling and tracing available on the application and its dependencies, provides measurements on performance such as end user response time, availability, throughput, error rate, page loads, slow pages, error occurrences, any third-party JavaScript slowness, browser speed, track SLAs, page bloats, distribution of customer base across geographical areas, checks for end user transactions and simulate end user actions with synthetic transactions and provide detailed drill down and correlation data from end user experience, providing full visibility across the application stack. Choose APM tools that cover the profiling, tracing, end user experience monitoring, log monitoring and log analytics, providing data correlation with drill-down capability on transactions and full-stack visibility, at a minimum.

    Cloud Monitoring

    Cloud providers offer monitoring capabilities for the workloads running in their cloud environment providing log trails, performance metrics, network level metrics, in-depth visibility of application components, measurements on microservices, PaaS services, and also offers storage and analysis on instrumentation data. The tools choice can depend on the support for interoperability and integration to multiple cloud providers, exchange of data between different databases/storages, perform transformation/enrichment of data and that which provides visualization of data with correlation and business insights from end user experience perspective with drill down approach and performs auto-remediation, auto-discovery, baseline and predict metrics.

    Deployment Model and Pricing

    Monitoring tools are available in on-premises, SAAS cloud-based deployment models, open source/commercial versions and, depending on the complexity in configuring the tools, maintenance and the support needed, appropriate deployment model and pricing/licensing needs, an appropriate tool can be chosen; however there seems to be increasing trend in the usage of SaaS-based monitoring tools.

    Agent-based/Agentless Approach of Monitoring

    Monitoring tools collect the data from the servers and applications using agent-based/agentless, push- or pull-based approach. The collectors can act as metrics/log shippers, which push the data to the centralized server for storage and processing. Agent-based approach may involve deploying the monitoring agents in the machines considered for monitoring and this can be deployed to the target machines, through configuration management tools/infra automation scripts such as Chef, Puppet or Ansible.  Tools may support auto discovery of machines, which can register itself as the client machine for monitoring. Agent-based monitoring can help monitoring the fellow agents as well. Choose the tool that suits the needs and the effort needed in maintaining the agent-based monitoring tools.

    Alerting

    Notifications set up on the predefined thresholds and rules are a must-have for monitoring tools. Tool should provide capability to send mails and web hooks, integrate to collaboration/ChatOps tools such as Slack or Hipchat and provide the ability to define custom thresholds and run batch alerts at intervals.

    Dashboards 

    Monitoring data and metrics can be used for decision-making and stakeholders’ buy-in, for which centralized end-to-end dashboards on metrics of different sources and components are needed. Many commercial tools provide aggregated as well as detailed correlation information and segregated data of applications under monitoring. The tools must provide out-of-the-box dashboard capability and capable to add/update new dashboards views and create graphs, create custom queries depending on the need.

    Customizability

    Many monitoring tools may provide the features for monitoring different workloads, but determining whether the tools provide customizations on defining custom metrics, custom dashboards, custom checks and plugins, community support on extending the tools features, customizable workflows, customizing thresholds and rules and the ability to write customized queries can influence your choice of tools for monitoring.

    Extensibility

    Despite performing monitoring, things may break; hence, monitoring tools should have extensibility to the collaboration tools which can alert through the proper channel to the team to act upon. Integration with ticket-based controls and incident management workflows, auto-ticketing mechanisms, auto-remediation tools and REST API support are some of the key items to look for when evaluating the monitoring tools.

    Production Grade

    Determine how the monitoring tools can perform in the given load and the support for production cluster setup. The tool should be capable of responding within the defined seconds, for the defined set of servers and time interval and store time series data collected from different sources (servers, devices, applications, etc.) and check whether the monitoring tool can scale up depending on the load. Scalability, performance can largely influence the decision of selecting the monitoring tools.

    Analytics – AIOps

    Commercial monitoring tools provide capability of running machine learning techniques, which can perform anomaly detection in the data, help predict the capacity and demand and maintain inventory based on the metrics. Depending on the advanced use cases the business demands, choose the tools which can provide these capabilities that can accelerate the IT operations maturity level.

    Ticketing and Incident Remediation

    Despite deep monitoring, defects may leak and SRE teams may have to triage and resolve the issues. Autoticketing and autoremediation workflows can be defined in the ITSM tools, which can integrate with the monitoring tools and trigger the remediation workflows based on the alerts defined and notify the SRE teams through different channels. Choose monitoring tools that can be easily integrated with the ITSM tools and provides out-of-box or options to develop custom workflows without much complexity, to achieve use cases such as auto-ticketing based on threshold alerts in monitoring and autoremediation.

    Conclusion

    When choosing the full-stack monitoring tools, choose the tools that offer monitoring capabilities for varied workloads including containers, IoT and comprehensive platform with user interface and integrated dashboards, along with integration and interoperability between the IT operations tools, ITSM tools and AIOps tools, which provide event correlation and analytics Choosing the tools that are right-sized and address the skillset, technology needs, pricing and deployment models, with a focus on must-have features, will enable SRE teams to triage and remediate the issues faster.

    — Lavanya Subbarayalu

  • What to Consider in a Full-Stack Monitoring Solution

    What to Consider in a Full-Stack Monitoring Solution

    In the DevOps space, there are various tools available for monitoring. When building a full-stack monitoring solution, however, selecting the right monitoring tools and designing monitoring based on IT operations’ needs is a critical decision.

    Design Considerations for Implementing a Full-Stack Monitoring Solution

    The following are some of the key design considerations while implementing full-stack monitoring:

    Distributed Monitoring

    Consider choosing the topology that is best-suited to the monitoring needs of the applications. For example, small teams with fewer applications to monitor can choose to implement monitoring tools in a single-server standalone topology, while large IT operations teams with many different monitoring applications can choose a distributed architecture in which the master nodes contain metadata of the monitoring tool, while monitoring and slave nodes are centralized and act as the data collectors and data nodes, then connected together as a centralized monitoring system. Monitoring tools clusters should contain a minimum recommended master nodes and data nodes for high availability. If a network outage occurs, monitoring systems may not be able to detect the underlying problems; however, with distributed slaves, if one slave is offline, a new slave node can be added to the cluster, which performs checks and writes the results back to the data nodes. Choose on-premises or SAAS-based monitoring tools depending on your workloads (cloud/on-premises). Pricing also varies and should be considered.

    Availability

    Site reliability engineering (SRE) teams focus on the reliability, uptime and availability of the applications and thus monitor continuously to identify any potential risks/outages. This mandates that the monitoring tools to be up and running all the time. Most monitoring systems are set up in the same network they monitor, and if a network outage occurs, the monitoring system can’t monitor for security threats. Thus, monitoring tools must be configured inside a high-availability cluster, with availability zones and geo-redundancy regions for availability, backup and disaster recovery.

    Scalability

    It is common to have multiple monitoring systems to monitor multiple locations or data centers with thousands of hosts. Data from each host is collected multiple times daily, which can result in huge load and performance hits. In a distributed monitoring system with slaves distributed, data checks can be performed locally in the data center, the data can be processed and slaves can then send the results to the master. Based on the load, the hardware CPU cores can be utilized to run multiple checks in different threads or slaves can be added to the cluster for scalability and redundancy.

    Storage

    Monitoring systems collect and use data from several workloads for various monitoring needs. This results in continuous monitoring, which generates volumes of data accumulation and can result in slow performance of the monitoring tools to analyze the data, demanding high storage needs to store the data and impacting faster troubleshooting. Monitoring systems use databases that are document-based or time series-based. Time series-based databases can store data with time as points, and modern monitoring systems offer plugins to collect data from various sources and provide a built-in schema of the metrics to be stored to the database. Consider customizing the plugins depending on the metrics needed to be stored, as well as aggregation of data based on the granularity and the necessary data storage timeframe. Data can be aggregated and stored in weekly or monthly tables in the database to minimize the overhead of maintenance cost of the monitoring tools. Configure retention and backup policies to retain the aggregate data for machine learning and anomaly pattern detections.

    Performance

    Performance of the monitoring tools should be tested, given the size and capacity of the master and slave monitoring nodes and the number of hosts to be monitored. Performing various checks in the hosts and then returning data to the server nodes involves lot of processing with high compute needs. Use queues or a transport mechanism to manage the data transfer from the clients to monitoring systems to avoid data loss due to network outage or latency. Most monitoring systems offer a built-in or support a queuing mechanism that performs retries to read/write operations in case of data loss. The slave agent nodes can improve the performance of the monitoring systems by performing data enrichment and data transformation locally, then forwarding the results to the master agents for better and faster reporting. Decide the time intervals you need to monitor the data based on the SLOs defined to optimize the performance of monitoring tool. Monitoring systems can use agent-based or agentless monitoring approaches: In an agent-based system, the data is collected using binaries installed in each host to be monitored, while an agentless monitoring system uses a pull-based approach to collect data from individual hosts. When using an agent-based approach, consider the memory footprint of the agent installation: Use optimized queries for search capabilities/indexes on the primary fields and aggregations in the monitoring system database to improve performance of the data retrieval, graphing and reporting.

    Security

    Configure security with permissions in the monitoring systems. The slave nodes/master systems should communicate securely with each other and access the endpoints and various ports of different processes for performing checks. Configure security at all levels of applications, different components, middleware software and firewalls to allow access to the ports and processes the monitoring systems need to access and monitor. Limit the security access to the defined stakeholders as per the need and administrator permissions to configure the monitoring tools for policies, thresholds, integration with other tools, managing users, backup, retention and other factors.

    Automation

    Because monitoring systems use either agent-based or agentless monitoring modes to collect data, agent binaries or plugins must be installed in every host to be monitored, which can be a tedious and time-consuming task. While a few of the monitoring tools can perform auto-discovery of the hosts and the agent’s binaries, custom configurations can be pushed to the hosts through configuration management tools and configured automatically to perform the checks and forward the instrumentation to the centralized monitoring system. The infrastructure scripts for the monitoring systems need to be version-controlled, and scheduled jobs and maintenance activities—such as cleanup of old data and running enabling batch scripts on the monitoring data to trigger remediate actions—can be deployed using configuration management and CI tools, reducing much of manual effort and maintenance costs. Configuring the monitoring of provisioning, de-provisioning and use of resources can be done through automation scripts in the monitoring tools.

    Testing the Monitoring tools

    Test your monitoring tools as you would any other application. Create test cases to test the configurations used for various checks; test whether right data has been reported from the right host with appropriate labels and tags; check the endpoints and the policies configured; test the latency/data transfer between the agents and master nodes; test whether the data correlation provided, if any, are giving the accurate information with time-bound; test to ensure the dashboards, alerts and visualization graphs are reporting proper data; as well as any machine learning and remediation scripts functional testing. Configure test environments to install monitoring tools in the staging environments to test the behavior, performance and the accuracy of the monitoring data before moving to production environments.

    Choosing Metrics to Set Up

    Metrics provides insights into the system behavior and choosing metrics that are not relevant can add more overhead and poor monitoring. Choose the metrics that provides the health of the overall platform such as throughput, latency and error metrics that can give insights of erroneous results from several sources, success metrics and performance metrics. Configure metrics for individual resources that measure utilization, saturation, errors, availability, performance such as response times, disk/CPU/memory usage, packets inflow/outflow, etc. Choose metrics to configure based on the events logs, such as scaling up/down hosts, containers up/stopped, build or deployment failures, profiling and stack traces, which can provide data correlation, and configure the metrics to enable drill-down from the work-level metrics to resource-level metrics to the event-level metrics, with required granularity and tagged to the scope of the resource. For an efficient full-stack monitoring, configure all the types of metrics to enable faster troubleshooting.

    Defining SLOs

    SRE teams focus more on the uptime, reliability and availability of an application and many factors can impact the reliability. Most commonly, application design can impact the performance of the application. The service-level objectives (SLOs) have to be designed with the desired objective and setting up target for the objective, with a clear definition of how the objective is measured and the conditions under which they are valid. Configure SLOs related to performance and availability that can be measured within the SLA with defined error budgets, and standardize the service-level indicators that can be created as templates for reuse across multiple projects.

    Designing Alerts

    Monitoring systems should know what to monitor, how to alert and what channels to use to communicate the alerts. Alerts can be defined on various criteria such as monitoring the potential issues/events and alert them before they occur (host, disk, memory, CPU metrics); monitoring the expected system behavior and key user actions for green status and alerting if the system behavior deviates monitoring the critical resources and components of the application and its impacts that affect various other parts of the applications and alert if the resources fail. Alerting also could be based on black-box monitoring, in which the alerts are configured based on externally visible factors and real users’ impact, or based on white-box monitoring. Check historic values and remediation actions in the past to determine the threshold values and the priority levels, where high-priority alerts can be sent as pages to on-call engineers and low/medium priority alerts are sent as secondary notifications. The alerts should be designed to provide contextual information such as links to appropriate graphs/logs/attachments that can contain deep information about the events occurred along with correlations. Identify the right team to receive the alerts and the communication channel that best suits the engineers in on-call rotations and responders with escalation plans and mitigation plans. Configure the frequency and the priority level of the alert based on the use cases. Striking balance between low-alerting and overalerting is important and alerting needs to be continuously improved and fine-tuned to avoid false-positive alerts.

    Visualization and Dashboards

    Metrics are collected and stored as time-series data, wherein data can be best represented as a graph with time on the x-axis and one can notice the value changes over time. Configure graphs and dashboards to provide a holistic view of different components that can be visualized over various time scales to understand long time trends as well as recent changes that might be affecting the systems currently. Configure generalized dashboards to visualize the current health metrics as on-screen displays and focused dashboards to drill down with contextual information that can be used for troubleshooting and specific use cases such as capacity planning.

    Incident Remediation

    Designing a well-defined incident remediation process involves integrating monitoring system alerts to create an auto-ticket in the IT service management (ITSM) tools and posting which incident/problem management workflow must be triggered. Identify the potential use cases for auto-remediation, in which a reliable source can identify the potential problem and get the same responses without any manual input for decision-making. For example, a workflow can be designed to integrate with knowledge base to check for known issues and from known components or sources to validate the issue and run auto-remediation actions and notifications bound with SLAs. Extending monitoring systems for auto-ticketing, auto-investigation, auto-remediation and auto-notification through multiple communication channels to the on-call engineers will accelerate full-stack monitoring.

    Machine Learning Analytics

    With volumes of data being generated and stored in monitoring systems, consider machine learning techniques such as predictive machine learning, in which algorithms learn how system behaves normally, provides a resulting model of normal behavior and predicts a range of observation points that lie outside the range that are marked as anomaly in the data, which can be used for capacity planning use cases. Design test cases for testing the machine learning algorithms to avoid any false-positives that incorrectly identify anomalies or result in malicious events going unnoticed as normal behavior.

    Understanding the needs of monitoring in your environment and then choosing the right tools, and implementing them with various design considerations in place, with continuous monitoring and optimizing further, can accelerate SRE (IT operations) teams to achieve full-stack monitoring.

    — Lavanya Subbarayalu

  • Benefits and Drivers of Full-Stack Monitoring

    Benefits and Drivers of Full-Stack Monitoring

    As organizations undergo digital transformations, there is increasing need to modernize the way IT operations is managed and to deliver applications faster, while at the same time delivering business value by managing applications’ availability, performance and outages in a cost-effective way.

    Because outages have a huge impact on revenue, there is a growing demand for site reliability people and monitoring systems, which can enable them to handle applications’ uptime, performance and reliability with a proactive and predictive monitoring approach.

    This article series focuses on the need for full-stack monitoring in today’s digital operations, the considerations for selection of monitoring tools and design considerations for implementing a full-stack monitoring solution.

    Why is Full-Stack Monitoring Necessary?

    Full-stack monitoring refers to the capability of monitoring all of the following:

    1. Infrastructure monitoring—Monitor servers, network, containers, cluster orchestrators, cloud, middleware, app servers, web servers and databases.
    2. Application performance monitoring—Perform log monitoring and analytics, synthetic transactions, sql transactions, data correlation with metrics and logs, end user experience monitoring, profiling and transaction-level tracing with code-level visibility.
    3. Performing end-end monitoring across the workloads in on-premises/cloud/hybrid environments through a centralized dashboard/visibility across the stack.
    4. Provide alerts, analyze, act and remediate the incidents faster, using the instrumentation data leveraging IT service management (ITSM), ChatOps and collaboration tools along with monitoring tools.
    5. Perform Analytics on the data being used to derive insights and predict demands.

    The following are some of the needs driving enterprises to implement full-stack monitoring:

    • Business agility: Business needs to deploy very frequently to sustain the market demands
    • Application reliability: Site/application platform is expected to be reliable, available and scalable, as outages impact revenue and may result in losing business and customers.
    • Bandwidth bottlenecks can impact the application performance, leading to potential business loss and needs network-level deep monitoring.
    • Failure can happen at any level and go unnoticed, leading to overhead in recovery and remediation; hence, monitoring from various sources and at different angles with varied levels are needed.
    • Application complexity and dependencies: Applications use multiple-third party components, multiple hosts and several underlying services, components and infrastructure. If any of these do not function as expected, it can degrade an application’s performance and result in issues/defects going unnoticed—and often reported by end users.
    • Cloud born applications, which are multi-tiered and multi-layered, use mix workloads (PaaS + IaaS) and monitoring of different sources/workloads has to be done for distributed hybrid environments (multi-cloud).
    • Use of virtualization and container technologies, which have enabled environments with dynamic and ephemeral states and such workloads, need monitoring at the orchestration and container levels.
    • Lack of end-to end monitoring tools and lack of visibility across all IT assets and workloads, which has increased the need of centralized monitoring data. The SRE teams need to get stakeholders’ buy-in based on the monitoring data to push back on the bad releases and take calculated risks. They also need to cater different types of monitoring data to different stakeholders and line of business (LOB) owners and overcome cultural challenges to get stakeholders’ buy-in.
    • IT operations needs to forecast an application’s behavior, capacity and performance, based on how the system performs in the given conditions. Machine learning of monitoring data and patterns can help predict capacity and anomaly.
    • Large volumes of data are collected from multiple sources giving out metrics, logs, etc., for various components of the stack. The IT operations team needs in-depth information about the components and dependencies along with metrics to provide contextual/correlation information. They need to correlate the data to determine symptoms and causes for faster troubleshooting. As such, they need monitoring tools that can provide correlation out-of-box to reduce the effort involved in triaging.
    • Configuration changes: Deployment of application/infrastructure/services are done through infrastructure as code automation scripts, which may contain issues in configuration. Lack of testing infrastructure, services and application end to end can increase the number of issues to be resolved; hence, there is a need of monitoring right from provisioning of resources, usage, maintenance and de-provisioning of resources.
    • Lack of end user perspective and business metrics from traditional tools, coupled with the need to eliminate toil and perform faster triaging/post-mortem and automated incident resolution, demands use of new-age full-stack monitoring tools.

    Growing business demands and agility, application reliability, deriving business insights and end user experience analytics are the key drivers for implementing full-stack monitoring. Hence, the IT operations traditional approaches are rapidly being transformed to digital operations (SRE operations), along with DevOps practices being widely adopted across enterprises.

    In the second and third articles in this three-part series, we’ll look at the considerations for selection of monitoring tools and design considerations for implementing a full-stack monitoring solution.

    — Lavanya Subbarayalu

  • Splunk Acquires VictorOps: The End of the Road for Standalone IT Alert Management Tools?

    Splunk Acquires VictorOps: The End of the Road for Standalone IT Alert Management Tools?

    This week, Splunk, the leader in machine data intelligence, announced the acquisition of IT alerting solution VictorOps for $120 million. My congratulations to the VictorOps team for building a solid product for alert management and collaboration, demonstrating a wicked sense of humor and creating some cool T-shirts.

    While the acquisition makes sense on many levels, it does raise broader questions about the need for standalone IT alerting tools. Let me explain why IT alert management as a category faces strong headwinds and how these tools will need to evolve if they are going to remain relevant in a world driven by digital transformation.

    What Do IT Alert Management Tools Actually Do?

    When an IT outage or service disruption occurs in an enterprise, the first order of business is to restore operations back to normal. IT outages can cost you a lot (an hour of downtime can cost you upwards of $100,000 per hour), disrupt your customer experiences and derail employee productivity. To quickly troubleshoot an IT incident, you’ll need to notify the right subject matter experts who can collaborate together to pinpoint root cause for an outage.

    Every day, enterprise network operations center (NOC) teams receive hundreds of alerts from different IT management tools for monitoring, service desk, event correlation and configuration management. A certain percentage of these alerts demand urgent attention from NOC teams who are on-call and readily available for incident support.

    Enter IT alert management tools, whose job it is to manage the notification of messages to personnel based on predefined rules regarding who to notify for a given categorization of event or incident. Tools from PagerDuty, VictorOps, xMatters, OpsGenie and Everbridge alert the right team members using on-call schedules and notify them using a variety of channels including email, text, voicemail and chat. IT alerting tools help you manage the entire incident life cycle, using on-call schedules, alert routing rules and collaborative war rooms.

    Embedded Alert Context: The Missing Piece of the Alert Puzzle

    The fundamental challenge with scaling enterprise alert management is about establishing the right context for a flood of alerts that you’ve just received. Instead of forwarding every single alert that you receive, can you share actionable alerts that your NOC teams can immediately act upon?

    Your IT alerting tool needs the ability to correlate a bunch of alerts into a single event for faster acknowledgment and troubleshooting. Alert consolidation and correlation call for intelligence that can extract signal from the noise and compress alert volumes with the right inferences. Artificial intelligence for IT operations (AIOps) helps you do just that, by applying big data and machine learning techniques to event management data. With AIOps tools, you can handle events and minimize alert noise by delivering timely and actionable insights for incident support. This agility and insight, coupled with intelligent correlation to stay on top of major outages, helps NOC teams by focusing their attention on the incidents that truly matter.

    AIOps + Alert Management = Smarter Incident Management

    Without the ability to apply machine learning algorithms to alert floods, alert management tools act as “dumb forwarders” of IT alerts, inducing alert fatigue and adding to the overall noise. It’s time for alert management to get smarter and contextual with machine learning insights.

    Splunk’s acquisition of VictorOps is a clear sign that alert management tools as a standalone category can’t truly scale without a solid AIOps foundation. With artificial intelligence, IT teams can stop wasting valuable time figuring out incident triage and root cause analysis and ensure faster recovery from crippling outages with the right event analytics.

    — Deepak Jannu

  • Riverbed Throws Down APM Gauntlet

    Riverbed Throws Down APM Gauntlet

    Riverbed Technology has expanded its approach to unifying application performance management (APM) and user monitoring based on a new architecture for its SteelCentral platform, now capable of supporting tens of thousands of agents monitoring billions of transactions per day.

    Nik Koutsoukos, vice president of product marketing and product management for Riverbed, said auto-tuning and data compression mechanisms combined with cluster architecture now makes it possible to analyze all the data in the enterprise to determine precisely where bottlenecks are adversely affecting user experience.

    In contrast, rival APM offerings only sample transactions and sacrifice metadata as well as depth in terms of being able to delve into a complete stack of software and associated IT infrastructure, he said.

    Koutsoukos noted the way APM is being applied will fundamentally change as organizations embrace digital processes. Most organizations today apply APM sparingly across a limited number of mission-critical applications. But as business processes become digitized, customer satisfaction increasingly will be determined by the quality of the application experience. That can’t be accurately determined without being able to leverage a set of software-as-a-service (SaaS) applications capable of monitoring the entire IT environment, he said.

    Riverbed, with this release of SteelCentral, is also adding analytics infused with artificial intelligence capabilities, as well as machine learning and predictive analytics to keep track of transaction trends over time. This release introduces a “Prism” report that analyzes longitudinally at the conversion funnel for a business transaction flow to visualize trends over time, spot issues and then resolve associated problems.

    In addition, Riverbed is adding support for Riverbed Xirrus Wi-Fi access points, which the company acquired last year, to the SteelCentral platform.

    Industry research suggest that only 5 percent of enterprise applications are actively monitored, Koutsoukos noted, but Riverbed is expecting that to change in a digital age where IT essentially has become the business. More senior business executives are soon going to be equating application performance with customer engagement and, by extension, opportunities to generate revenue.

    Riverbed expects that monitoring all those distributed applications and associated IT infrastructure will be possible only by using a set of software-as-a-service applications, which Koutsoukos said in many cases will pay for itself by eliminating the need for various application and infrastructure monitoring tools in silos across the enterprise.

    Given the relative light adoption of APM tools, the rise of digital business may provide an unexpected benefit for DevOps teams. As line-of-business managers demand more insight into the IT environment, the amount of metrics that should become available to DevOps teams should correspondingly increase. The challenge may lie in educating business managers why those metrics are relevant to them and then getting them to fund their acquisition.

    In the meantime, DevOps teams should be prepared for a lot more questions relating to application performance coming from business managers. Not every one of those questions might be all that informed. But over time, an educated business executive always makes for the best DevOps customer.

    — Mike Vizard

  • How APM Benefits DevOps

    How APM Benefits DevOps

    Thanks to the efforts of DevOps teams, rapid application and feature development are increasing the pace of innovation and having an increasing impact on business revenue. Top-performing DevOps teams are key contributors to year-over-year revenue growth of 25 percent or more, according to Enterprise Management Associates (EMA), thus increasing the value of IT. Application performance monitoring (APM), when used throughout the development life cycle, is a significant contributor to the success of these top-performing DevOps organizations.

    APM: Not Just for Production Anymore

    Frequent application changes, virtual environments, complex infrastructures, distributed data and cloud services are making production apps more difficult to support. We all know that it is cheaper to catch and fix bugs and performance problems earlier in the development process. Yet, 70 percent of organizations still use a collection of disconnected, manual troubleshooting processes, and they rank this manual troubleshooting as the single biggest bottleneck in their continuous delivery pipeline. According to EMA research, “APM solutions can substantially mitigate the challenges generated by high rates of production change.”

    Say, for example, a piece of code is running slowly during development or QA. The assumption that it’s the code’s fault triggers a rewriting process that doesn’t ultimately solve the problem, delays feature delivery and may introduce new issues. Details available from APM show that an underlying dependency, such as the Java Virtual Machine, is becoming saturated by a completely different process—details that are very difficult to correlate with silo-based tools and manual processes.

    There is a saying that you can’t manage what you don’t measure. While many organizations use APM to measure the performance of production environments, shifting application performance monitoring left into the development environment enhances application performance and stability. Using APM throughout the development life cycle helps teams track down elusive performance problems, enabling earlier debugging of performance bottlenecks, higher confidence of achieving production SLAs and enhanced insight into feature adoption.

    Earlier Debugging of Bottlenecks

    Using multiple, domain-specific performance monitoring tools ends up trapping critical information in different silos. Consequently, troubleshooting potential issues is very resource-intensive, requiring experts from multiple domains to analyze the outputs and correlate the results into something actionable. Developers are pulled into production troubleshooting more often, slowing the pace of innovation and delivery. Mean times to repair get longer and longer, impacting SLAs and overall user experience.

    Testing application performance during development, using the same tools that monitor the production application, helps identify bugs and bottlenecks when they are cheaper and easier to fix. Analytic features trace transactions from user to back-end, detecting potential load problems. Real-time, code-level diagnostics understand dependencies and watch all components, including containers and microservices, exposing code, SQL, networks, system resources and web services to detailed evaluations. Barriers between silos become transparent, improving communications and reducing time to resolution of issues that cross team or department boundaries.

    Higher Confidence of Achieving SLAs in Production

    Performing QA tests with unintegrated legacy tools is still a common practice in many organizations. These tools are often tied to physical concepts such as servers and networks, not the highly transient and virtualized production environment of clouds, services and VPNs. As a result, teams struggle to get a clear picture of potential issues under real-world conditions. Developers again get pulled into production troubleshooting, working to reconcile development and QA data and results with the production APM system.

    Including application performance monitoring during automated load testing gives DevOps a better prediction of code behavior in production. Performance analytics that cross all infrastructure components quickly validate the desired production SLAs. REST APIs make it faster and easier to collect and analyze APM data, thereby improving collaboration between teams during troubleshooting. Some APM tools can automate the correlation of logs to application activity, removing the need for manual correlation and speeding problem identification and resolution. Overall, instead of guessing at the relationship between testing and production performance, application performance monitoring provides better simulation of real-world conditions, improving confidence and reducing time to deployment.

    Enhanced Insight into Feature Adoption

    Deploying apps more often, with better performance and stability, only leads to enhanced digital experiences if customers like and use the new features. Users do not always behave as expected, even with thoroughly researched enhancements. Focusing on metrics such as availability and response time, while important, means missing out on useful information. Without understanding the details of end user adoption, IT is unable to quantify a new feature’s contribution to revenue, productivity, satisfaction and other valuable business objectives.

    Continuously monitoring user experience is essential to getting timely insights on usage trends, response times and overall user satisfaction. For instance, identifying high- and low-performing features or the most- and least-used capabilities enables better road map planning. For applications with a broad and global user base, segmenting by different groups or geographies can help pinpoint local problems (e.g., within a particular country or a subset of users), which helps DevOps teams fine-tune their apps in even the most distributed and challenging of environments. And by viewing detailed performance graphs of critical transactions, teams can quickly understand financial and productivity impacts, helping them prioritize open support tickets and application optimization efforts. Overall, user experience monitoring helps shift the DevOps team from a reactive to a proactive approach to ensuring performance.

    Managing the Digital Experience

    Customers and employees have high expectations of their digital experiences that must keep pace with their changing needs. DevOps practices help address these evolving customer expectations. But while frequent releases are great for the business, they are often hard on IT.

    To be successful, DevOps must strike a balance between velocity and stability. However, delivering the combination of innovation, performance, and availability is a significant challenge for IT. Puppet’s “2017 State of DevOps” report states that stability (mean time to recovery and change failure rates) varies significantly between top-performing and lower-performing organizations, and it is only getting worse. Increasingly complex environments, containers, microservices and other dynamic components are difficult to monitor with traditional performance monitoring techniques.

    The performance benefits enjoyed by the leading organizations are substantial. According to the Puppet report, these top-performing firms spend 22 percent less time on rework or unplanned work, deployments are 46 times more frequent, and mean times to repair 96 times faster. The inevitable result is faster innovation, better responsiveness to user issues and significantly higher customer satisfaction with the digital experience.

    Integrated application performance monitoring is an essential tool that enables collaboration across IT specialties, reducing or eliminating the finger pointing and other unproductive behaviors that show up all too often in organizations with operational silos. In addition, APM improves visibility across highly dynamic infrastructures, making it possible to quantify financial impact over time and across releases. Lastly, when issues do arise, APM can help rapidly troubleshoot complex issues in production, often before they negatively impact the business or user’s digital experience.

    Application performance monitoring in DevOps is the modern choice of innovative organizations that want to deliver the best digital experiences to their customers, without having to choose between speed and quality.

    — Steve Brar

  • Cognitive Analytics: ‘Operations Thinking’ for Development

    Cognitive Analytics: ‘Operations Thinking’ for Development

    In a recent blog post by my colleague Payal Chakravarty, “Synthetic Monitoring – the Start of the DevOps Monitoring Journey,” she discussed how developers, testers and operations staff all need to ensure their internet and intranet mobile applications and web applications are tested and operate successfully from different points of presence around the world.

    Continuing our five-part series on “Continuous Monitoring: The Role of DevOps and APM,” this blog post will talk about how analytics can help developers earlier in the DevOps life cycle think about the performance of their applications.

    Continuous monitoring is not just about detecting operational problems in production; it is about getting feedback and reassurance that code changes you’ve made have resulted in the intended operational behavior before you deploy to production.

    My career DNA is development. So I know, full well, how code changes can have unintended consequences.

    Remember the bad old days when development methodologies relied on a series of quality checks (code reviews, various types of tests and release validation) to catch unintended consequences? If caught at all, most operational degradations surfaced long after the offending code was submitted, because the types of validation designed to catch these problems occurred at the very end of the development life cycle, when a “stability test” was possible. These “banana skin” issues were caught late or not caught at all. Either way, clients were impacted (through release delays, increased costs or service degradation) and you were not happy.

    Continuous development was great for me, personally. It forced me to look at development in a whole new light and solve the “little and often” delivery problems. It was fun, but despite best efforts, one “banana skin” remained: the stability tests in the staging environment. Just like before, it could cause a late-breaking wobble in the delivery plan to production or, worse still, issues were missed altogether.

    I didn’t solve this problem well because I was still thinking like a developer—mainly because I don’t have the skills, time or the interest to think like Operations.

    If cognitive analytics are applied to operation problems, you don’t need to think like Operations to benefit from Operations thinking. Your solution automatically will learn what is normal for your application; it will set dynamic thresholds and it will proactively notify you when it becomes significantly anomalous. With cognitive solutions, you can enable operations (continuous monitoring) in staging and detect anomalies long before the stability test fails or before the application hits production! All you need to do is feed it the application metrics. The good news is, your buddies in operations can show you how to do it.

    I am a positive person, so I am going to use a positive development scenario:

    You have made a code change to improve the performance of your application. When the code is deployed into staging, the expected operational improvement should occur (for example, a response time metric should change for the better). If you are using cognitive solutions, this anomaly (new and unusual behavior) will be detected automatically and you will be informed.

    • You get the reassurance that your code changes are having the intended positive impact on the operation of the service in staging.
    • You can inform your Operations team that new, anomalous behavior will be seen and why this is actually a good thing.
    • Furthermore, since these changes are intentional and the solution is fully cognitive, it will learn the new “normal” over time and the anomaly will simply go away. You do not need to take any “Operations action” such as setting a new threshold level, etc.

    The reverse is true, too. If you did not expect a change in a response time metric, or any of the other operational metrics, this would surface quickly, in staging, well before a test (if it exists) catches it. You rapidly can investigate this and take the necessary action before the “banana skin” moment.

    Another type of “Operations thinking” that is easily enabled in staging is the ability to alert on patterns in log files.

    This feature looks for patterns in logs, in real time, as files are ingested. You create the alerts. You can include alerts for the type of symptoms Operations looks for (again, talk to your buddies—they are the experts) or better still, you know the symptoms of your application starting to fail (you have investigated and fixed enough bugs!). What if you could use congitive solutions to look for these patterns continuously and proactively send you an e-mail if one emerges? Wouldn’t that be good?

    Monitoring solutions have turned a corner. Before cognitive, monitoring solutions relied on Operations SMEs to carefully manage the environment. With cognitive solutions the SME is built-in, allowing developers to shift left “Operations thinking” into staging and focus on what they want to do and do best: code, code, code …

    Watch a replay of the recently hosted webinar, “Learn Why We Must Shift APM Left in the DevOps Lifecycle.”

    About the Author / Sinead Glynn

    bp

    Sinead Glynn is an offering manager for IBM’s IT Service Management portfolio within DevOps.
    Within the IT Service Management portfolio, she specializes in Operations Analytics offerings and the value they bring to both IT Operations and DevOps teams. In her 10+ years at IBM, Sinead has worked in both Development Management and Offering Management, covering both Network Performance Management and Operations Analytics-type solutions. Connect with Sinead on Twitter / LinkedIn.