Author: Pradeep Kumar

  • Cloud Performance Management Needs Precedence Over APM in a Cloud World

    Cloud Performance Management Needs Precedence Over APM in a Cloud World

    A majority of today’s businesses follow a cloud-first strategy. DevOps engineers with these businesses prefer using infrastructure as a service (IaaS), platform as a service (PaaS) or cloud services from leading cloud services providers (CSPs). Given the rate at which the IT is evolving now, from on-prem to XaaS, the future seems a lot more promising for Dev and Ops of an application.

    But while the IT has evolved, have the monitoring and management tools evolved along these lines, too? Many DevOps engineers still use the good-old application performance monitoring (APM) tools for measuring the performance of apps and for debugging issues.

    This article deliberates on shifting the focus from application performance management (APM) to cloud performance management (CPM).

    APM is Good,  Infra-Centric APM is better, CPM is the Best

    Use of cloud services is a norm in DevOps today. On the one hand, these services act as building blocks for developing or running application(s) and contribute heavily to the performance of that application. On the other hand, they bring with them several layers of idiosyncratic abstraction layers. To top it, new cloud services or SaaS occasionally introduce new trends.

    The monitoring and management market has yet to catch up with the pace at which IT is evolving. There are only a handful of cloud monitoring tools available in the market, and they provide siloed reports and dashboards. Result: DevOps engineers are still stuck with good-old APM tools.

    APM tools are good at offering insights. However, these insights are just enough to understand what’s happening in the application tier.
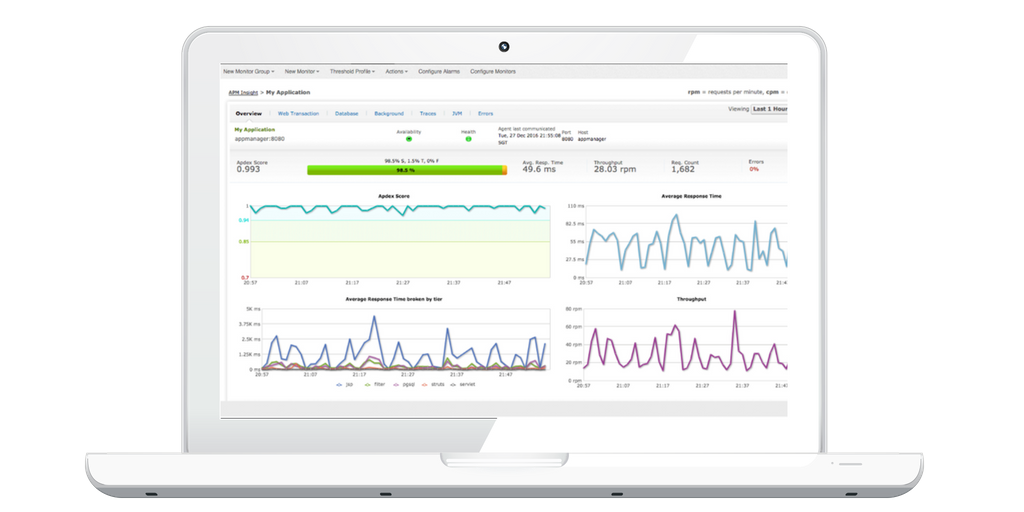
    If you observe the above APM dashboard, there’s the summary of server status and app throughput, response time and more beautifully packaged with visualization graphs. If there’s a need, one can even get information on CPU usage, memory usage, disk usage details, etc.

    Then there are infra-centric APM tools that go one level beneath the app tier to provide information on network statistics, such as bandwidth or opened ports. However, none of the tools provide complete contextual information. Day in and day out, a DevOps engineer must dabble with several dashboards.

    Let’s take a look at a very simple scenario. Assume there is an image processing web application leveraging AWS cloud services such as EC2, S3 bucket for storage and SQS for queuing:

    From the APM tool, you can continuously monitor the application for response time, then app servers for metrics such as throughput (with <=10 images), CPU utilization, etc. Everything looks fine on the top while the pipeline is moving smoothly.

    Then one day, the number of users using the app at a particular time increases and the jobs start queuing up quickly on SQS, and the response time of the application suddenly goes low. However, the performance of all the servers seems fine on the APM tool.

    In such a scenario, how do you debug the root cause that is affecting the response time without having a monitoring tool that is watching the AWS SQS?

    Of course, AWS provides its own console to monitor its services. If the DevOps engineer is aware of the root cause, debugging is a child’s play. However, when the underlying issue is unknown, it leads to dependency on several tools, which can unearth facts for them.

    When a business’ application or applications are dependent on several cloud services that do not have a monitoring tool yet, how can an APM tool, which can pull only specific data, help provide complete visibility?

    In this cloud-driven world, a developer needs to be aware of how their application interacts with different tech stacks, and how that interaction drives performance, availability and cost.

    Unified CPM Complements APM Bringing the Complete Context

    The industry has traditionally separated the performance management of applications and infrastructure, resulting in multiple toolsets in each of these domains.Neither APM nor IPM alone will successfully address and solve shift-left monitoring requirements.

    APM focuses only on the application tier providing visibility into just part way down the tech stack. If you are a DevOps engineer with an enterprise or an SMB looking into different customer applications, you know it is difficult to make sense of all the resource usage across availability zones and make a case of each application’s cost/performance trade-off, ability to scale, time-to-market, etc. While the cloud services make it easier for development, each service has its own learning curve and abstraction.

    A unified CPM tool thrusts the context up to the shore of APM, in a tech stack. Developers need such tools where they can monitor all the services and get end-to-end visibility from a single pane of glass.

    Conclusion

    Analyzing performance of each dynamic service in context with other dynamic players (services) in the tech stacks will quickly provide the right context and help detect an underlying problem easily—especially, in cases where the problem lies with the cloud resources rather than the application code itself.

    — Pradeep Kumar

  • How a Visual Cloud Management Platform Can Address DevOps Woes

    How a Visual Cloud Management Platform Can Address DevOps Woes

    DevOps and cloud are a match made in heaven. However, the advantages of the cloud are apparent only when continuous deployment, development, operations and other DevOps tasks can be performed and automated seamlessly on the cloud. Moreover, many of today’s cloud management platforms do not offer much cross-functional visibility, something DevOps engineers require.

    A visual cloud management platform can be the answer to ensuring DevOps thrives in a cloud environment. Here are few use cases that highlight how a visual platform can solve a DevOps engineer’s woes:

    Partial Visibility Due to Use of Siloed Infra Management Tools

    There are scores of infrastructure-as-code (IaC) and infrastructure automation tools available, with choices for server provisioning, configuration management, automated builds, code deployments, intraservice orchestration and more, from companies including Ansible, CloudFormation, Terraform, Puppet and Chef. But there’s no single tool that meets all needs. At the end of the day, DevOps engineers need to use and manage dozens of siloed IaC tools that help deploy and manage an end-to-end tech stack.

    Customizing a tech stack to meet the engineer’s needs—choosing from Docker Swarm or Kubernetes, MySQL or Postgres, Jenkins or CircleCI, and so on—can be overwhelming. Figuring out how to run the code in dev; how to build and test; how to deploy changes; where to find metrics, logs, and alerts; and so on across several tools is easier said than done.

    While each orchestration tool provides multiple benefits, engineers also must juggle between multiple dashboards cloud service providers (CSPs) offer. As cloud use increases, complexity and partially visibility are bound to happen, making it difficult to make sense of resource usage and perform root-cause analysis. And if the infrastructure is on a multicloud setup, chances are teams/engineers will lose visibility of resource usage.

    A siloed approach to infrastructure management using multiple dashboards is a big ‘no.’

    Solution: An interactive and immersive visual cloud management platform provides visibility across resources, apps, tools, etc., with a complete context of resource usage from a single pane of glass. The visual console must be visually rich and intelligent enough to provide context-aware real-time prescriptive insights and help with operations on a topology view.

    Visualizing Auto-Scaled Containers and Clusters of Containerized Deployments

    Containers are great for making DevOps workflows easier. Their ability to run almost any type of app has made it popular. Today, there are several container orchestration tools available with autoscaling, including Kubernetes. However, when there are large numbers of clusters of containerized deployments, inspecting or monitoring nodes, pods and containers for optimization, cost reduction and handling system malfunctions can get overwhelming.

    Solution:  A visual cloud management platform can show containers and its subcomponents in a relationship view with other cloud resources on a live topology view. Such a tool will help DevOps engineers investigate anomalies quickly and easily.

    Difficulty in Implementing Resource Dependency Mapping an SDN in a Hybrid Cloud Setup

    Software defined networking (SDN), which enables network automation, is typically difficult to define for DevOps, especially in a hybrid environment. Extending network capabilities or automating the network to update itself when there is a change requirement can be quite challenging in a hybrid setup. The need of the hour is a language, such as JSON or XMPP, that will draw dependency mapping and automate network flow with the cognizance of a human.

    AWS and other public cloud service providers provide basic-level dependency mapping. However, a DevOps engineer loses visibility across resource usage when a business has a chunk of SDN components integrated with dozens of resources on the public cloud or in multicloud or hybrid cloud environments.

    Solution: A visual cloud management platform can map resource dependency on a live topology automatically, analyze and define further network connections and automate operations. With such a tool, a DevOps engineer can easily understand the underlying interconnection, understand the entire infrastructure in a snap and keep the infrastructure hail and healthy.

    Finding Unused DR Environments to Maximize Infrastructure Usage

    Increasingly, DevOps engineers are using backup capacity as development environments to maximize their infrastructure investment. Disaster recovery (DR) environments represent an ideal workspace for developers to test their code with the help of virtualization technologies and advanced networking. However, mapping all the tool integrations and finding that extra capacity in an ever-changing multicloud or hybrid cloud environment can be challenging.

    Solution: A visual cloud management platform can provide visibility into third-party integrations on your cloud and also show any backup capacity available for development use.

    Immersive Visual Consoles Becoming the New Normal

    A visual cloud management platform that helps DevOps engineers get a complete and viewable context across cloud services, network flow and topology view of the entire infrastructure from a single pane is the way forward. Such a platform is the solution to solve several DevOps woes. It enables visualization of public/private cloud services and third-party integrations, giving engineers the ability to understand the resource and network relationship in real time; get a complete perspective of infrastructure; perform contextual monitoring, cloud operations, root-cause analysis in a snap; and ensure security and compliance from one place.

    Let’s look forward to a world in which using these immersive visual consoles will be the new normal.

    — Pradeep Kumar