Category: Application Performance Management/Monitoring

  • How AIOps Makes DevOps Less Noisy

    How AIOps Makes DevOps Less Noisy

    For DevOps engineers, “noise” is the enemy of productivity. In this context, the noise we’re talking about is unnecessary or low-priority alerts and notifications that distract engineers from identifying serious issues—and ultimately can cause alert fatigue syndrome, in which alerting systems are ignored altogether.

    Without the application of a well-constructed noise reduction plan, alert noise will end up taking away from the focus of solving the actual problem that may be causing a more critical issue.

    So, how can you fight alert noise? You might be tempted to assume that the answer lies in reducing the number of alerting tools you use, but that’s probably unrealistic. Teams today are dealing with complex application stacks and multiple tools and data sources, all of which can produce their own alerts for issues that may be interdependent or isolated. You simply can’t take tools out of your stack.

    What you can do, however, is analyze and manage alerts more effectively. Dealing with alert noise ultimately boils down to developing an effective problem analysis strategy. Let’s explore how, with a specific focus on how AIOps factors into keeping alerts manageable.

    Reduce the Time in Analyzing Alerts

    While reducing noise is important, DevOps teams risk losing valuable time solving critical problems if they also have to create and/or add systems to properly analyze alerts and their sources and priority level. Maintaining this system also would be a source of unnecessary labor that may reduce the alert noise, but also reduces the amount of time that DevOps staff can work on the solution to the root cause— which brings up another consideration. When coming up with a plan, the amount of complexity involved in adding the monitoring tools necessary to cover an entire application and/or service can be equally laborious compared to not having a solution at all. At this point, we may be merely shifting the labor emphasis.

    This is Where AIOps Comes In

    Now, let us envision a way that a team can gain full insight into a root cause without exposure to alert noise. The team doesn’t need to analyze every single alert, which would include:

    • Duplicate alerts.
    • Alerts from multiple sources (tools, microservices).
    • Informational alerts (warnings).

    Instead, the team can let AIOps analyze and classify the stream of alerts and identify critical issues. DevOps no longer would need to spend valuable collaboration time analyzing every link in the toolchain. When a team has to analyze every tool, the team could produce false positives, redirect resources toward the wrong solution, spend too much time trying to identify the root cause and create excessive alert noise. Let us envision a way in which the team does not need to spend excessive time in analysis and can experience more effective collaboration in service of solving the actual problem.

    AI and machine learning can relieve this manual process through AIOps. Automated collection of data across the application stack, alert correlation, identifying root cause and decision-making can be leveraged by a team to get to the problem immediately without all of the messy work of manual analysis, sorting and identifying root cause. This level of automation allows for needed human interaction through collaboration across teams, which can result in faster resolution, decreased downtime and effective communication of key events to company staff and end users.

    Analyzing to Predict Future Problems

    Another benefit of AIOps and the power of automated data collection, analysis, issue identification and decision-making is the ability to predict future events. A DevOps team can leverage these insights into effective preventative measures. The ability of AIOps to produce these insights will help a team find ways to automate and/or improve operations. Reducing alert noise no longer needs to be a goal because it is happening through a smooth interaction between the human team and the AI.

    There is a growing need for DevOps teams to utilize the power of AIOps. While human teams are not replaceable, redundant and time-consuming tasks are. The ability of AIOps to effectively traverse a complex toolchain with isolated issues to analyze alert importance, correlate alerts, collect and analyze relevant data, identify root cause and produce holistic actionable insights eliminates inefficiencies in problem-solving and reduces alert noise.

    Making DevOps less noisy is a goal with its roots in effective use of information. Alerts serve to inform, but thanks to the increasing complexity of applications, alerts become noise. Leveraging the power of AIOps serves to do a lot of the dirty work for a team so that noise can be reduced—but more importantly, it can make operations run smooth and keep customers happy.

    — Phillip Lorenzo

  • DevOps Chat: AIOps and APM with Unravel’s Kunal Agarwal

    DevOps Chat: AIOps and APM with Unravel’s Kunal Agarwal

    Unravel is making a name in the AIOps, APM and big data markets. In this DevOps Chat, we speak with Unravel CEO Kunal Agarwal about what makes Unravel a must-have for its customers. We also take a sneak peek ahead to what the near and not so near future holds for big data, AIOps and the tech scene in general.

    As usual, the streaming audio is immediately below, followed by the transcript of our conversation.

    Transcript

    Alan Shimel: Hey, everyone, this is Alan Shimel, devopsy.kinsta.cloud, and you’re listening to another DevOps Chat. Today’s DevOps Chat features Kunal Agarwal, CEO of Unravel or Unravel Data. Kunal, welcome to DevOps Chat.

    Kunal Agarwal: Thank you, Alan. Thank you so much for having me here.

    Shimel: Excellent. It’s my pleasure to have you here. So, Kunal, let’s get right to it. “Unravel” is the name of the company, correct? Not “Unravel Data.”

    Agarwal: “Unravel,” yes.

    Shimel: But yet Unravel is about data to a certain degree. I don’t know if everyone in our audience is familiar with Unravel. Why don’t we start there?

    Agarwal: Sure. We are unraveling the mysteries of big data, Alan. That’s why the name of the company.

    Shimel: Excellent.

    Agarwal: Everybody’s jumping on to big data apps, and what I mean by that is you may be doing something with machine learning, artificial intelligence, IoT, even big-scale data warehousing. And there’s just so many problems that can happen, running these applications at scale, that people just have not seen before. And this is a problem because of all these new systems and technologies that are coming about, such as Spark, Kafka, Hadoop, Cassandra, HBase, many, many more. And the complexity’s all about “Hey, how do I figure out why’s my application not performing well or if it’s failing?” And it’s usually a multi-tenant environment that these big data applications run on, which means there may be hundreds of users, thousands of applications, that you are creating every day and running them.

    And figuring it all out and making sure that they run well is a black art, so there’s a lot of trial-and-error that goes on into fixing these problems, finding the root cause of these problems. And that’s what we are automating, meaning Unravel, after it’s installed in your big data cluster, will be constantly monitoring and managing everything. And if there is an issue, Unravel will be proactive about it, tell you why that issue happened, what caused it, and then even take a step further where it would resolve those issues for you so that you can spend time creating all these amazing big data applications, rather than focusing on fixing all these systems- and application-level errors.

    Shimel: Mm-hmm. So, you know, I mean, there’s a lot there that we’re gonna dive into, but before we do, Kunal, just give our audience – ’cause I always find this fascinating. People wanna know “How do I become a CEO? How does one get to be the CEO?” Give us a little insight into your own personal journey on how you’ve come to be CEO at Unravel.

    Agarwal: CEO is “chief everything officer,” when you first start off. You gotta sweep the floors and you gotta raise the funds and you’ve gotta grow a team. There’s so many things a CEO’s role requires to do, especially in a young company, as you’re growing it. Today, now that we’ve grown to about 75, 80 people in total, across 3 different countries – we actually have offices here in the United States, one in London, and one in India – my job is becoming more about recruiting, more about getting the team together.

    And I think that’s, personally, for me, if that is taken care of, the entire company just hums and does well. Everything else is secondary for me at this time, but I do spend a lot of time doing marketing and sales and finance and product. So it really depends on the day, Alan, of what my job requires me to do.

    Shimel: Amen. You know, I’ve founded or cofounded three or four companies myself and even just running MediaOps, which is devopsy.kinsta.cloud and Security Boulevard, you are chief cook and bottle washer when you’re – you’re chief everything officer, as you said.

    Agarwal: Right.

    Shimel: You know, looking in your background, you’re a double-major graduate – electrical engineering, computer science master’s degree from Duke. I mean, you’re well positioned to be a CEO, people would say, looking at the background, but it’s – you know, you never know what’s coming out next as the CEO. If I had to ask you, Kunal, what’s kind of been the biggest surprise or biggest kind of curveball that you’ve seen in your time at Unravel that you think, “Geez, I didn’t think I’d be doing this or I didn’t think this was part of the job,” what would you say?

    Agarwal: Alan, actually, going to school and getting all those double-degrees does not help you at all becoming CEO.

    Shimel: You get it. I mean, you’re talking to someone who went to law school. I know all about it.

    Agarwal: Right?

    Shimel: Yeah.

    Agarwal: I wish there was a school for CEO, but you know what? The only school for being CEO and leading a company is actually leading the company because there’s so many things that you learn along the way. One thing, because we deal in enterprise software, there’s so many complexities to making a deal happen with a big company.

    Shimel: Mm-hmm.

    Agarwal: And I think that was one of the things that took me a while to grasp and make sure that we’re doing it right. And I mean all the boring stuff, like the contractual paperwork, all the legalities, going through info-sec requirements. All the operational stuff around making a deal happen. You know, when you’re in college and you’re starting to think about a startup, you think about the cool products you’ll make. You’ll think about the impact your product will have in the market and how so easily everybody will flock and come to you and get your product. [Chuckles] But it’s not that simple.

    Shimel: I wish it was.

    Agarwal: and it takes 9 months to 12 months to close some of these deals, so I think, more than the “surprise” factor, preparing yourself and making sure that you can drive efficiencies in all these different processes. I think that’s been one of the key challenges for us.

    Shimel: Absolutely. Absolutely. So, Kunal, if I’m a Silicon Valley VC, I’m looking at a company like Unravel, man, you’re playing in all the right places. Big data is certainly such a huge – I think, when we talk about things like machine learning and AIOps, really, they’re almost the children of big data – you couldn’t have those things without the big data, first of all – so you’re in the right place, obviously. The right time. This is a very happening kind of space. What is Unravel doing that is so – what’s the special sauce? What’s unique about it?

    Agarwal: Yeah, Alan. So, when we created this company – and by “we,” I mean myself and my cofounder, Dr. Shivnath Babu, who’s actually a professor of computer science at Duke University – we both met at Duke – and the problem we were trying to resolve is one of the most fundamental but also probably the most complex and challenging problem to solve, which is “How does one ensure that all of these big data technologies actually work and deliver on their promise?” And, you know, our approach to the problem was always “Hey, there will be a shortage of experts in the market. Even if there are experts, these problems will be requiring a machine to solve them on time and efficiently.”

    So we took the long path of actually creating not just a monitoring tool but a AIOps tool, if you may, which can decipher the problem, connect the dots, and resolve it for you. So it actually took us about three-and-a-half years to build this product or at least the first version of this product. And we moved west to start working with some companies – I lived in New York; he was in North Carolina – and we gave up our cushy jobs, moved to Silicon Valley, because you wanted to work with companies who were using big data tech at scale.

    And some of these companies, we still have advisors in, from Zynga, Rocket Fuel, Twitter, LinkedIn, and they really helped us understand the day-to-day issues that come up when you’re running these technologies at scale. And we took a lot of those learnings into our first product. So we were always about solving a core need that teams in big data tech would definitely need. And, you know, they always say, “Hindsight is 20/20,” right?

    Shimel: Yeah.

    Agarwal: But we always put a big bet that, “Hey, these technologies – Hadoop, Spark, Kafka, et cetera – will become mainstream and companies will start using this a lot more.” So what LinkedIn was doing five years ago, the biggest banks would start doing it now, and that’s where we are in the journey today.

    Shimel: Absolutely. And, you know, it’s funny, full circle, talking about that journey and what you’re doing. That’s how you become a CEO. It’s about being willing to take the risk, giving up those cushy jobs. Right? To do something that you really believe in. And I think that’s what separates CEOs from people who kinda look and say, “Boy, I’d like to do that,” but they don’t actually do it.

    Let’s talk about the market. We’re coming to the end of the year. You’re participating in our Predict 2019 panel, which will be December 18th event. You’re gonna be on the AIOps panel, looking ahead. Why don’t you give us a sneak peek? What’s kind of your take on what 2019 holds for AIOps and big data and so forth, Kunal?

    Agarwal: Well, yeah, Alan. So AIOps is an evolution of IT Ops or APM or DevOps, where you’re using machine learning to, again, understand all of the data – and this could be monitoring data, instrumentation data – that all these systems and applications are generating to draw insights from.

    Now, funnily enough, this is what our customers do with their data set, right? So with some of the biggest banks, some of the biggest insurance companies, some of the biggest health care companies, all Fortune 500. And our methodology of going about monitoring for big data stack was always the same, which is “Why aren’t we using big data technology on our data set, which is machine-generated data, to glean those insights and drive some prediction and actually make things simpler and more accurate?”

    So AIOps is also one of the use cases of artificial intelligence and machine learning. Now, just as I’ve said the industry’s evolving, what we predict to see is the evolution of AIOps, so Unravel, for example, is already on one of the end-of-the-spectrum places, where we actually make decision on behalf of the operations and the development teams, whether it is re-evaluating an application, whether it is making sure that your SLAs for your applications are being met, by moving low-priority jobs to a sub-optimized queue and high-priority jobs to a priority queue or killing bad applications in the cluster, all on your behalf, to make it more proactive.

    But what I predict is there’s gonna be an evolution in just the incumbent APM companies as well, where it’s not just about giving people a monitoring screen or even a native monitoring screen and saying, “Hey, check out all the information we know about an application,” but then I leave it up to you to decide and understand what’s amiss, what’s wrong, and how do you fix it. But I feel we’re already now in the correlation and the insights phase, which is now I can start to connect the dots, with these new software technologies that are out there. But, in 2019, we’ll start to also see some of these companies take the leap to be able to do automated root cause analysis, as well as guided remedies or automatic solutions, to get out of these problems as well.

    This industry’s evolving at a very fast pace, so I’m super excited. And it’s all about making sure that some of the biggest applications in the world, which millions of people actually rely on, all work like a well-oiled machine. And it’s all about guaranteeing reliability, which, at the end of the day, improves confidence of the customers using those products, which further fuels more innovation and more growth. So it’s an amazing cycle and AIOps is gonna be a very, very key part of it.

    Shimel: No doubt about it. No doubt about it. You know, in many ways, I look back on 30 years in IT and it really is a golden time to be alive, if you’re a developer or ops person or just in IT in general. Right? There’s the possibilities and the tools, and what’s in front of you is so exhilarating, right? I mean, I think back, if I was 20 years old now, 22 years old, coming into the –

    Agarwal: So you mean like 10 years ago, Alan?

    Shimel: Yeah, something like that. About 10.

    Agarwal: Okay.

    Shimel: About 10. And, I mean, just unlimited opportunity. I mean, that’s kinda almost the way I look at it. And, of course, it’s companies like Unravel, right, that are kinda letting these opportunities take shape and packaging them for people to run with. So great stuff. Specifically, Unravel – we only have a couple moments here left, but – so, Kunal, anything on the horizon with Unravel you wanna share with our audience?

    Agarwal: Yeah, Alan, absolutely. So, even in big data technologies, there’s so many to cover. We started our life off supporting Spark, Kafka, the entire Hadoop stack, some NoSQL systems, like HBase and Cassandra, and some newer NPP platforms. In 2019, we’re gonna further expand some of those technologies and systems that we cover, especially as we start to see more and more big data workloads move to the cloud.

    We’re also seeing a lot of our companies demanding a hybrid real estate management from the cliched “one pane of glass,” that “Can I see everything that’s in my big data environment, whether that’s on premise and on the cloud, together?” So Unravel is launching that support as well.

    And, last but not least, we are also creating a solution, from our product, which is directed towards helping companies move from their on-premise environments to cloud environment. So actually using Unravel as a migration project management tool, to help you assess, migrate, and then validate your migration. And, on the assess side, figuring out “What system should I get? Which instance type is best for my workloads? How can I keep under cost? What is the cost of running my big data workloads on the cloud?” to then validating and making sure that your SLAs are met, that you’re under cost and under time, and everything is flowing like a well-oiled machine.

    The way we look at it, Alan, again, the way to look at our road map and anything on the horizon is we are here to help our customers in the entire journey of big data tech, so, whatever they’re deploying today and they wanna use tomorrow, Unravel will be supporting that. And this is a natural evolution where companies are going from trying something out to getting something in production, first starting on premise and then going to the cloud, and those are all the shifts and transition points that we wanna hold the hands of the customers that we work with.

    Shimel: Excellent. Excellent. Well, Kunal, thanks for spending a few moments with us. As I told you, the time goes quickly.

    Agarwal: Yeah.

    Shimel: We’re way over time, but it’s okay. Hopefully, people have stayed on till now to listen. I wanna wish you lots of continued success with Unravel. We’ll be checking in on it. Again, a reminder: Kunal will be on our December 18th Predict 2019 virtual event and Kunal will be participating in the CEO panel, taking a look ahead at AIOps in 2019. So join us. You can register for that at predict2019.com.

    Agarwal: Thanks, Alan.

    Shimel: Thank you. Hello to all of our friends at Unravel. And that’s gonna make a wrap on this episode of DevOps Chat, everyone. This is Alan Shimel for DevOps Chat, devopsy.kinsta.cloud. Have a great day.

    — Alan Shimel

  • Best of 2018: Log Monitoring and Analysis:  Comparing ELK, Splunk and Graylog

    Best of 2018: Log Monitoring and Analysis: Comparing ELK, Splunk and Graylog

    As we close out 2018, we at devopsy.kinsta.cloud wanted to highlight the five most popular articles of the year. Following is the fifth in our weeklong series of the Best of 2018.


    As organizations face outages and various security threats, monitoring an entire application platform is essential to understand the source of threat or where the outage occurred, as well as to verify events, logs and traces to understand system behavior at that point in time and take predictive and corrective actions. Monitoring the logs and logs analysis are important for any IT operations teams to identify intrusion attempts and misconfigurations, track application performance, improve customer satisfaction, strengthen security against cyberattacks, perform root cause analysis and analyze system behavior, performance, measures and metrics based on the logs analysis.

    According to a Gartner report, the market for monitoring tools and APM tools is expected to grow to $4.98 billion by 2019, and log monitoring and analytics will become a de facto part of AI Ops. Log analysis tools are emerging as a low-cost solution for monitoring both application and infrastructure (hardware and network).

    There are mix of commercial and open source tools available as the log monitoring analysis tools market has matured. Some of the key features of log monitoring tools include powerful search capabilities, real-time visibility with dashboards, historical analytics, reports, alerts notifications, thresholds and trigger alerts, measurements and metrics with graphs, application performance monitoring and profiling and tracing events. This article focuses mainly on the differences in log monitoring tools ELK, Splunk and Graylog.

    ELK, Splunk and Graylog

    Elastic has put together arguably the most popular log management platform for both open source and commercial (cloud and enterprise) log monitoring tools. The Elastic Stack—more commonly known as ELK Stack—combines Elasticsearch, Logstash and Kibana. Elasticsearch is a modern search and analytics engine based on Apache Lucene, while Logstash provides data processing and enrichment. Kibana offers logs discovery and visualization.

    Splunk is a platform for searching, analyzing and visualizing the machine-generated data gathered from the websites, applications, sensors, devices etc. covering the entire infrastructure landscape. It communicates with different log files and stores files data in the form of events into local indexes. It provides the easiest way of search capabilities and has wide array of options to collect logs from multiple sources. Splunk is available in both SaaS and enterprise editions.

    Graylog offers open source log monitoring tools providing capabilities similar to ELK and Splunk. Graylog performs centralized log monitoring; where Graylog is used for data processing and Elasticsearch, MongoDB used for search and storage. It provides log archival and drill-down of metrics and measurements.

    The below table provides the comparison analysis based on the open source/free trial editions of ELK, Splunk and Graylog.

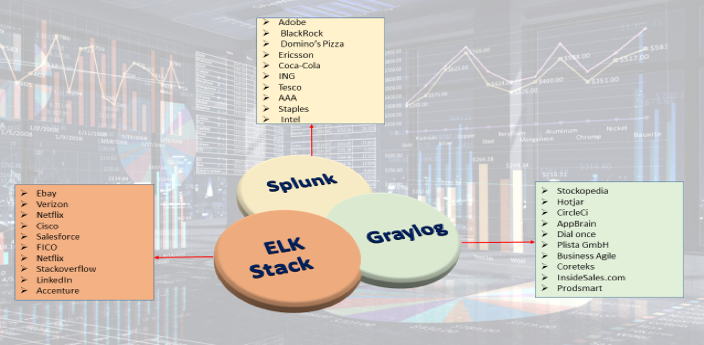
    Top 10 Companies using log monitoring tools (ELK Stack, Splunk, Graylog). Information source collected from ELK, Splunk and Graylog websites.


    Features Comparison

    Features Elastic Stack Splunk Graylog
    General
    License/Edition Available Open source, Commercial

    Cloud: based on the cluster (memory, storage, data center region)

    Enterprise: pricing based on / instance

    Free Trail: Available for 14 days

    Commercial

    Free: 500MB indexing / day

    Splunk Cloud: Pricing based on ingested data to cloud / day & Free Trial of 15 days with 5GB data

    available for search & analysis

    Splunk Enterprise: Pricing based on ingested data


    Open Source: Based on daily volume, price per month

    Enterprise: Free for Under 5 GB/day

    Implementation Language & Logging Format Java

    JSON

    C++, Python

    JSON,.CSV, Text file

    Java

    GLEF-Graylog Extended Log Format

    Community Support

    Enterprise Support

    Available: Well Documented

    Available 24* 7 Support


    Available: Well Documented

    Available: Direct access to the Customer Support Team

    Available: Well Documented

    Available : Unlimited Support from the Graylog Engineers

    Supported Server Platforms All OS-x, Window, Red hat Linux,OS Solaris and Windows Linux ,Ubuntu, Centos, Windows
    Ease of Configuration Need to set up Elasticsearch, Logstash, Kibana, beats with cluster configuration and medium complex to setup. Single platform with server and forwarder from clients, with less complexity to set up. Need to set up Graylog – Graylog web server, Elasticsearch, MongoDB and medium complex to set up.


    Basic Components Involved Elasticsearch – Search and storage

    Logstash – data processing

    Kibana – visualization

    Beats – logs collector and shipper

     Splunk Server

    Splunk Forwarder

    Graylog – Data processing and web interface

    Elasticsearch – log storage

    MongoDB – Configuration data storage

    Data
    Data Collection Beats, Logstash, Elasticsearch Ingest nodes


    Using app-add-ons and Splunk forwarders


    GELF TCP/UDP

    Message Inputs & Content Packs (inputs, extractors, outputs streams, dashboard configuration)

    Graylog Side car


    Data Formats Common Log files format

    Ex: nginx, tomcat logs common formats.

    Accepts any data type including .csv, JSON, log  files , xml, etc. Common log files formats. Ex: nginx [ error_logs, access_logs]

    Syslogs, rsyslogs, GLEF format

    Additional Data Inputs HTTP,TCP, Scripted inputs, Syslog input HTTP, TCP, Syslog input, various Log stash plugin


     GLEF Kafka, GLEF HTTP, Beats, Message Inputs, rsyslog and syslog-ng
    Data Base & Database Schema Creation With Fields Elastic search – document oriented DB

    Schema defined in the specific beats plugins / log forwarders.

    Splunk uses built-in data structure, and stores the indexes to disk.


    Elasticsearch – to store the logs

    MongoDB – storing metadata and dead letter queue messages

    Schema defined in the specific content packs

    Data Correlation

    & Aggregation

    Done through Aggregate filter and logstash correlation event filters Done through index event correlate commands

    Decorators.

    Done through aggregate filters, decorators.
    Centralized Logging Support Available with log shippers Available with Splunk Enterprise Forwarder, Universal Forwarder Available with Logs collector Graylog sidecar, RSyslog.
    Data Import / Export Import / Export data from various sources like Influx DB Export / Import can be done through Splunk DB Connect to relational databases GELF output plugin

    REST API

    Data Transport Kafka, RabbitMQ, Redis Persistent Queue

    Processing Pipeline Components

    Apache Kafka, RabbitMQ (AMPQ)
    Data Collection Intervals Real time Stream and in Batches Real time Stream and in Batches Real time Stream and in Batches
    Search      
    Search Capabilities Provides a highly scalable full-text search and analysis engine with Elastic search Offer dynamic data exploration to extract everything as it having its ow search language. Full-text based search on Real-time UDP/GELF logging with Intuitive Search interface
    Search Language Query DSL (Lucene) SPL (Splunk Processing Language) Very close to the Lucene Syntax
    Protocol  Used For Read / Write operations REST API, HTTP API  REST API, HTTP API HTTP API, REST API
    Log Filter

    Search filtering

    Grok Filter Plugin


    Search filter with fields levels, saved searches, graphs, etc.

    Filter logs applying transforms to events Uses Drools rules, extractors, fields filter

    Blacklisting,


    Visualization      
    Reporting

    Historical Data Management


    Available in X-Pack component

    Quickly generate reports of any kibana visualization or dashboard and any raw data.


    Each report is print-optimized, customizable and PDF-formatted


    Built-in feature

    Reports are created for saved search, visualization or dashboard, set up schedule report, configure the priority of schedule report with support on  Historical and streaming data


    No built-in reporting capability

    REST API can be used to generate own reports on the history data and streaming data.


    Alerting Supported through X-pack / watcher configurations can be created

    Integrations available to send alerts to AIOps tools

    Built-in feature, support real time or scheduled alerting

    Integrations available to send alerts to AIOps tools

    Built-in feature

    Alerts raised based on stream

    Integrations available to send alerts to AIOps tools

    Monitoring
    Server, Device Logs Monitoring Uses Metricbeat, Filebeats for capturing server-related logs Using Splunk Insight For Infrastructure Uses Graylog Beat , NXlog
    Network Logs Monitoring Captures network logs through Packetbeat Uses Splunk MINT to capture network logs  Uses SNMP & netflow Plugin
    Cloud Logs Monitoring Using Logstash, Filebeat, modules Configurable via add-ons in Splunk, for different clouds


    Plugins available to pull logs from cloud.
    Containers Log Monitoring Using Logstash, File Beat & Metric Beat, Logstash processors for Docker logs Splunk logging driver for Docker Uses Filebeat & Native Graylog (GELF logging driver) Integration
    Kubernetes Orchestration Monitoring Using Fluentd, metric beat to ingest logs from Kubernetes Using collector built for Kubernetes Using Filebeat collector sidecar
    DB Log Monitoring Enabled through Filebeat modules, Logstash Enabled through Splunk add-ons for different databases and Splunk DB connect Enabled through Add-on plugins and GLEF libraries for different databases including mysql, mongodb, etc.
    End User Transactions Monitoring, Application Performance Monitoring Enabled through APM and different beats, Logstash correlation, X-Pack components. Enabled through Splunk App for Synthetic monitoring, Splunk ITSI Modules, Splunk MINT SDK. Application logs and add-ons from marketplace.
    Analytics

    (Causal Analysis,  Anomaly detection, etc)

    Supports Machine Learning via X-Pack. Splunk IT Service Intelligence Modules provides machine learning algorithms for anomalies, etc. No out-of-box machine learning support
    Others
    Customization / Extensibility Can create customized dashboards with Kibana controls and search queries.


    Custom Metricsets and Plugins


    Custom rules can be created to define thresholds and alerts


    Can extend / integrate with other tools via webhooks / plugins and programmatic access via REST HTTP/JSON API


    Hosted Elastic Stack provides out-of-box user management features, via X-Pack.


    Flexible to add/ edit new components and views to Splunk dashboards using SplunkJs stack and Javascripts.


    Can create custom metrics indexes and collect data using statsD, collectD.


    Can extend / integrate with other tools via webhooks / plugins and programmatic access via REST HTTP/JSON API with 1000+ add-ons.


    Out-of-box user management.

    Slunk Enterprise Security


    Flexible to add Custom dashboards based on stream using widgets, graphs, CLI stream dashboards.


    Can create custom index models, custom extractors with metrics needed using REST API, content packs.


    Provides few out-of-box alerting with default conditions with custom alerts defined on the streams and conditions.


    Plugins are available in Graylog, to integrate with other tools


    Provides user-management, LDAP and other authentication mechanisms (single-sign on/two-factor) integrations.


    Scalability Supports scalability(horizontal) and high availability with master / slaves cluster. Scalable with distributed deployment of Splunk Enterprise components for data input, indexing and search. Scalable with multiple nodes on ES, MongoDB, Graylog server, along with any queues (Kafka / RabbitMQ).
    Backup / Restore Can take snapshots backup of indexes to any external repository such as S3, Azure, etc.

    Retention on ES through Elasticsearch curator.

    Supports backup of configuration, indexes, warm db buckets based on policies. Archival Plugin available in Graylog Enterprise, to back up indexes and restore to new cluster, via web UI, Rest API


    Log monitoring is very essential as part of full stack monitoring, which can provide better insights for faster troubleshooting. The choice of log monitoring tools will depend on your requirements, infrastructure, price and monitoring and maintenance needs. Elasticstack, Splunk and Graylog have enterprise-ready platforms and solutions for log monitoring, and all are widely used across multiple enterprises and domains.

    — Ritu Bhargava

  • Atlassian Brings Postmortem Analysis to DevOps

    Atlassian Brings Postmortem Analysis to DevOps

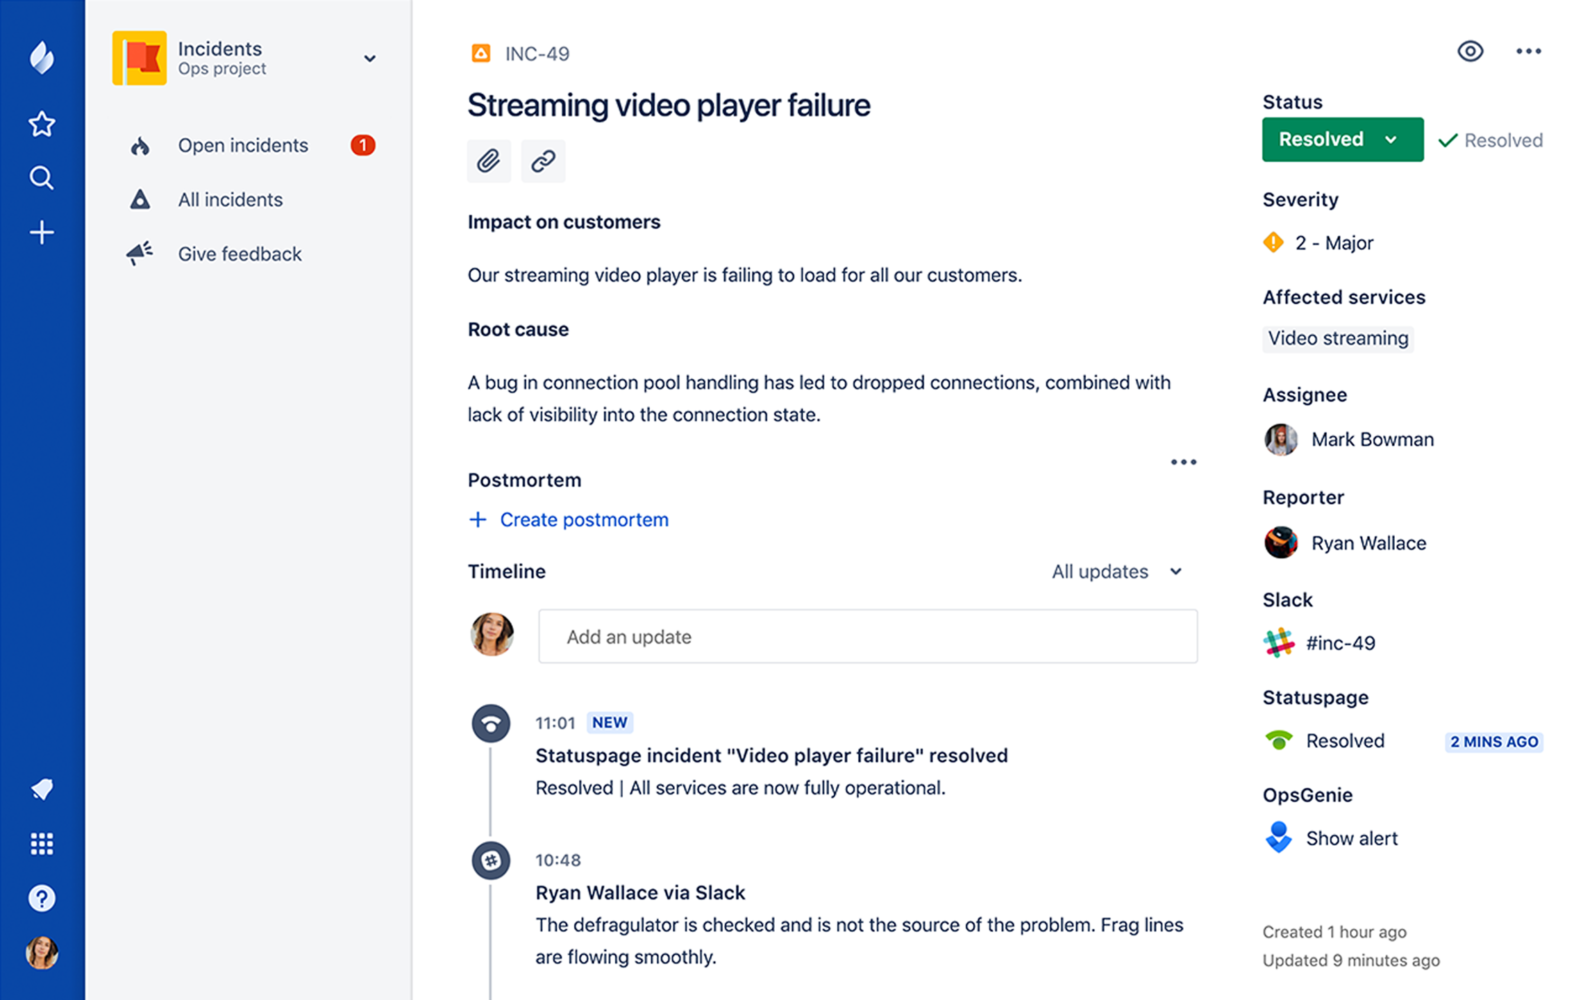
    Atlassian has added a postmortem capability to JiraOps, which gathers a list of all the key events from any IT incident in chronological order to make it easier to analyze what happened, identify root causes and raise issues directly within the JiraOps platform to ensure subsequent actions are taken.

    At the same time, Atlassian is extending the Automation Actions, a set of automated scripts and playbooks made available in Opsgenie to include support for Amazon Web Services (AWS) Systems Manager and Generic REST Endpoint. Those capabilities extend the ability of DevOps teams to launch automated tasks from within an Opsgenie console or mobile applications. Opsgenie is a notification application that Atlassian gained via an acquisition announced the same day the company launched JiraOps.

    Atlassian is also sharing incident management data it has collected throughout the year. Collectively, its customers have recorded more than 190,000 incidents and scheduled maintenance events. Updates to those events were made more than 564,000 times, which in turn fueled the delivery of more than 130 million email and text messages to end users.

    Unfortunately, the Atlassian report also finds only 3 percent of incident reports include any kind of postmortem analysis—an issue the company is trying to address via the latest update to JiraOps.

    Danny Olinsky, head of product marketing for incident management at Atlassian, said that as organizations make the shift from primarily deploying application on-premises to the cloud, many of them are starting to more fully embrace best DevOps practices. One of the central tenets of DevOps is ruthlessly automating as many processes as possible, including incident management. By integrating incident management and DevOps processes, the amount of downtime experienced by any application over the course of its life cycle can be reduced substantially, he said.

    The biggest challenge many IT organizations now face is melding DevOps practices and incident management process, which frequently evolve in isolation from one another. Those processes, however, are being unified as more organizations digitally transform business processes that need to always available. Any incident that might lead to application downtime now has potential revenue implications that go well beyond adversely impacting employee productivity. In fact, clear, precise communications involving any IT incident is now an expectation in the DevOps era, said Olinsky.

    The degree to which organizations will be automating incident management naturally will differ. But at a time when mean time to resolution is being more aggressively measured than ever, many IT professionals have an incentive to automate as many processes as possible. Murphy’s Law also dictates that incidents will manifest themselves at the most inconvenient time, so being able to automate a process from a mobile device can eliminate the need to make a trip to the office in the dead of night.

    It may be a while before IT organizations are able to fully automate every response to an IT incident. But as process that can be automated are identified, the lower the probability a truly catastrophic event capable of paralyzing the entire organization becomes.

    — Mike Vizard

  • The Power of Autoscaling and the Mistake You’ll Never Make Again

    The Power of Autoscaling and the Mistake You’ll Never Make Again

    Many years ago when I was interning as a software engineer, I made a mistake that could have ended my career just as it was getting started …

    It was my birthday, and I was given the task of loading queries to a database. The task was straightforward—even then, when I was only an intern learning my craft. I was using a program to upload the queries automatically. It looked like the program was running well, so I decided to go home and leave the program running overnight.

    The next day at the office I met any intern’s worst nightmare: Everything had stopped. And it was all my fault. The queries were loading with a paralyzing level of inefficiency. In fact, it took up all of the processing power that we had in that company server, making it crash. All operations were brought to screeching halt … just for my measly query project.

    It took several hours for the operations team to have everything running again. Luckily, I didn’t lose my job. In fact, the company ended up handling the situation graciously, and it turned out to be a good learning opportunity for me.

    These days, something like this is entirely avoidable, and it’s all thanks to the magic of autoscaling. As recently as 10 years ago, obtaining more server space was a slow and rigid process owned by a few gatekeepers. Now anyone can acquire more server space with just a few clicks.

    The democratization of processing servers has completely transformed the internet. It has given any organization virtually unlimited processing power at a moment’s notice. When done strategically, autoscaling allows for a more flexible and agile processing infrastructure. If implemented in a way that’s ad hoc or rushed, your organization will end up spending exorbitant sums of money without seeing the full potential of autoscaling.

    Here are three questions you need to answer to develop a winning autoscaling deployment strategy.

    What Should You Autoscale?

    Before the advent of autoscaling, projecting server needs took a lot of guesswork. Imagine, for example, that a timely and effective advertisement suddenly brings a 1000x spike in traffic to a company that sells sunglasses. If the company is not ready for this spike in traffic, everything comes to a screeching halt. Orders are not filled—and some orders can’t even be made because the server space is not ready to handle the unexpected surge in volume.

    With autoscaling, processing power can be offloaded to a new server automatically, based on the conditions set by the system’s administrators. This is valuable not only in the case of spikes in traffic, but also for lag periods. This is a way to avoid paying for processing power that you’re not using.

    In any organization’s computing architecture, there are a number of components that can be autoscaled, whether it’s central processing units (CPU), random-access memory (RAM) or bandwidth. The first step is to collect as much data as possible to understand the current operational loads of each of these items. Any organization using Amazon Web Services (AWS) has access to some data monitoring services, but they tend to be very basic. It’s better than nothing, but there are other options out there.

    One option is black box testing, which allows you to measure various components within your  infrastructure through monitoring. Among many things, it can help you determine where bottlenecks are occurring. Elastisearch is another great resource for word searching and metadata collection within a document or a digital framework.

    Another effective tool to assess autoscaling needs is something called an ‘agent.’ It works by sending pulses to measure processing data throughout an entire system. Collecting data like this will give you crucial insight on the state of your processing infrastructure.

    Once you collect all of this data, a thorough analysis is in order. At present, analyzing this data must be done manually, but before long machine learning will take care of this part of the process. It’s important that you consider all layers of your applications (front end, back end, database) to autoscale effectively. It can be tempting to scale at will, given how easily it can be done. Be vigilant against abusing this capability. Otherwise, it won’t be long before you spend outrageous sums of money on something you don’t need.

    How Should You Autoscale?

    An important concept to understand before you decide on your autoscaling approach is containers. Containers are small pieces of code that are meant to perform a specific function. In this way, a single machine can contain several apps used to perform a variety of functions: CPU, RAM, bandwidth, disk space, etc.

    Containers are a sophisticated way to get creative with the server space you’re working with, and should be considered even before you start building on a vertical or horizontal autoscaling strategy. Better algorithms in existing hardware can help you to avoid making new hardware purchases. In any case, once you do decide to autoscale, containers should most definitely be considered as you strategize and build.

    However, while containers can be great for scaling, it should be taken into account that they have the potential to add a great deal of complexity to your server. For example, if your server can run 20 containers, but suddenly you need three more, buying a new server with more containers is an expensive solution, since the server would be mostly empty.

    In principle, there are two ways to autoscale: vertically or horizontally. Scaling vertically means adding more physical machines with more gigabytes for more processing power. The biggest AWS machine server that’s currently available (at least as far as I’m aware) is 128 CPUs. That’s the most processing growth you can make from just adding one server. The cost of a new machine like this will vary: anywhere from 80 cents to $7 an hour is what you can expect to pay.

    The other approach is to scale horizontally, which would involve a cloud-based solution. For organizations not ready to make the commitment that comes with adding a new physical server, this is the approach worth considering. Plus, with a horizontal approach to autoscaling, it’s possible to adjust processing needs on the fly.

    It’s important to understand that not all parts of an application can scale the same way. Databases, for example, can scale up with ease. But scaling in (horizontally) would take a lot of time. If your data is stored in 30 front-end containers and you want to scale in to 15 containers, you can’t do it in one step. You’d first need to scale from 30 containers to 28, wait for the data to replicate, then scale in from 28 containers to 26, again wait for the data to replicate, then from 26 containers to 24, etc. Otherwise you risk losing all of that data.

    When Should You Autoscale?

    Consider the above example of the sunglasses vendor. While it’s impossible to predict exactly when your business or customer base will reach a tipping point, something such as publishing out an advertisement with a broad reach is certainly an instance where your organization ought to be ready for a sudden spike in traffic. Your business decisions should be made mindfully, so that the potential effects of actions like these—and the strain they create on your organizational architecture—are understood ahead of time.

    Anticipating peaks and troughs in demand is something businesses have been doing for centuries. In Colombia, for example, utility companies have long understood the power of “arepa hour”: This is when Colombians are at home eating breakfast (specifically arepas, a traditional breakfast food in Colombia). Knowing that the majority of the country is likely to be in their homes sometime between 7:30 and 9:30 a.m. consuming power, that is a crucial data point that can allow for utility companies to be ready for this disproportionately high level of demand.

    The dilemma to determine “the arepa hour” of your business’s autoscaling needs often comes down to CPU and memory. Should you be ready to autoscale based on when your site crosses a predetermined CPU load? Or should it be based on the memory running on your servers?

    The answer is really neither. There is no “golden metric” that will point the way for your autoscaling strategy, and you should never decide to scale based on a single data point in isolation. For example, it may make sense for processing data to be offloaded to a new server once the processing capacity is at 90 percent, but it’s also entirely plausible that your application continues to run completely normally with zero issues at this processing load.

    You should be aiming to strike the right balance between efficiency and not compromising the user experience for those who visit your site or use your application. And the only way to do this is to consider all of your data points holistically and how they interact with one another—not in isolation.

    Conclusion

    We are past the time in which a query loading faux pas like the one I made as an intern can completely shut down a company’s processing activities. Given how accessible processing servers have become, some may find it tempting to “brute force” their way through every problem: Make a few clicks and pay for more server space at will. Don’t be goaded into taking the easy way out. Think about autoscaling strategically by answering these deceptively basic questions, and you will in fact make it easier (and more cost efficient) for your organization in the long run.

    — Alejandro Calderon

  • DevOps Chat: Managing Apple Devices with Fleetsmith

    DevOps Chat: Managing Apple Devices with Fleetsmith

    Managing Macs, iPhones, iPads and other Apple devices at scale is not something really native to iOS or OSX. Enter Fleetsmith. In sort of a Puppet-meets-Apple environment, the Fleetsmith team automates configuration, management and security of your Apple devices.

    In this DevOps Chat we sit down with Fleetsmith co-founder and CEO Zack Blum and company adviser, Puppet co-founder Luke Kanies, to discuss the mission and challenge in managing Apple devices.

    As usual, the streaming audio is immediately below, followed by the transcript of our conversation.

    Transcript

    Alan Shimel: Hey everyone. Alan Shimel devopsy.kinsta.cloud and we are here for another DevOps Chat. Excuse me. This episode of DevOps Chat features an old friend and a new friend. We have, first of all, cofounder and CEO of Fleetsmith, Zack Blum, who is the new friend. Zack, welcome.

    Zack Blum:  Thanks, so much. Great to be here.

    Shimel: Okay. And then joining Zack is our old friend, Luke Kanies. And Luke really needs no introduction to our audience. Luke is the founder of Puppet.

    Luke Kanies: Famous on the internet.

    Shimel: Famous on the internet, but still puts a token in when he jumps on the subway. But anyway, Luke, welcome.

    Kanies: Thank you very much for having me.

    Shimel: So let’s get this out of the way right away. Luke, what’s your connection to Fleetsmith?

    Kanies: I have been trying to help Zack and his cofounders, trying to tell all the stories of all the ridiculous mistakes that I made in hopes that they make only new mistakes.

    Shimel: Wouldn’t that be a great thing? Man.

    Kanies: We can dream, right? We can dream.

    Shimel: Yeah. I was just going to say, if you can bottle that, man, you really would be famous. So Zack, before we even jump into Fleetsmith, then let – you know, Luke has told us what the connection is. Always interested to hear. How did you hook up with Luke and come about to – I’m going to assume you asked him to an advisor here.

    Blum:  Yeah. Well, it’s funny actually. Even before that, the interesting thing is Puppet itself was the inspiration for us starting Fleetsmith. So the connection goes really far back. I was the IT director at a company called wikia and we had this problem where we needed to manage our device fleet.  So I asked around my peers at IT and security and talked to a guy at Dropbox and asked how they did it internally. And it turns out that they use a bunch of open source tools traditionally used by DevOps pros actually to manage their laptops.

    So I went out and learned all about Puppet and realized, “Oh, my goodness. There is an amazing application opportunity here on the endpoint side.” So long story short, that guy at Dropbox, Jesse Endahl, became our cofounder and CSO; had a product. And Luke and Puppet were a major inspiration. So pretty cool.

    Shimel: Very cool. Very cool. So let’s address Fleetsmith, right? What is it you guys do?

    Blum:  Yeah. Thanks so much for asking. We do a few things. We are a modern Apple device management product. So we help companies manage their corporate Macs, iPhones, iPads, and Apple TVs. And we really try to accomplish four things for our customers. Number one is making on boarding new hires as seamless as possible. So employees ramp right away. We do that by automating new device set up. So straight out of the box, to have a computer set themselves up.

    The second one is we provide fleetwide device intelligence so that IT can see problems before employees get interrupted. We do that with really core reporting on exactly what’s going on out there. The third one is we provide employees with uniform, up-to-date computing environment. We do that through automating OS and third-party app packaging, patching, and the delivery of those as well as config for Wi-Fi printers and other tools.

    And the fourth one, the last one, is we decrease business risk for customers by allowing them to enforce, in an automated way, security best practice so features like disk encryption with automatic key escrow, remote lock and wipe. And so those are the four things we do; really try to help companies of any size, especially small and medium businesses, take those best practices and apply them in an automated way without huge teams and huge _____.

    Shimel: Excellent, man. You know, as crazy as it sounds, I almost feel like you serve an underserved business segment for first trillion dollar company ever, right?

    Blum:  Well, we think you’re right. Yeah unfortunately, too many of the companies that we come across have nothing in place at all; no visibility, no automation around this. Then there are a lot of companies who have something in place and it’s just incredibly tedious to administer. There are so many higher value things that IT and security can focus on than manual packaging of software updates.

    You know, providing great customer service to their employees, helping them do better work. So we are really excited.

    Shimel: You know, but this has always been a – I go back in my years in security. We – the company I helped found, kind of one of the pioneers in what we call the NAC market, the network access control. So it was a little different. As you would log onto a network, we would check your endpoint, whatever that might be, and make sure it conforms to whatever the policy that was set. And part of those policies were; were you up-to-date on your patches and your AVs and all that good stuff.

    Blum:  Right.

    Shimel: And even then – and by the way, this was for three letter agencies and U.S. Department of Defense networks. Even then, checking Macs was like a black hole. Right?

    Kanies: It’s always been that way.

    Shimel: I’m sorry, what?

    Kanies: It’s always been that way, for various reasons. And one of them is that they just haven’t been used as much. The second is that Macs have always been kind of cut out of IT policy. Either the Windows – the IT has always been run by Windows and they either say, no, you can’t have them, or, yes, you can have them, but don’t ever talk to us about them. So they’ve kind of always been out.

    In the last 10, 15 years, Apple has really done a great job of building a device that is better for actual usage. So it started out very much in the consumerization of IT, which is how PCs got started in the ’80s, course, as people bring their own computers in. What then they started bringing their own Macs in. Now you look at, especially small companies, and they’ve gone from, “I’ve got a couple of Macs for my designers.” To, “Everyone have a Mac and I’ve got a couple of PCs because my accounting people have to use the Windows version of Excel for whatever reason.

    Shimel: You know what? That’s exactly it. And it’s interesting that we get this kind of folks coming in. And one of my colleagues just joined here. I apologize. So when Macs were 2 percent of the market, maybe no one cared. But as we were talking off mic earlier, when you started getting to 20 percent or more of the market or thereabouts, that’s a number, right? That’s a sizable amount to worry about.

    But how much are the – and I will throw it both at Luke and Zack. How much are the guys – and due to Apple’s professed policy of not wanting to be in the enterprise or not wanting to be in that business market of being a consumer brand? Right? And as a result, you know, if it walks like a duck, it quacks like a duck, but it’s really not a duck. Right how much of that is to blame here for our, up to this point, neglect of managing Macs in the workplace?

    Blum:  You want to start on that Luke?

    Kanies: Sure. Honestly, I don’t think much is, for at least two reasons.  No. 1 is that it wouldn’t have mattered if Apple had decided they really wanted to be enterprise. They would have failed. We know that because of taking multiple cracks at trying to do enterprise stuff and all of them fail. If they are lucky, they deflate quietly and just get brushed into a corner. If they’re unlucky, they fail relatively spectacularly.

    So Apple has, in the past, fought against its own DNA and lost because that’s how it works, right?  And when you look at Microsoft today and they are resurgent. And one of the ways they are resurgent is that they are doing a better job of being who they are rather than trying to be who they are not.

    I think the second reason is that Windows was incredibly dominant for so long. The way in which Windows succeeded was very business oriented, very – and yes it was kind of user oriented at first, but that was long time ago. You know, when I came up and went to college in the 90s, my – first cut my teeth, I was a Solaris user. I was – back before there was Linux. So even then you wouldn’t choose between Windows and Mac and a corporate environment. You would choose between Windows and Solaris in a corporate environment.

    Shimel: Right.

    Kanies: And again, you had a couple of designers in the corner and they had Macs what they did was really specialized. But I don’t really think it had anything to do with Apple. If anything, Apple was struggling to hold on at all. It was less that they weren’t an enterprise company and more that, “Wow. We found like two people who can’t live without our product that we going to make sure we do everything you can to make them as happy as possible and we’re not going to worry about anybody else. ”

    And it was only when, kind of the world changed a lot, partially because Jobs came back. But partially because the world changed a lot, right? The internet came out. And the reason why you wanted a computer shifted from, “Because I need one for work,” to, “Because I need one at home.” Right? And if the iMac had been 10 years earlier, they wouldn’t have sold any because, why would you have a computer at your house in 1990. There was no – there is not nearly so much reason. But when you can dial-in, when you’ve got Internet, that really changed the world.

    Then the trends, the drivers of computing shifted from entirely business use cases to at least 50/50 personal, business use cases. And one can argue today that the majority of drivers of how people think about their relation to computing is mostly driven by consumer use cases and that pushes to the enterprise. And we’ve seen this consumerization of IT trend going back decades. It’s more of a treadmill or an escalator than it is a one-time blip. But to me, this really explains why it matters now and it didn’t matter before, because that consumer use case driving so much of the story.

    Shimel: Yeah. I mean, so Luke, I’m a little older than you, right? Solaris is … My first company, we ran you know, SPARC servers, UltraSPARC, actually. But –

    Kanies: They may be slow, but they sure are expensive.

    Shimel: Don’t even go there, man. But on top of that, I was an OS2 dude.  I loved OS. I was running OS2 really early on. I still don’t understand why Windows is here and not OS2. But that’s another story.

    Kanies: But you know, one of the things that I think has really enabled this is they used to be such a gulf, such a, frankly, a pain in the butt to move. If your colleague was on Mac and you are on Windows, you just had to give him a word file to use or spreadsheet or anything, for that matter. You know, reformatting discs and doing all that nonsense. Beyond the internet, interoperability between has really, I think forced it.  But that’s – you know, that, it speaks for itself, right? A lot of us are using Macs today. I’m on a Mac right now.

    Zack, one of the – and we shouldn’t just focus on Macs. We should focus on what the iPhones and the iPads and Apple TV and it’s is ubiquitous, man. Nothing drives security people battier then having sort of unknown devices or unmanaged devices or black holes in their network.

    Blum:  Absolutely.

    Shimel: And so I would imagine that’s the allure, if you will, of giving Fleetsmith a whirl.

    Blum:  Yeah, absolutely. And especially with the move to the internet of things. Even with computing devices like iOS and iPad, you had iPads, for example, in nontraditional computer roles like a front desk check in machine or the conference room calendar. Then you have, often, three devices comprising a conference room videoconference set up, right?

    So these aren’t as much for individual employees anymore. These are sort of use case driven, almost appliance type applications. So not only do you have these unassigned, if you will, devices floating out there, they’re just on the internet. The corporate network as far as computer management and security of devices is dead, we need to secure the endpoints wherever they are and provide visibility.

    So that’s one of the great things about a product like Fleetsmith is that we provide that things to security folks whatever network the devices on and whatever its application is. And I wanted to add one thing to what – continue Luke’s first point from before.

    Apple absolutely has been a consumer company and now that there is such a high enterprise market share, they’ve actually stepped up and are building a lot of really great management APIs, kind of recognizing that third-party providers of MDM like us are then able to run with that where that is in our DNA. We are experienced IT and security folks. So they are doing some really exciting stuff that’s enabling further penetration into the enterprise stream.

    Shimel: Absolutely. One other just question. This is something that’s kind of – it’s close to where I’ve come from in some ways. If I’m the IT guy or the security guy, I absolutely abhor having multiple management interface systems that I’ve got to work with. So I’ve got this to manage my Mac stuff and iOS. I got this to manage my Windows stuff. I got this to manage my Linux. I got my cloud management stuff.

    How – does Fleetsmith integrate with any of, sort of the larger Windows or other kinds of device management products out there?

    Blum:  Alan, you’re talking about the fabled, single pane of glass. I think that’s what I’m hearing.

    Shimel: Yeah. Well, the mythical single plane of glass, but okay.

    Blum:  That’s right. Well, you said it. To answer your question directly, we do integrate with G-Suite and Office365 so that when people adopt Fleetsmith they don’t have a ton of manual data entry for their inventory. But aside from that, as far as devices go, there’s kind of the suite – device management, there is the suite approach and the best-of-breed approach.

    Unless you have incredibly, incredibly simple needs, usually the suite approach, you know, these companies that build management for every single OS, really fall short in all but one. They really started as a signal platform and just tacked on a couple of checkboxes. So unfortunately, in today’s world the reality is that if you need zero touch deployment, you need to automate the setup of the devices and you need FileVault disk encryption with automated _____ _____ _____. You need to make sure everything is encrypted. You really need the best-of-breed solution.

    So we do all of Apple and there is some products that do all of Windows, a lot out of Microsoft. And past a certain point, those are pretty much just a requirement today.

    Kanies: I would go a little further and say I would add a different dimension that’s less platform because Puppet, for example, is promiscuously cross-platform, but almost entirely server-side. So you can use, as Zack found in the early days, you can use Puppet to manage your desktops. But what you will find is just a constant low-level of friction in doing so because so much of our workflow, so much of the experience is built around servers.

    You might say, “Why is it hard to – if you are servicing more complicated than desktops why is it hard to manage them?” The answer is, desktops are off all the time, laptops are off all the time, they check in from different networks all the time. You don’t get to decide when is a good time for the user to reboot their computer. The user really has to decide.

    You’ve got to build a completely different experience around the product. It’s something that could be done, but there was a lot of friction. So I would say that I agree with that point, that you got to pick best-of-breed. And part of that dimension is what platform you’re talking about managing. Certainly a Windows solution… A solution for Windows being used to manage your Macs is not a great idea. But also, I think a solution for servers, a solution for back in, is not a great solution to manage desktops and laptops.

    That’s really where you do need a different solution. And not that it’s impossible that you could have a company doing both, but it’s unlikely and it certainly hasn’t happened yet.

    Shimel: Got it. Got it. Got it. Guys, we are right on the top of the hour. Unfortunately, I need to end it right here. But before we do, Zack, really quickly, people can get more information about Fleetsmith at…?

    Blum:  Yeah, just go to Fleetsmith.com.

    Shimel: Okay. And you know what? Maybe we could follow up in a couple of weeks before the end of the year because I do think the whole issue of Mac management as well as non-computer – or nontraditional PC devices, whether they be iPads or some sort of IoT and whether they’re running, frankly iOS or some other non-windows, non-Linux – well, maybe Linux. The idea of keeping them compliant, with whether it be a security policy, access policies, what have you, is a really big problem a lot of companies try to tackle, but they tend to stay in the low hanging fruit way rather than maybe some of the corner cases, as bad as a corner case as it may be, you know, it’s still not the mainstream like that.

    Blum:  Yeah. Absolutely. I could talk about that all day. I would love to.

    Shimel: All right. We will schedule something. Hey Luke, I’m sorry we didn’t have enough time to really dig into what else you got going on. But maybe we can do a follow up at some point on that as well.

    Kanies: That would be great. I will warn you that most of what I’m doing next is pointedly not very DevOps. I took 20 years in one industry. It has been enough.

    Shimel: Thank you.

    Kanies: So there is a lot that I’m working on but it’s taking the lessons of the last 20 years and trying to use some of the same tools in different places with different people.

    Shimel: That’s not a bad thing either, my friend. As you said earlier, it’s life.

    Kanies: Yeah.

    Shimel: Good luck with it though, and we will be in touch. Guys, thanks for being our guests on this episode of DevOps Chat. Fleetsmith.com, that’s; F-L-E-E-T-S-M-I-T-H.com. If you’re looking to manage and secure your Macs or iOS devices, worth checking out.

    This is Alan Shimel for devopsy.kinsta.cloud. Until next time, everyone, have a great day. Bye-bye.

    Kanies: Thanks so much, Alan.

    Blum:  Thanks.

    — Alan Shimel

  • Metrics, Logs and Traces: The Golden Triangle of Observability in Monitoring

    Metrics, Logs and Traces: The Golden Triangle of Observability in Monitoring

    It isn’t surprising that the job of monitoring infrastructure and application environments has grown more complex as the underlying technologies evolve. Nor is it surprising that the need to get monitoring right has expanded as our business reliance on IT grows ever deeper, so it is important to have a good grasp of the core tools at your disposal.

    What you might call the golden triangle of observability includes metrics, logs and traces. Each plays a specific role in infrastructure and application monitoring so you need to understand what they bring to the table.

    Metrics

    Metrics probably represents the most valuable of the three monitoring tools because:

    • So many resources are designed to spit out various bits of health and performance information (and there are loads of tools to collect this information).
    • They are efficient.
    • They are frequently generated.
    • They are easily correlated across elements of your infrastructure.

    Everything from operating systems to applications generate metrics which, at the least, are going to include a name, a time stamp and a field to represent some value. Since so many resources come ready to tell us about themselves, metrics is an obvious place to start when it comes to monitoring.

    Most all metrics will enable you to tell if a resource is alive or dead, but if the target is valuable enough you’ll want to be able to ascertain what is actually wrong with the system or going wrong.  As you can imagine, the latter will require detailed information about what is happening inside the system, so called white-box monitoring that relies on internal instrumentation.  The more rudimentary black-box approach draws conclusions about the health of a system based on externally visible indicators (is it responding to any system calls?).

    But perhaps the most important thing to understand about metrics is that last bullet about  being able to correlate metrics across infrastructure components.  Given the complex interdependencies common to IT environments today, the ability to stitch together metrics to get a bigger picture view is a real time saver. And it becomes even more critical as we move to cloud-native environments because of the dynamic nature of cloud  infrastructure and the ever-changing relationship between that infrastructure and the applications.

    An initial challenge of harnessing metrics is the variety of the information available and the number of tools needed to collect and make sense of that information. Then there is the question of how you store data in so many formats from so many resources. But the resultant upside more than makes up for the effort required to figure out how to harness the information.

    It is also worth noting that, given there is no standard API for metric collection, many organizations use agents to collect data that is either pushed to a central location for analysis or pulled by that central resource. Gartner says agents frequently referenced by customers include push agents Collectd and Telegraf, while Prometheus is cited as a tool to pull information from targets.

    Logs

    Logs are perhaps the second most important tool in the monitoring toolbox because virtually everything logs information about what they are doing at any given time. What’s more, logs tend to give more in-depth information about resources than metrics.  So, if metrics showed the resource is dead, logs will help tell you why it died.

    The problem with logs is there can be too much of a good thing. With everything in your environment tracking what they are doing and anxious to share that information, it is easy to see how that could result in a mountain of data. Instead of streamlining the monitoring process, you are simply creating a big new centralized haystack.

    And like metrics, differences in log formats and the abundance of tools available to collect and make sense of logs, complicates the job of getting the most out of this rich trove of material. There are, however, a number of common tools used for collecting logs, such as syslog and open source tools such as Fluentd.

    The trick to getting the most out of these tools is limiting what you collect to keep it manageable, and, where possible, to home in on common fields so you can more easily find the needles in the haystack.

    Traces

    Last but not least in the monitoring triangle is application trace data, which “traces” information about specific application operations. With so many application interdependencies these days, these operations will typically involve hops through multiple services (so called spans).

    Traces, then, add critical visibility into the health of an application end-to-end. They are, however, solely focused on the application layer and provide limited visibility into the health of the underlying infrastructure. So, even if you collect traces, you still need metrics to get the full story of your environment. APM tools feed trace information to a centralized metrics store, so traces provide a nice source of data for an app-centric view.

    The need for the viewpoint that traces can provide is exacerbated in container-based microservice architectures that are nothing more than a collection of stitched together services. These environments can be addressed with something called distributed tracing.

    Do You Need All Three?

    There is obviously overlap among metrics, logs and traces. But the quick answer to the question of whether you need all three types of monitoring tools is, It depends. The simpler your environment and the more tolerant you are of performance degradation and outages, the fewer tools you’ll need to keep things running. Basic metrics will probably work fine for you.

    Conversely, more complex environments that have to be up and running at all times or need to be fixed as quickly as possible will require a mix of tools that answer more than the question of, “Is it broken?” Metrics and logs will be base requirements.

    And finally, if your environment consists of a lot of intricately interwoven pieces, then adding traces will save you effort when it comes to birddogging problems. If you’re not there yet, but see containers and microservices playing a bigger role in your future, you’ll probably want to start getting familiar with trace tools today.

    Keep in mind that each of these tools requires storage considerations. Yes, there are options to support multiple tools from the same repository, but you’ll want to consider those needs as you build out your monitoring repertoire. And ultimately, you’ll want analysis and alerting tools that can span the environments, so keep that in mind as you consider the options.

    Together metrics, logs and traces make up the golden triangle of observability and will help you stay on top of the ever-churning IT world driving business today.

    — Apurva Dave

  • Cost Per IT Ticket: Think Beyond Opex in Your Cloud Journey

    Cost Per IT Ticket: Think Beyond Opex in Your Cloud Journey

     Globally, organizations have embraced cloud computing and delivery models for their numerous advantages. Gartner predicts  the public cloud market is expected to grow 21.4 percent by the end of 2018, from $153.5 billion in 2017. Cloud computing services provide an opportunity for organizations to consume specific services with delivery models that are most appropriate for them. They help increase the business velocity and reduce the capital expenditure by converting it into operating expenditure.

    Capex to Opex Structure

    Capital expenditure refers to the money spent in purchasing hardware and in building and managing in-house IT infrastructure. With cloud computing, it is easy to access the entire storage and network infrastructure from a data center without any in-house infrastructure requirements. Cloud service providers also offer the required hardware infrastructure and resource provisioning as per business requirements. Resources can be consumed according to the need of the hour. Cloud computing also offers flexibility and scalability as per business demands.

    All these factors help organizations move from a fixed cost structure for capital expenditure to a variable cost structure for the operating expenditure.

    Cost of Assets and IT Service Management

    After moving to a variable cost structure, organizations must look at the components of its cost structure. They include the cost of assets and the cost of service or cost of IT service management. Cost of assets show a considerable reduction after moving the entire infrastructure or assets to cloud. The cost of service remains vital as it depends on the day-to-day IT operations and represents the day-after-cloud scenario. The leverage of cloud computing can only be realized if the cost of IT service management is brought down.

    Growing ITSM or ITOPs Market and High Stakes

    While IT service management (ITSM) has taken a new avatar as IT operations management (ITOM), incident management remains the critical IT support process in every organization. The incident response market is expanding rapidly as more enterprises are moving to cloud every year. According to Markets and Markets, the incident response market is expected to grow to $33.76 billion by the year 2023 from $ 13.38 billion in 2018. The key factors that drive the incident response market are heavy financial losses post incident occurrence, rise in security breaches targeting enterprises and compliance requirements such as the EU’s General Data Protection Regulation (GDPR).

    Service fallout or service degradation can impact key business operations. A survey conducted by ITIC indicates that 33 percent of enterprises reported that one hour of downtime could cost them $1 million to more than $5 million.

    Cost per IT Ticket: The Least Common Denominator of Cost of ITSM

    As organizations have high stakes in ensuring that business services run smooth, IT ops teams have additional responsibility in responding to incidents faster without compromising on the quality of service. The two important metrics for any incident management process are 1) cost per IT ticket and 2) mean time to resolution (MTTR). While cost per ticket impacts the overall operating expenditure, MTTR impacts customer satisfaction. The higher the MTTR, the more time it takes to resolve the tickets and, hence, the lower customer satisfaction.

    Cost per ticket is the total monthly operating expenditure of the IT ops team (IT service desk) divided by its monthly ticket volume. According to an HDI study, the average cost per service desk ticket in North America is $15.56. Cost per ticket increases as the ticket gets escalated and moves up the life cycle. For an L3 ticket, the average cost per ticket in North America is about $80-$100+.

    Severity vs. Volume of IT Tickets

    With our experience in managing the cloud IT ops for our clients, we understand that organizations normally look at the volume and severity of IT tickets. They target the High Severity and High Volume quadrants to reduce the cost of the tickets. However, with our experience, we strongly feel that organizations should start their journey with the low hanging fruits such as the Low Severity tickets, which are repeatable in nature and can be automated using bots.

    In the next blog, we will elaborate on this approach that can help organizations in measuring and reducing the cost of IT tickets.

    — Neeraj Deuskar

  • Solving the ‘Automagical’ Apps Automation Problem

    Solving the ‘Automagical’ Apps Automation Problem

    The DevOps Revolution started with a handful of  simple principles. A key one was that systems should be managed by code, not by humans, to eliminate complexity and ensure better security, compliance and scalability. To manage compute infrastructure at any scale, the process should be automated with logic captured in code. And, ideally, automation also would apply as you move up to the stack to middleware and applications layers.

    Unfortunately, it’s not that simple. In fact, automating applications turns out to be way more complex than automating server deployments. For this reason, we need a new approach to managing applications and infrastructure. Managing servers and lower-level environments could be simpler, but existing bottom-up methods work fine. Managing applications, however, must come from the top down. That is, applications should come with everything they need to be successful: configuration, packaging, discovery, scaling requirements and more. And that just isn’t how we have historically built software. Applications are built on layers and layers of dependencies that connect all the way down to the system level. So how do we break the mold and make an application “self contained?

    Thousands of Apps with Millions of Dependency Permutations

    By automating the Linux and Windows server ecosystem and a small number of  derivative operating systems we can cover roughly 95 percent of operating systems, and the series of functions that are common across them. The complexity arises when we try to lay that matrix upon the array of applications that exist in the real world of deployment and production. In smaller companies, you usually have at least a dozen applications and often more. In larger companies, you are dealing with hundreds or thousands of applications.

    This melange spans bespoke apps running in legacy languages, proprietary third-party software and more modern open source software. There are literally millions of permutations that must be automated across dependencies, along with security and compliance regimes. In the world of Kubernetes, for example, each container requires its own Sidecar that contains configuration and management information. Kubernetes Sidecars, however, don’t have robust automation capabilities and quickly sprawl out into a mass of human-defined management instructions that can easily conflict or break down under stress.

    The upshot of this? Today we can write a small amount of code that can effectively manage hundreds of thousands of servers for Facebook. This is true to basically infinite scale. But to automate management of Facebook’s software has injected orders of magnitude more complexity.

    Fear of Application Complexity Killing Cloud Migrations

    This dichotomy has led infrastructure automation to go sideways; organizations have adopted  inauthentic automation coupled with departures from the real ideals of DevOps and agile methodologies. Many companies just aren’t realizing the true benefits of infrastructure automation because they are doing something that is needlessly complicated and may have characteristics of automation but in fact is even more complicated. Thus, they have lost the value of the word and merely exchanged one complexity for another.

    Similarly, many application development teams are doing what they call “ad hoc” infrastructure automation as DevOps teams avert their eyes and pray. Translation? A roll-your-own mishmash of tools to manage containers or VMs, applications and all the dependencies from the top to the bottom of the application runtime environment. What this really translates into is a human executing an ever-changing set of narrow paths against an individual server—a recipe for chaos. This chaos is why the majority of our customers believe infrastructure automation is a critical step to achieve agility but a smaller subset have fully embraced it.

    It’s also a major reason why many companies that would love to migrate to the cloud have not yet done so. Managing the repackaging and movement—the “lift-and-shift”—of all their applications is a daunting prospect that they rightly believe will be far more difficult than simply switching from bare-metal or VMs to instances in AWS or Azure or Google Compute Engine.

    Now, we don’t need to throw the baby out with the bathwater. The automation of operating systems and VMs and containers works just fine and is actually a tremendous improvement on past efforts. In fact, we could easily operate there with a smaller set of features and capabilities than we have to date. But applications must be managed from the top-down to accommodate the inherent complexity of managing so many more moving parts.

    Enter The New Paradigm: Top-Down Application Management

    Top-down application management works in a fundamentally different way, Rather than rigid configurations and choices about what an application should do, modern application management tools for DevOps teams should ask what an application needs to succeed and do its job well across the entire life cycle, from development to production to retirement. These tools should automatically discover changes in dependencies of an application stack, from front end to middleware to database and load-balancing and security.

    If there are changes in these dependencies or other critical factors, then those tools need to automatically rebuild and test the applications, and have them ready to deploy either as a canary or directly into production if the changes are minor. For example, if a new SSL patch is published and a DevOps team updates its underlying infrastructure, then the application management toolchain should recognize which applications need to make which changes, and how that might affect both upstream and downstream dependencies. Ultimately, the toolchain should quietly and seamlessly fix all affected applications with the patch but avoid service interruption.

    Once the success criteria of the applications are defined by a human DevOps person, then the application configuration and management tools’ job is ensure that criteria is always met. Collectively, this is a new type of packaging that captures the best of all possible worlds, merging configuration and packaging into intelligent application management that can scale and flex as needed.

    By capturing the dependencies of configuration and the strictures of traditional packaging, top-down application management methodologies and tools allow a CIO to move an aged C or C++ back-office application into a cloud-native environment just as easily as a passel of Node.js microservices backstopping a mobile application, and have them both run with the same level of continuity and flexibility. Which is really what everyone wants—a safer, easier and better way to run applications without having to worry about the underlying infrastructure.

    Conclusion

    In a sense, then, the DevOps Revolution is entering a new phase. As microservices continue to slice and dice the old functionality of monolithic apps into numerous smaller apps, the challenge of managing this app proliferation will only grow—and become more complicated.

    The way we thought about DevOps tools in the days when cloud computing was relatively young was understandably naïve and not yet informed by the vast application cornucopia we would face in subsequent years magnified by the reality that legacy applications decades old would continue to run in corporate data centers until their code keels over. Now we know and we can design an automation methodology and practices that map to our modern realities. We can do this by giving infrastructure the simple rules and tools it needs, while giving apps more leeway to be themselves and succeed regardless of what is happening at lower levels of the stack.

    — Corey Scobie

  • Perforce Acquires Perfecto Mobile to Drive DevOps Consolidation

    Perforce Acquires Perfecto Mobile to Drive DevOps Consolidation

    Perforce this week announced it plans to acquire Perfecto Mobile, a provider of automated application development tools, in a move that signals a potential wave of consolidation across the DevOps sector. Perfecto Mobile is the fifth acquisition Perforce has made in the last two years, and company CEO Mark Ties said there will be more to come.

    Schedule to close later this year, the acquisition is estimated to be about $200 million.

    The primary driver of this wave of consolidation is access to inexpensive capital coupled with mainstream adoption of DevOps processes that is requiring many startup companies to scale beyond their means, Ties said.

    As a provider of a cloud-based set of tools for automating the testing of web and mobile applications using a variety of open source frameworks, Perfecto Mobile will complement a portfolio of application testing tools based mainly on the technologies Perforce gained when it acquired PRKA earlier this year. Perfecto Mobile currently has more than 3,000 customers.

    Application testing, along with application development and deployment, increasingly is shifting to the left as developers assume more responsibility for the overall application environment. Instead of relying mainly on a dedicated team to test applications after they have been developed, companies now are continually testing modules as they are developed. Sometimes that’s done by the developers themselves, while other organizations prefer to maintain testing teams made up of individuals who did not write the code being tested. Proponents of the latter approach contend that approach leads to higher-quality code because the individuals testing the code are not as invested in how the code was written. Of course, in an ideal world, an organization would be able to embrace both approaches.

    Regardless of the approach taken, the one thing that is clear is that the rate of at which applications are being developed requires more reliance on automated testing than ever. Not only are there more applications being developed, but increasingly each one is made up of microservices. There often are multiple versions of those microservices that are subject to frequent change. To make matters even more challenging, the number of dependencies between microservices that make up an application are increasing exponentially. That means the days when organizations could rely mainly on manual testing are coming to an end.

    There may come a day when machine learning algorithms are able to play a bigger role in automating application testing and DevOps. But for now, that day is still far off. In the meantime, most organizations are still incorporating multiple approaches to automated testing into their application development processes. The issue is no longer so much about whether to automate testing as much as it is to what degree.

    In the meantime, the more acquisitions that occur across the DevOps landscape, the greater the validation of DevOps becomes as vendors scramble to extend portfolios that, in many cases, are still optimized for legacy approaches to building and deploying applications that increasingly are falling by the wayside.

    — Mike Vizard