Category: Application Performance Management/Monitoring

  • Splunk Dives Deeper Into Observability

    Splunk Dives Deeper Into Observability

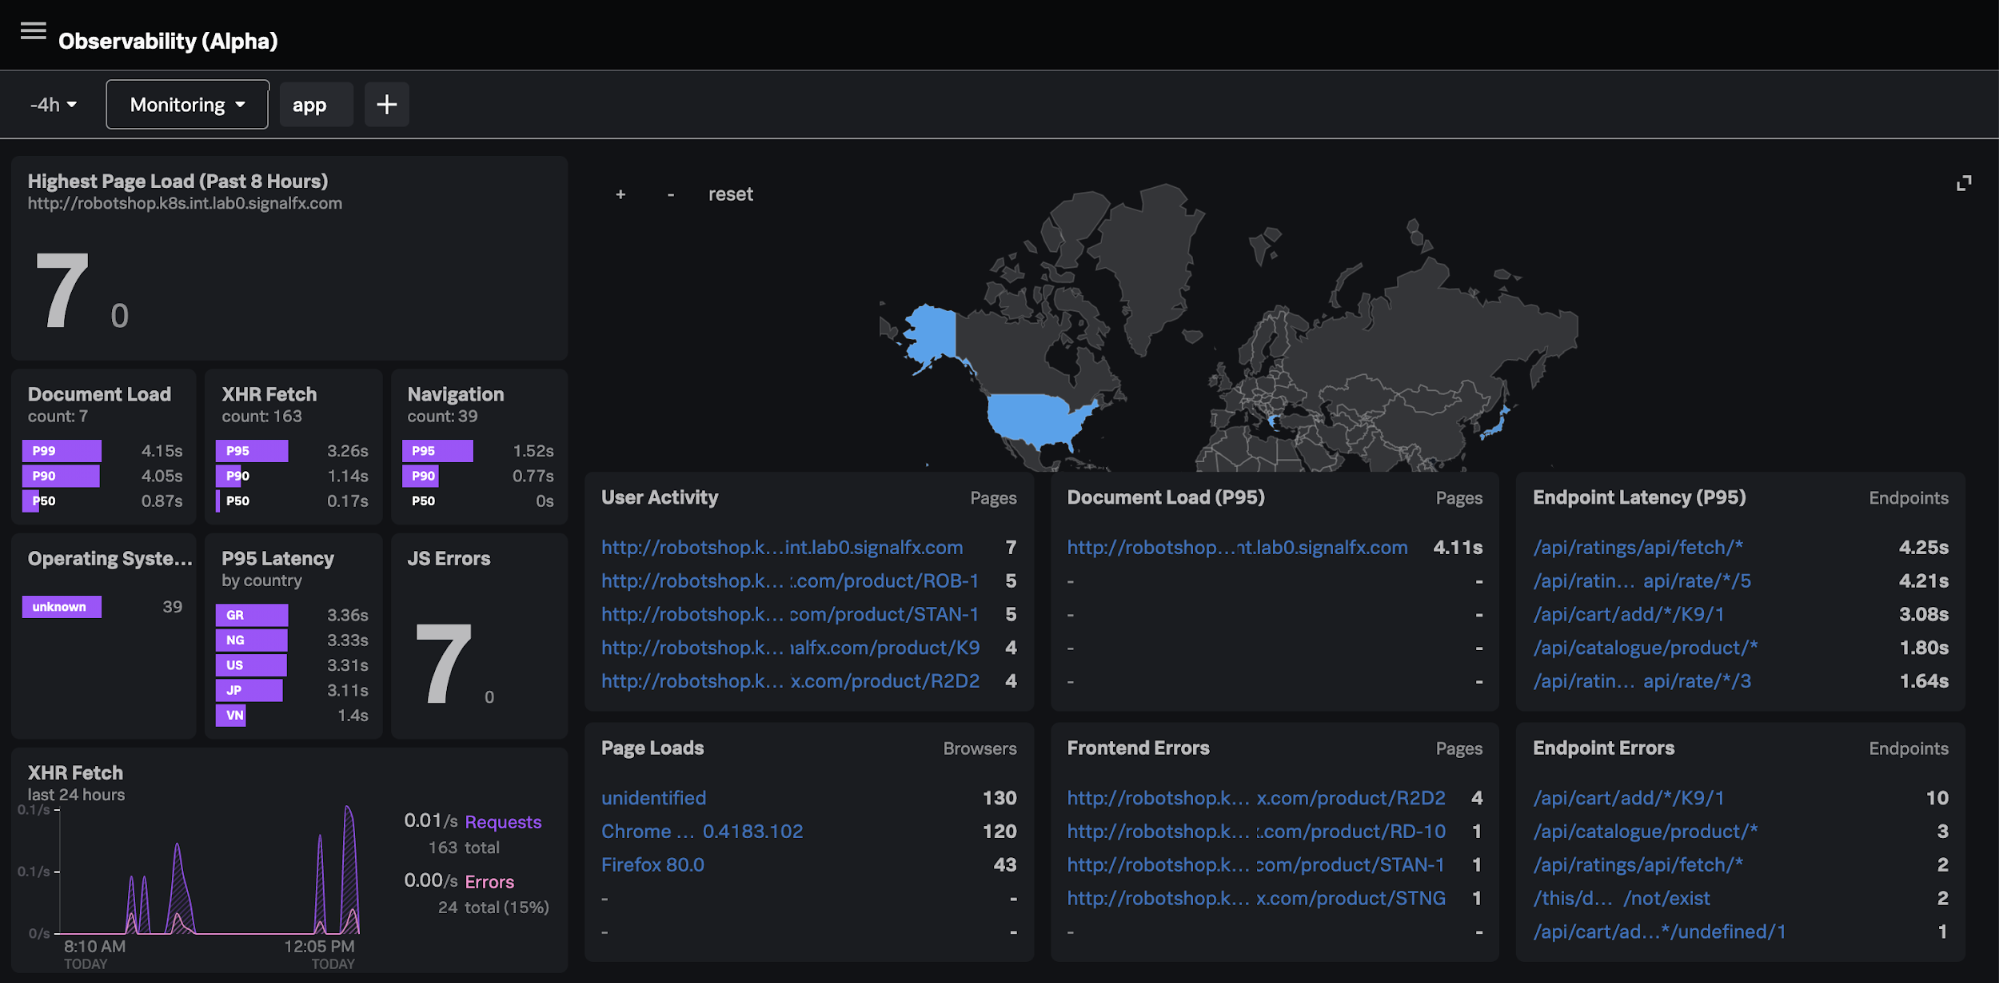
    Splunk, during its online .conf20 conference today, launched the Splunk Observability Suite, which combines tools for infrastructure monitoring, application performance monitoring, digital experience monitoring, log investigation and incident response in a single offering.

    Kia Behnia, vice president of ITOps for Splunk, said IT teams can correlate metrics, traces and log data in real-time to go beyond simply monitoring IT platforms to also include the end user experience. As part of the Splunk Observability Suite, Splunk is making available in beta Splunk Log Observer, a cloud-based service for visually inspecting logs and sending messages to DevOps platforms based on events being observed by Splunk platforms, and Splunk Real User Monitoring, which extends the reach of Splunk Application Performance Management(APM) platform to add a module that tracks specific end user application experiences.

    That critical because without end user monitoring capabilities an observability platform will lack crucial context, said Behnia, noting observability needs to start with IT infrastructure and then extend out to encompass the actual end user experience.

    Splunk this week also announced enhancements to Splunk Cloud and Splunk Enterprise, which are now based on a version 8.1 of the core Splunk platform that is now generally available. The company is also making available in beta a Splunk Machine Learning Environment (SMLE) to makes it easier to build and operationalize machine learning models and algorithms.

    The Splunk Data Stream Processor (DSP) platform is also being updated later this year to add support for cloud services such as Google Cloud Platform (GCP) and Azure Event Hub along with support for lookups and machine learning algorithms.

    Splunk is also making available a beta release of a Splunk Operator for Kubernetes to simplify deployments along with making Splunk Cloud available on GCP.

    The company is also updating Splunk Connected Experiences to include a Splunk Augmented Reality capability that adds a remote collaboration feature that allows users in two different places to interact and visually compare data.

    Splunk TV, a mobile application for analyzing IT operations trends, is now also available on Google Android as well as Apple. Users can now also centrally control multiple TVs without having to be connected to the same network.

    Other additions to the Splunk IT Operations portfolio include Splunk Service Intelligence for SAP, which applies artificial intelligence (AI) to these environments; an update to Splunk IT Service Intelligence (ITSI) that adds predictive analytics tools; a Splunk Infrastructure Monitoring Add-On to integrate Splunk Infrastructure Monitoring gained via the acquisition of SignalFX; and the beta of Splunk IT Essentials to provide a more curated implementation of Splunk Cloud.

    Finally, Splunk has updated Splunk Enterprise Security and launched both Splunk Mission Control and the Splunk Mission Control Plug-In Framework. The framework makes it possible to combine third-party security tools with updates to Splunk security information event management (SIEM) and Splunk Phantom security orchestration automation and response (SOAR) platforms. Initial partners include Accenture Security, C3M, Crowdstrike, Netskope, Recorded Future, RiskIQ and Tenable.

    Put it all together, and it’s clear Splunk is now pushing to extend observability in every IT direction possible.

  • APM: Helping Overcome Custom App Management Woes

    APM: Helping Overcome Custom App Management Woes

    In any economic climate, every business deploying custom apps needs to assess their APM needs to protect their business

    There are numerous use cases for custom-made apps, but only one reason they’re deployed: Something off-the-shelf just won’t cut it.

    When we launch a new kind of digital business, or if operations are far too complex for an existing commercial application, we need at least one custom app. No matter the business model—whether it’s a startup food delivery service, online shopping app or an app designed to manage a complex enterprise supply chain, we need custom apps. And this need is only accelerating over time, with the growth in deployment of custom apps exploding.

    But managing custom apps comes with complications, even before the pandemic exacerbated those complications. Custom apps are written on top of the latest architectures. In the past, app code was monolithic, of a single piece. Modern apps are built from services linked together dynamically—a series of small interlocking parts—and each of those parts is responsible for far less than previous monolithic apps.

    As opposed to the simple one-to-one relationships between applications and infrastructure, modern applications and their supporting environments present layered and nuanced arrangements from an interaction perspective.

    Modern applications (and their supporting infrastructure) never stop being dynamic. Services continuously change and are reconfigured. They are moved around and redeployed like so many LEGO pieces under robotic control. Eventually, these operations add up to hundreds or thousands or even millions of separately executable code elements. And to be clear, the custom app continues to evolve long after it’s left production. It’s an everlasting rollout.

    It’s great when it works—quick to value, easy to build and deploy. But it can be terrifying when something goes wrong because of the increased complexity, heterogeneity and dynamism. And the entire operation must be managed—by you, while you work from home.

    2 Scenarios Brought on by COVID-19

    Custom applications generally must be highly available. They must provide an engaging user experience, which translates into end-to-end application performance—even when demand is unpredictable. The negative consequences of bad performance include lost revenue, market share, customers and degradations in the company’s market reputation.

    Multiple new scenarios are occurring as a result of the COVID-19 era.

    Here are the salient two:

    COVID-19 Accelerates Unpredictable Demand

    From a performance standpoint, the biggest challenge right now is unpredictable demand. Unpredictable demand for transactional work from applications causes bottlenecks. Bottlenecks, in turn, bring about slowdowns or outages.

    Add to that, some apps not considered business-critical before this crisis are now far more important than even a few months ago. Creators of software designed to help businesses carry on—such as video conferencing software—are experiencing high demand. While it’s good to experience success, it’s also chaotic when the spike is unexpected.

    Unpredictable demand leads to slowdowns. It’s not easy to gather the team together and figure out why customers are reporting, “your website is slow,” or “some things aren’t working.” Your remote web application support team (which might be your e-commerce support team for a revenue-generating site) has no idea how to start solving these problems based on general descriptions of the issues.

    Meanwhile, other apps that were once in demand, such as travel sites, are nearly idle. The staff at these companies are likely creating busywork, wondering how long this new paradigm will last. Eventually, someone will need to cut costs.

    COVID-19 Makes You Cut Costs

    The worldwide economy has taken a massive hit. I’ve been around long enough to see this trend three times: When the economy flops, companies slash costs—and they tend to do it with an ax, not a scalpel.

    If you have a travel site, demand is down. How can you tell where to cut costs? How can you identify exactly how much infrastructure resource is needed to support decreased demand? And can you safely dial back subscriptions for cloud resources such as Amazon or Azure?

    Manage the Crisis With APM

    To manage during these times, you must measure what you must manage. You need application performance management (APM), a class of monitoring focused on the performance of the application itself, the users of the application and the complete infrastructure stack supporting the application.

    APM Monitors for the Unpredictable

    APM focuses on application availability (is it up), performance (response time and latency), throughput (calls per second or transactions per second) and the error rates of the application’s transactions. It does so fully cognizant of all supporting infrastructure, whether on-premises, hybrid or full-on public cloud.

    If your site is “running slowly,” you can use APM to discover if the problem is affecting everyone all over the world or only in specific geographies.

    APM’s synthetic transaction checking allows you to look at the transactional performance and availability of your web applications from the perspective of web application users. APM’s code profiling and transaction tracing allow complete visibility into the performance of all the elements of the application itself, the services of which it is comprised and how they interrelate to compete for underlying infrastructure resources. Finally, APM’s log management enables marrying events and issues related to applications and infrastructure to the end-to-end application performance picture. Together, this provides a comprehensive picture of performance and availability—from the end user all the way down through all elements of the infrastructure, the application and service, down to a specific line of code.

    Stay Cost-Effective With APM

    APM shouldn’t be expensive to procure and maintain. It shouldn’t consume valuable developer resources to implement and maintain in production.

    First-generation APM tools were pricey and difficult to use, mandating specific application developer expertise and involvement during application development. Thus, companies reserved APM only for apps important for reducing management complexity and the risk and costs associated with poor availability or performance. Luckily for business, most of those high-priced vendors have transitioned to modern architectures and are now pure-play SaaS.

    Next-generation APM isn’t difficult. Nor is it necessarily expensive. It also protects revenue by protecting and enhancing the online business results of the company—including online revenue, customer satisfaction, market share and company reputation.

    If you have a CI/CD process through which you’re always pushing new releases into production, the APM tool should be able to help. It should be able to automatically adapt to new releases as they’re deployed, without requiring any manual reconfiguration. If you’re using either a canary or a blue/green deployment process, the APM tool should also provide you the crucial information you need to decide whether to proceed with each release (or roll it back).

    And if demand is down for your site, APM can identify precisely how much infrastructure resources are needed to support your decreased demand, allowing you to safely de-provision and save money by dialing back subscriptions for cloud resources at Amazon or Azure. APM leads to savings.

    Getting Started With APM

    Before deploying APM, inventory all your apps. In my experience, companies often break down their apps into two or perhaps three tiers.

    For tier-one apps, money is no object. They must instrument the application because it’s their business. If you are a financial site where 85% of your revenue is associated with your online retirement information system, it’s mission-critical. You’re going to instrument every aspect of that application. You have no choice.

    Meanwhile, tier-two apps may have become critical because of the crisis. Or, those apps have not been instrumented because of APM’s reputation for cost and complexity. Now that its threshold of complexity—and costs—have been significantly lowered, it’s time to instrument those apps.

    There may be a whole new class of risks to your business model because of COVID, which makes today an excellent time to reassess what’s newly important to your business and what’s not.

    We’re at an inflection point, and every business deploying custom apps needs to assess their APM needs to protect their business, whether they’ve been adversely or positively affected by this crisis. It’s time to instrument your apps and stop running blind.

  • Survey Uncovers Issues Even With Advanced IT Teams

    Survey Uncovers Issues Even With Advanced IT Teams

    Even in the best of times, IT teams struggle with myriad issues related to managing their application environments

    A survey of 1,000 C-level executives at software-as-a-service (SaaS) application providers finds that while the bulk of respondents are “highly confident” or “confident” that their cloud applications were running efficiently (91%), many also are still concerned about staying within budget (65%), maximizing resources (62%) and maintaining uptime.

    Results of the survey conducted by Opsani, a provider of tools for optimizing cloud applications based on machine learning algorithms, suggest that even the most advanced IT organizations are finding it challenging to optimize application performance within the constraints of their IT budgets.

    Amir Sharif, vice president of marketing for Opsani, said most SaaS providers have already optimized complex application environments to the greatest extent possible by a team of humans no matter how mature their DevOps processes. The next level of optimization requires artificial intelligence (AI) capabilities that can discover, correlate and analyze real-time events and dependencies at levels of scale no human can match, he said.

    Within the most advanced IT teams, all the tasks that can be automated easily have already been completed, added Sharif. As IT environments become more complex, optimizing the IT environment requires platforms capable of instantly implementing policies and procedures defined by the IT team. That shift doesn’t eliminate the need for a DevOps team, but rather a shift in their role to define the policies that need to be automated, he said.

    The Opsani survey finds 43% of respondents update software daily and 37% release new software weekly. Only 15% said they conduct hourly sprints. The top concerns among respondents are employees wasting time on mundane tasks (54%), followed by finding talent (47%) and legacy processes that don’t reflect today’s technology landscape (43%).

    When asked how often their organizations optimized their application stack, 82% said they do so regularly, with 81% reporting their organizations already make use of AI tools for faster decision-making.

    When asked about service level objectives and performance goals, respondents cited transactions per second as their top metric (63%), followed by latency (47%), dollar per transaction (43%). IOPS and throughput tied for fourth (34%).

    Sharif said resistance to AI in general is declining in most IT organizations given the level of complexity faced. A 10-tier microservices application and a backend database developed by Google has more than 75 quintillion configuration permutations that must be adjusted. The average IT team might never attempt to deploy something that complex, but even comparatively simple microservices-based applications can have millions of configuration permutations that can adversely impact performance and security.

    Of course, most C-level executives are likely to think highly of their organization’s IT capabilities. The rank and file, however, make assessments that are a little less rosy. The challenge is, not many IT teams have a lot of insight into how well anyone else is doing. It may be cold comfort to see that even advanced IT teams are struggling with issues.

    However, most teams that are driving revenue-generating applications for an organization will have access to more advanced IT tools a lot sooner than the average enterprise.

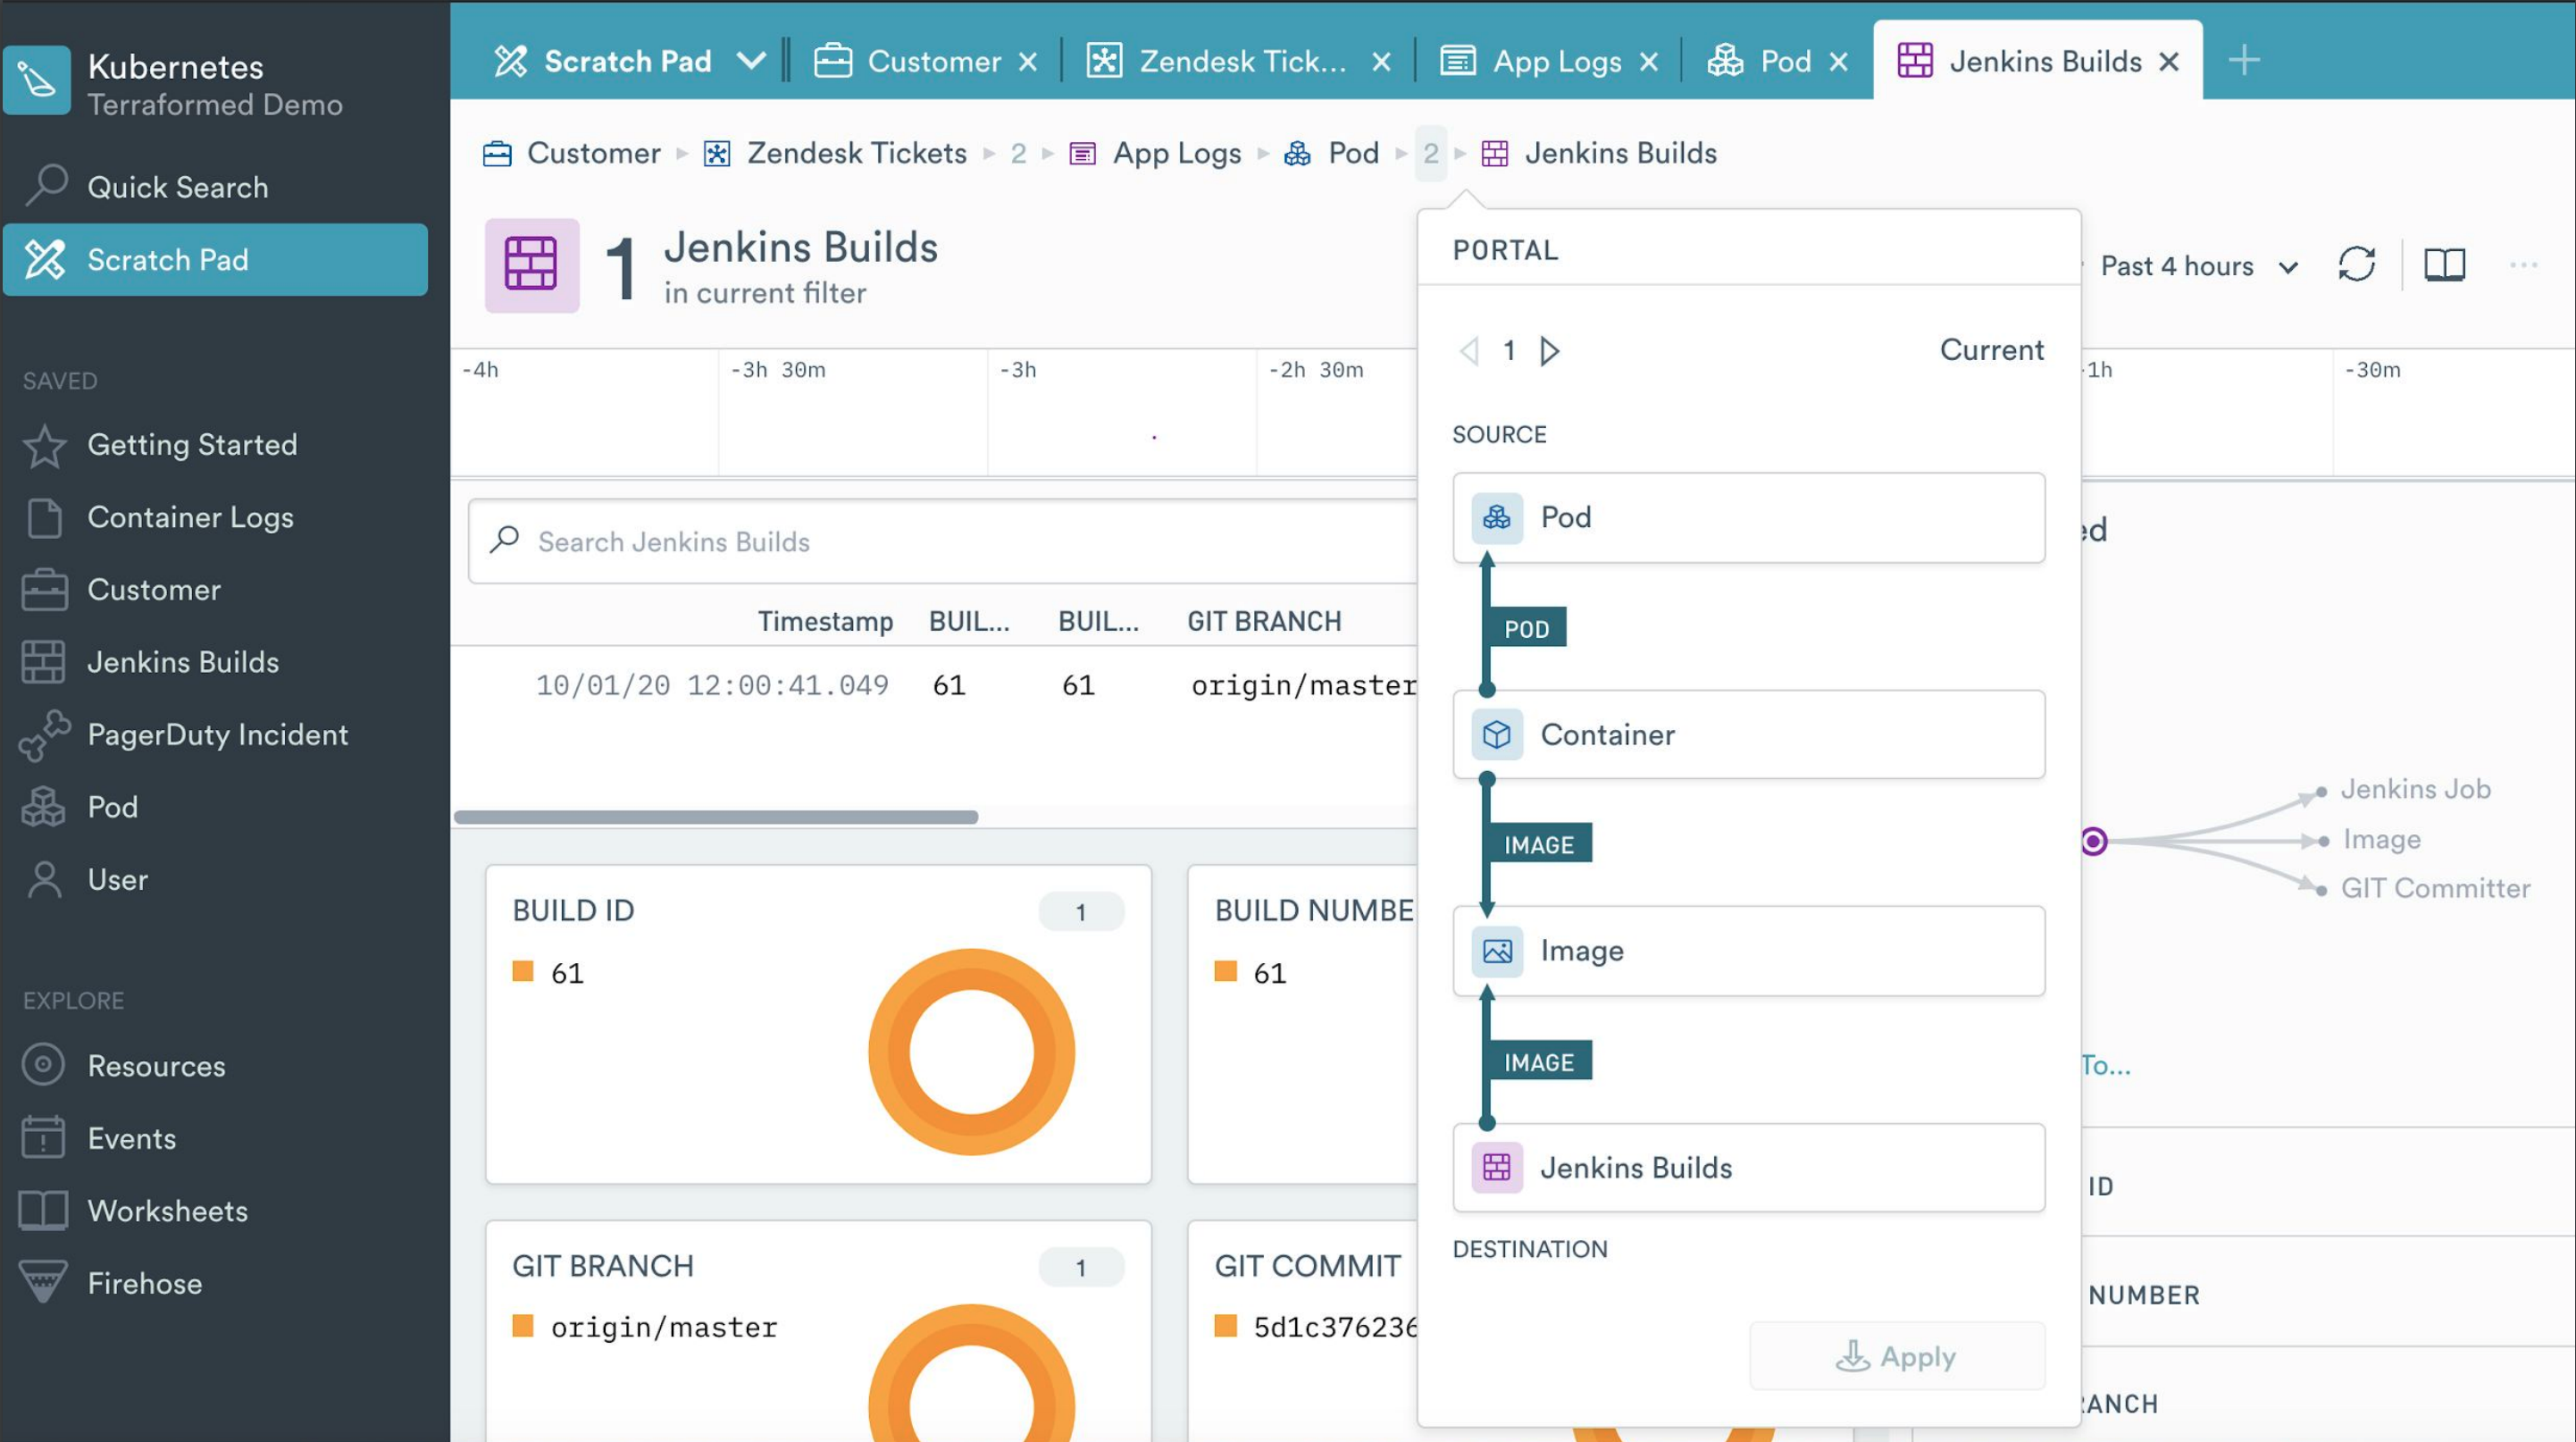
  • Observe Unveils Observability Platform Built on Snowflake DBaaS

    Observe Unveils Observability Platform Built on Snowflake DBaaS

    After raising $35 million in seed funding, Observe Inc. has emerged from stealth with early access to a namesake observability service that leverages the database-as-a-service (DBaaS) platform created by Snowflake Inc.

    Company CEO Jeremy Burton said rather than build another data lake platform, it makes more sense to make an observability platform available using a software-as-a-service (SaaS) application model based on an existing cloud service.

    Burton said Snowflake, which is based on a relational database running on the Amazon Web Services (AWS) cloud, has already proven it can scale to ingest logs, traces and metrics. The Observe platform leverages that platform to correlate that data to monitor application and infrastructure environments in a way that provides more context than legacy tools that monitor software components and infrastructure in isolation.

    The context is achieved by creating a “resource” to represent, for example, a user, a session, a shopping cart, a pod, a container, a help-desk ticket or a build. Observe then enables IT teams to also track relationships between resources in a way that the average IT administrator can query without having to tag each resource, said Burton. IT teams can also track how the attributes of a resource change over time, which Burton noted can be employed to reconstitute the state of an entire IT system at any point in time.

    That approach can be applied just as easily to existing monolithic applications and emerging microservices applications because all the data required is ingested into the Snowflake service without requiring IT teams to first instrument and then update each application, added Burton.

    The pricing model for Observe will be based on the amount of data stored in the AWS S3 bucket and the number of queries launched. IT teams will purchase Observe credits that are billed only when the platform is actually used, noted Burton.

    While observability is a core tenant of best DevOps practices, Burton said there is a need to democratize observability in a way that allows any member of an IT team to troubleshoot any issue. There shouldn’t be a requirement to assemble every member of an IT team to diagnose an issue, said Burton, noting over time, that just aggravates developers who don’t really need to deal with, for example, an infrastructure issue.

    IT teams will be provided access to dashboards that enable novice or intermediate users to quickly ascertain the root cause of an issue, while more seasoned engineers with be provided access to worksheets based on a spreadsheet-like interface through which they can manipulate data, said Burton.

    Competition among providers of observability platforms is already fierce. However, as organizations look to rationalize existing legacy monitoring tools in favor of platforms that add more context, the overall size of the observability market will be measured in billions of dollars. Each IT teams will need to decide what type of platform makes the most sense for them based on costs and their preference for one capability a vendor might have that another doesn’t provide.

  • Sumo Logic Extends Observability Reach

    Sumo Logic Extends Observability Reach

    Sumo Logic, at its online Illuminate conference today, announced the availability of a bevy of extensions to its observability and security information event management (SIEM) cloud services that span everything from hybrid cloud computing to cloud-native platforms such as Kubernetes.

    The company also announced the general availability of a free Software Development Optimization (SDO) service, a business intelligence application that integrates and analyzes data collected from multiple DevOps tools to provide insights into software development pipelines in real-time. Based on metrics defined by DevOps Research and Assessment (DORA), a research arm of Google, SDO comes integrated with Jira, GitHub, Jenkins, Bitbucket, PagerDuty and OpsGenie and can be extended to other DevOps tools.

    Sumo Logic also updated its Application Observability service to be able to consume data generated by open source Prometheus monitoring tools as well as both Telegraf and Open Telemetry agent software for collecting and correlating traces with relevant logs and metrics. Dashboards and topology and entity models also have been added to create more intuitive workflows and cross-linking among troubleshooting playbooks.

    The company also announced the Sumo Logic Multi-cloud Observability service, which provides monitoring and troubleshooting capabilities across Amazon Web Services (AWS), Microsoft Azure, Google Cloud Platform (GCP) and hybrid cloud environments. In addition, it announced the general availability of Sumo Logic AWS Observability, a service that automatically ingests, collects, unifies and analyzes telemetry data from AWS services such as Application Load Balancer, Amazon Elastic Compute Cloud (EC2), Amazon Relational Database (RDS), AWS Lambda, Amazon DynamoDB and Amazon API Gateway. It is designed to detect anomalous events, including the timeline and scale of those anomalies, and then employs machine learning algorithms to surface the root cause of the issue.

    Sumo Logic is also making generally available a Kubernetes Observability service that automatically instruments and discovers topology and entities of microservices-based applications and automatically collects logs, metrics, traces and metadata to populate preconfigured dashboards and alerts. The company also launched a Sumo Logic Web and Edge Observability service to monitor and troubleshoot content delivery network (CDN) services from Akamai, CloudFlare and Fastly, as well as similar services provided by AWS, Microsoft Azure and GCP.

    Finally, Sumo Logic has enhanced its SIEM service to add support for chain, threshold and aggregation rule types and the ability to schedule searches of specific types of security events. The reporting and data ingest capabilities of the platform have been enhanced as well.

    Bruno Kurtic, vice president of product management and strategy for Sumo Logic, said observability takes traditional monitoring to the next level because as applications are instrumented, observability becomes a property of the application. That approach provides IT teams with the context required to resolve issues faster. Existing monitoring tools are isolated silos that generate data which IT teams then must correlate on their own to find the root cause of an issue. That approach results in time wasted that could otherwise be applied to more value-added tasks, such as developing applications faster, said Kurtic.

    Fresh off raising capital by becoming a public company, Sumo Logic is differentiating itself via a more unified approach to observability that provides deeper analytics, is more secure, and affordable through the usage of credits that IT teams and purchase and apply to any service as they see fit, Kurtic said.

    Of course, Sumo Logic is not the only IT vendor aiming to take IT monitoring to the next level. DevOps teams have no shortage of observability options. The challenge now is determining how best to act on that intelligence once it’s presented.

  • Oracle Launches Observability Platform

    Oracle Launches Observability Platform

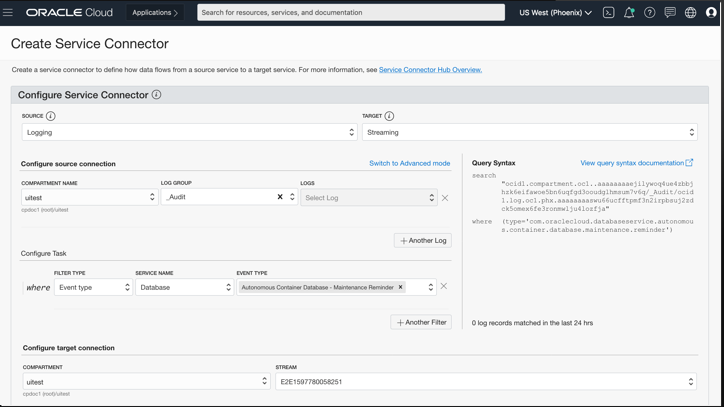
    Oracle, at its online Oracle Live event today, unveiled the Oracle Cloud Observability and Management Platform, which combines newly added logging, log analytics, database management, application performance monitoring, operations insights and service connector hub services with existing Oracle monitoring, notifications, events, functions, streaming and operating system management capabilities.

    Dan Koloski, vice president of product management for Oracle, said the Oracle Cloud Observability and Management Platform provides IT organizations with access to a unified observability platform running on the Oracle Cloud Infrastructure (OCI) service that, in keeping with best DevOps practices, offers more context than traditional monitoring tools.

    In addition to being able to observe applications deployed on Oracle infrastructure, on-premises or in the cloud, the Oracle Cloud Observability and Management Platform interoperates with Slack, Grafana, Twilio, PagerDuty and other platforms to enable organizations to craft end-to-end DevOps workflows, Koloski added. Oracle is also working toward making it possible to import and export data to open source Prometheus monitoring platforms, noted Koloski.

    Oracle Cloud Observability and Management Platform employs machine learning algorithms to automatically detect anomalies and enable remediation in near-real-time. The company has also automated the instrumentation process to the point of one-click agent deployment, he added.

    Koloski said IT organizations are moving to rationalize a raft of tools to monitor silos of applications and infrastructure that historically were employed with mixed success. An observability platform provides more context by unifying all those tools in a way that makes it easier to troubleshoot the overall IT environment, he noted.

    As IT environments become more complex, thanks mainly to the rise of microservices and containers across hybrid cloud computing environments, Koloski said a new approach to managing IT is required. Advances in observability in the form of distributed traces are also creating a need to shift IT monitoring platforms to the cloud, as the amount of data that needs to be analyzed steadily increases, noted Koloski.

    With the launch of Oracle Cloud Observability and Management Platform, Oracle is also signaling that database management is being incorporated into DevOps processes, Koloski said.

    IT teams today still spend a fair amount of time in “war rooms” trying to ascertain the root cause of an application performance issue. Observability platforms promise to reduce the amount of time IT teams need to spend trying to determine the root cause of those issues. Most of the time it only takes a few minutes to fix an issue that an IT team may have spent weeks trying to uncover.

    Of course, embracing an observability platform doesn’t necessarily mean an IT organization has embraced best DevOps practices. However, because observability is a core tenet of DevOps, it does mean a lot more IT teams will be further down that path.

  • Instana Makes Maintaining App Service Levels Easier

    Instana Makes Maintaining App Service Levels Easier

    Instana announced today it has made it easier for DevOps teams to achieve and maintain service level objectives (SLOs) for applications when employing its application performance management (APM) platform.

    Announced at the DevOps World 2020 conference hosted by CloudBees, the Instana tools provided to configure, monitor and manage SLOs are based on a series of wizards that DevOps teams can employ to create a dashboard through which they can monitor all the components that make up a specific application service. An Application Perspectives creation wizard guides IT teams through a process to select filters that eliminate uncorrelated, unconnected systems from the application service they need to monitor.

    Chris Farrell, technical director and APM strategist for Instana, said as IT environments have become more complex thanks to the rise of microservices, IT organizations need access to APM platforms designed from the ground up to monitor, tune and optimize applications that are dependent on services strewn across an extended enterprise. Instana automatically deploys sensors to each part of the application stack, traces all application requests and profiles every process without requiring IT staff to configure those agents or restart applications. Any changes to the application environment are also automatically reflected in the model of the IT environment Instana creates.

    Instana is now extending its APM platform to make it easier for IT teams to meet service level guarantees regardless of application complexity, said Farrell.

    Given all the dependencies that exist between microservices, some type of observability platform is now a fundamental requirement. Previously, IT teams tended to only employ APM platforms to monitor their most critical monolithic applications because of the costs involved. In contrast, just about every application based on microservices needs to be instrumented to enable DevOps teams to optimize performance. Microservices-based applications are designed to degrade application performance gracefully by rerouting application traffic anytime there is an availability issue. While that approach prevents applications from crashing, it also makes discovering the root cause of an application issue that much more challenging for DevOps teams.

    It’s not clear to what degree organizations that have standardized on an existing APM platform might be willing to replace those platforms as the number of microservices-based applications deployed in enterprise IT environments increases steadily. However, there are many more IT organizations that are just now starting to employ an APM platform to enable them to better cope with these applications. Most are also embracing best DevOps practices that make observability a core tenet for continuously deploying and updating applications.

    As those DevOps practices continue to evolve, most IT organizations will transition toward monitoring application services that drive a business process rather than isolated instances of monolithic applications.

    Regardless of the APM platform selected, it’s clear the way applications are deployed and managed is fundamentally being transformed. The issue now is determining how best to visualize those application environments because, after all, no one can manage what they can’t actually see.

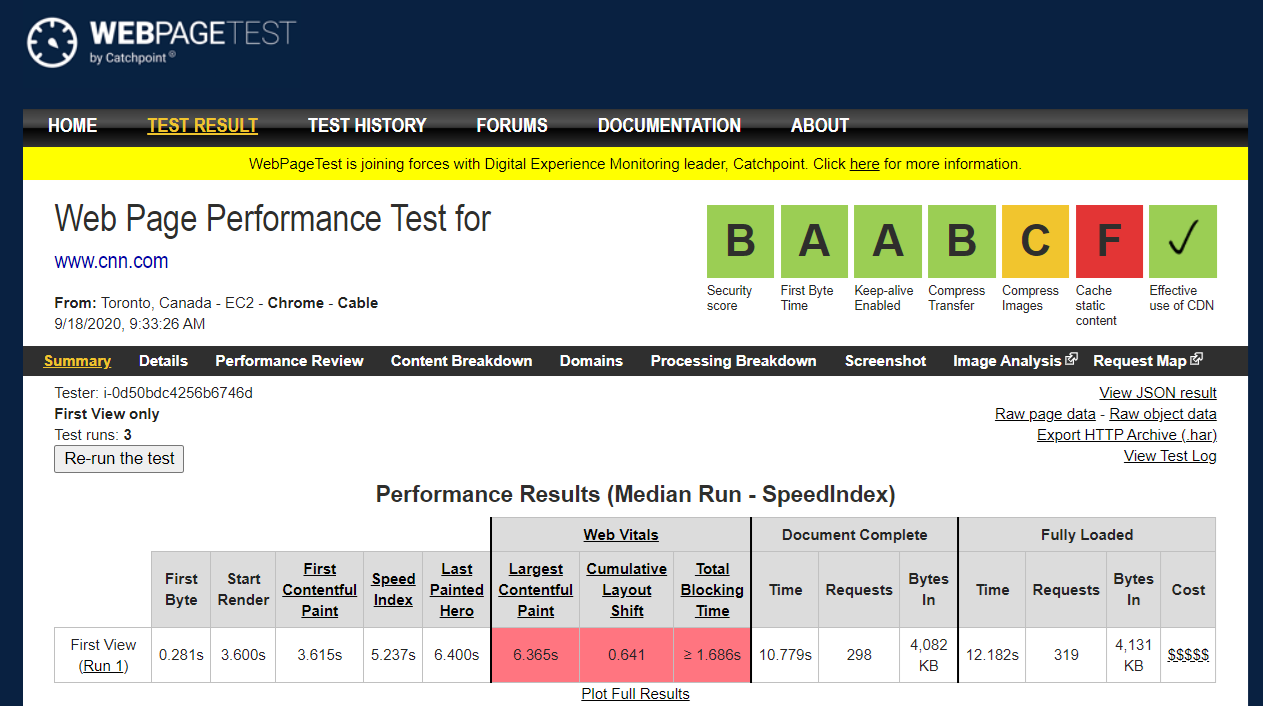
  • Catchpoint Acquires Webpagetest.org Service

    Catchpoint Acquires Webpagetest.org Service

    Catchpoint this week announced it has acquired Webpagetest.org as part of an effort to expand use of the open source web performance testing service.

    Led by Patrick Meenan, the Webpagetest service is already relied on by more than 1 million users per month to instantly run tests of websites and applications from various locations, which are surfaced via a detailed audit that can be shared with developers.

    Meenan has been personally supporting Webpagetest as a side project while working for a series of IT organizations and vendors starting with America Online (AOL). Now, with Catchpoint’s acquisition of Webpagetest.org, he will have a staff of contributors as a full-time employee.

    Catchpoint CEO Mehdi Daoudi said the company will also incorporate Webpagetest into the tools it provides for monitoring digital experiences. The most appealing aspect of the Webpagetest service is that, rather than focusing on individual backend platforms, it tracks the actual performance that users experience across multiple types of browsers.

    Daoudi said that as organizations accelerate the rate at which they are building and deploying digital business applications in the wake of the COVID-19 pandemic, there’s now more focus on web application performance than ever. The experience any user has when accessing these applications now impacts everything from their willingness to complete a transaction to their perception of the corporate brand, he noted.

    In fact, a recent survey of 200 CIOs and 200 work-from-home managers conducted in July by ReRez Research on behalf of Catchpoint finds application performance is at the top of the list of concerns (66%), followed by network reliability, work-from-home technologies and security, at 63% each. Application performance is at the top of that list because both online revenue and employee productivity are now increasingly directly impacted by the overall application experience, said Daoudi.

    There’s never been a shortage of tools for testing application performance. The issue is how those tools are often employed, he noted. Too many IT organizations are monitoring individual application components rather than the actual user experience.

    Organizations that focus on end user experience in the age of digital business will, in time, separate themselves from rivals that merely make applications available online. A zealous appreciation for application performance needs to be ingrained in the culture of the organization for it to ultimately succeed, Daoudi said, noting that every employee, not just the DevOps teams, needs to be aware of the impact application performance has on the business.

    That challenge is as IT environments become more complex and distributed, ensuring application performance becomes more challenging than ever. Cloud-native applications based on microservices may be easier to deploy and manage, but the dependencies between all those microservices can conspire in ways that degrade application performance over time. Determining the root cause of intermittent application performance issues can take weeks. The maddening thing is, many of the fixes required to address that issue once it’s discovered can be deployed in minutes.

    Performance tools that surface those issues sooner than later are invaluable in a digital age, where time now quite literally is money.

  • Instana Applies Continuous Profiling to Distributed Traces

    Instana Applies Continuous Profiling to Distributed Traces

    Instana today announced it has added a continuous profiling capability to its application performance management (APM) that makes it easier for DevOps teams to leverage distributed traces to troubleshot issues.

    Chris Farrell, technical director and APM Strategist at Instana, said that while distributed traces make it easier to identify bottlenecks, continuous profiling makes it possible to drill down into profiles to identify to identify, for example, specific CPU, memory and concurrency issues.

    Based on technology that Instana gained when it acquired StackImpact last year, Farrell said the continuous profiling capabilities are being added to the Instana APM platform at no extra cost.

    Rather than having to build, maintain and deploy a monitoring platform that can consume distributed traces, Instana is making the case for a software-as-a-service (SaaS) platform that offloads all the back-end management of an observability platform from the DevOps team, including the cost of collecting and storing distributed traces.

    Farrell said the profiling capability continuously maps individual traces directly to applicable process profiles. Whenever there is an issue, those profiles are instantly available. In contrast, rival approaches to employing distributed traces seek to replicate the bottleneck issue discovered in the hopes of pinpointing where the issue is, which Farrell noted is still a hit-or-miss proposition for DevOps teams attempting to resolve an issue. However, he said, hope is not an attribute of a sound engineering process.

    The Instana APM platform is optimized for applications based on microservices but it can also be applied to monolithic applications. However, as organizations deploy microservices-based applications dependencies become more complex, which in turn necessitates employing some type of observability platform. Historically, most IT organizations have limited APM platform use to their most valuable monolithic applications because of the costs associated with employing them.

    Farrell said the Instana platform will consume trace data generated by its own agent software as well as by open source projects seeking to reduce the total cost of instrumenting applications. Instana automatically deploys sensors for each part of the application technology stack and traces all application requests without requiring any human configuration or application restarts. It also detects application and infrastructure changes in real-time, adjusting its own models to visualize changes and assess performance impact in seconds.

    Ultimately, Farrell said the goal for adopting any APM platform should be to reduce mean time to resolution for IT teams that are increasingly tasked with managing complex applications. The challenge is that not only are there more complex applications than ever, but also organizations are more dependent than ever on applications. In the wake of the economic downturn brought on by the COVID-10 pandemic, many organizations have been forced to accelerate digital business transformation initiatives that are wholly dependent on the rate at which applications can be built, deployed and maintained successfully.

    Of course, Instana is not the only provider an APM platform racing to embrace distributed tracing to make it easier to manage application environments. The issue now is determining which APM platform won’t make its customers pay extra for the privilege.

  • Instana Discovers Root Cause of a Microservices Crash

    Instana Discovers Root Cause of a Microservices Crash

    Instana has added an automated process crash and root cause detection capability to its namesake application performance management (APM) platform optimized for microservices.

    Microservices prevent application outages by automatically rerouting application traffic in the event any microservice becomes unavailable. The overall performance of an application will degrade gracefully instead of allowing the entire applications to crash—assuming, of course, there is no single point of failure. However, the performance of the overall application will generally stay suboptimal until the microservice that failed is discovered and updated.

    Chris Farrell, technical director and APM strategist at Instana, said in the absence of an APM platform that can automatically detect when a specific process has crashed, a DevOps team can spend a significant amount of time and effort looking for the root cause. That can be especially frustrating when it turns out the microservice itself only takes a few minutes to repair, he said.

    The Abnormal Process Termination Detection capability is available at no additional charge in the agent software Instana provides for both the software-as-a-service (SaaS) and on-premises editions of its platform. Instana claims it is the first provider of an APM platform to provide this capability.

    Farrell said containers deployed on Kubernetes clusters coupled with serverless computing frameworks based on functions are driving the next wave of cloud-native applications. The inherent complexity of those applications requires a different approach to APM based on real-time analytics and distributed tracing capabilities, he said, adding relying on log data and sampling is no longer sufficient.

    When integrated with a third-party incident management system, it then becomes possible for extended IT teams to proactively resolve many application performance issues before most end users ever notice, he said.

    IT organizations are embracing microservices at scale because they need to build applications faster that are both more flexible and resilient. The challenge they encounter is microservices-based applications can become unwieldy to manage. Dependencies between microservices can create a maze of connections that can be difficult to monitor and maintain. It’s inevitable at some point one or more microservices may become unavailable because of, for example, an application programming interface (API) that has been updated or hardware failure.

    Regardless of the root cause, the sudden loss of a microservice should not result in catastrophic application failure. It can, however, adversely impact the end user experience. Most DevOps teams are committed to resolving such issues before they trigger a set of potential cascading problems that result in time being wasted in “war rooms” to diagnose the root cause of a problem. At a time when most DevOps teams are working remotely, there’s naturally a real incentive to reduce the number of virtual meetings DevOps team members might be called upon to attend. Most IT organizations are already struggling to manage complex IT environments at a time when organizations are trying to limit headcount in the wake of the economic downturn brought on by the COVID-19 pandemic.

    Of course, an APM platform isn’t going to eliminate the need for every meeting. It could, however, make the ones that members of the DevOps do need to attend a lot more pleasant for all concerned.