Category: Application Performance Management/Monitoring

  • Datadog Expands Scope of Monitoring, Analytics Services

    Datadog Expands Scope of Monitoring, Analytics Services

    Datadog, at its online Dash conference today, launched an incident management platform along with additional analytics tools to identify application errors and performance and compliance issues.

    Amit Agarwal, chief product officer, said these latest additions to the Datadog platform are intended to further consolidate IT management and monitoring. IT organizations should not find themselves acquiring and support 20 different tools that essentially all do the same thing, he said.

    The Datadog Incident Management service accomplishes that goal by streamlining incident response workflows by unifying alerting data, documentation and collaboration in a centralized pane of glass. Those workflows can then be used to create playbooks that automate incident responses.

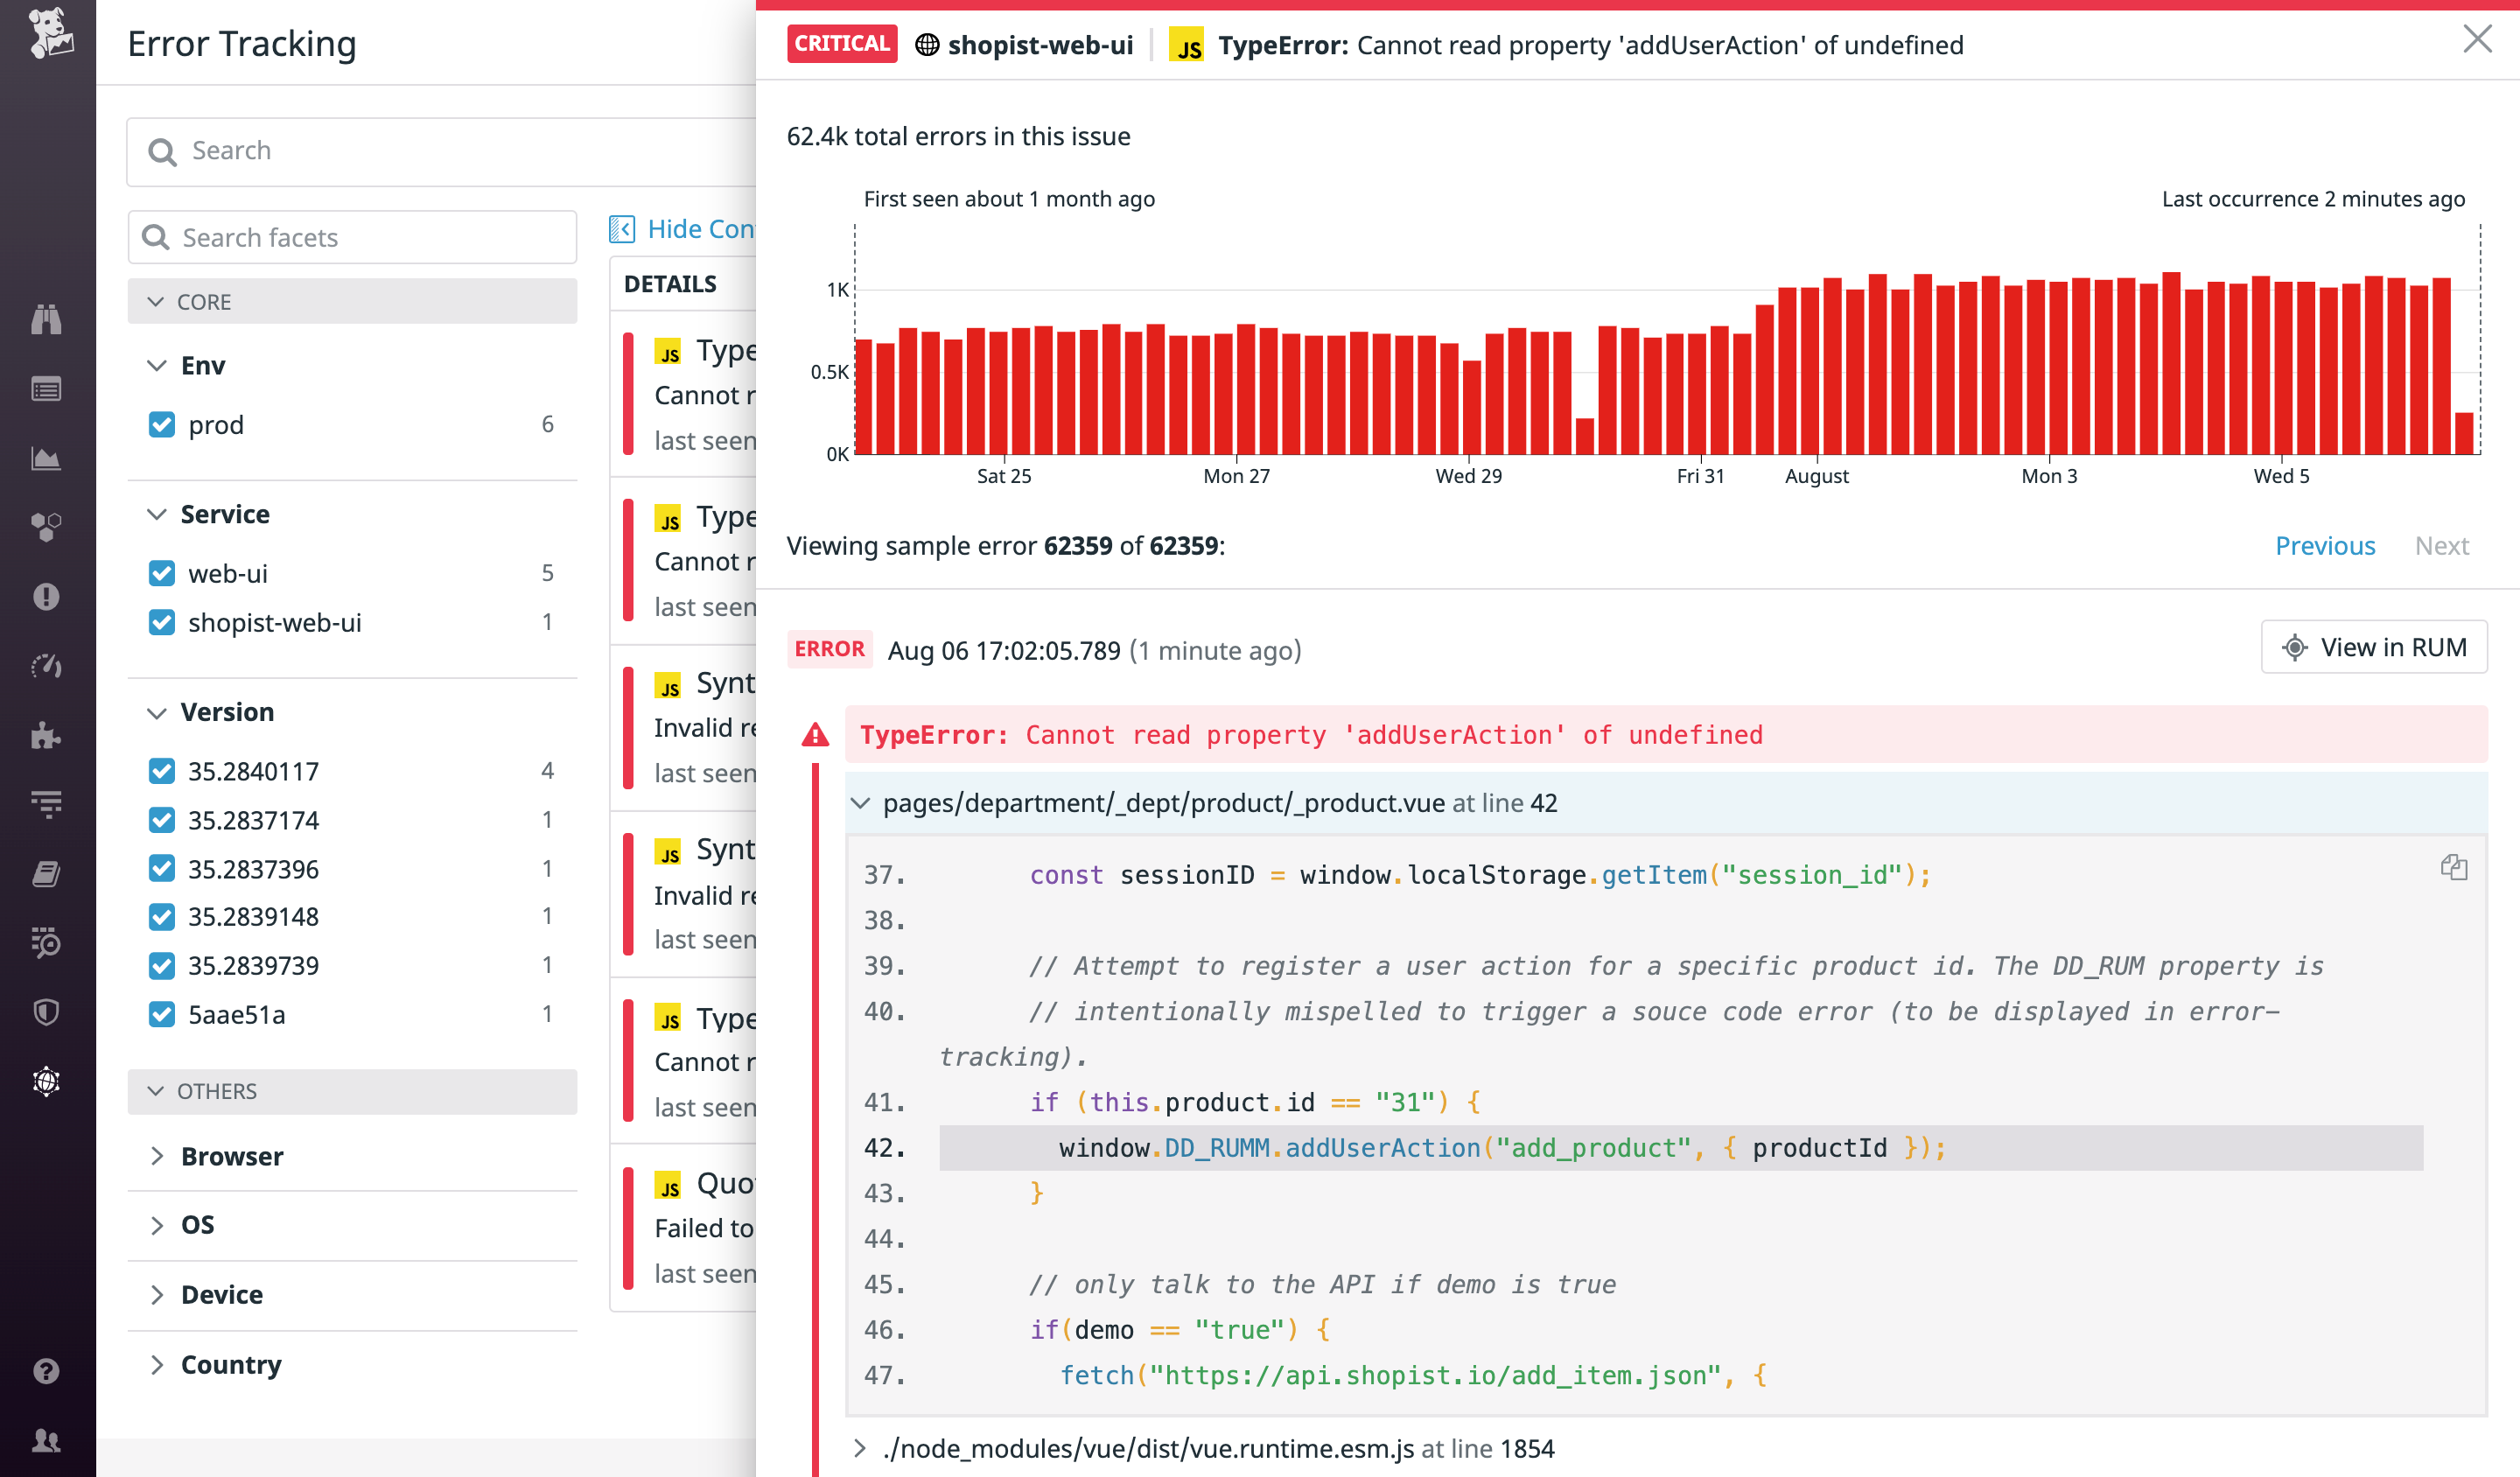
    At the same time, Datadog has made generally available Continuous Profiler, to specifically measure the performance of code in a production environment, and launched Error Tracking, which automatically aggregates all related application errors in real-time to surface actionable issues more easily within the context of a DevOps workflow process enabled by the command-line interface (CLI) that Datadog provides.

    Datadog is also launching Compliance Monitoring, a service designed to identify misconfigurations that cause compliance-issue drift as soon as they occur. Once problems are identified, Datadog Compliance Monitoring immediately alerts the DevOps team.

    Finally, Datadog has launched a marketplace to make complementary third-party applications more accessible to end customers. Participants in the Datadog marketplace include Fairwinds, Trek10, RapDev and IO Connect.

    As more organizations embrace observability as a core tenet of best DevOps practices, Agarwal said the need to consolidate monitoring tools to provide greater context is great. Those tools need to address application issues not only in IT infrastructure management but also in security and compliance requirements, added Agarwal.

    Given the cost of maintaining all those platforms, however, it makes more financial sense for IT teams to rely on a service that makes all those capabilities available via a single integrated platform, he said.

    In the wake of the economic downturn brought on by the COVID-19 pandemic, Datadog is making a case for consolidating IT monitoring and management to reduce total costs. The company is betting many DevOps teams would prefer to allocate resources to developing applications rather than provisioning and maintaining DevOps tools.

    More IT organizations are simultaneously expected to embrace unified monitoring as they make the transition to microservices-based applications. Given the dependencies that exist between all the microservices that make up a modern application, monitoring is now a requirement for almost any cloud-native application. A cloud service provides the added benefit of being able to scale monitoring infrastructure resources and up and down as required.

    Of course, Datadog is not the only provider of unified monitoring tools with the same ambitions. However, it does have a significant base of customers that provides a foundation from which it can continue to expand. The only real issue is determining to what degree organizations will be willing to consolidate management functions, given all the vested interests involved.

  • Instana Applies DevOps to APM Agent Management

    Instana Applies DevOps to APM Agent Management

    Instana has announced it has become the first provider of an application management platform (APM) to enable IT teams to automate the deployment of agent software to monitor IT environments using any Git repository of their choice.

    Jim Hirschauer, director of product management and sales enablement for Instana, said agent software used to instrument an IT environment, including software and infrastructure, can now use a Git repository to automate the configuration of agent software during startup and reboot in addition to being able to pin a specific version of Instana agent software to a branch within a Git repository.

    One of the challenges any DevOps team faces when instrumenting an IT environment is the agent software employed to collect data and metrics needs to be managed like any other piece of software. By adding support for Git repositories, Instana is making it possible to apply DevOps processes to the management of that agent software, he said.

    The ability to configure agents as code also means DevOps teams can turn on and off agents as part of an effort to reduce agent management fatigue, he added.

    By embracing GitOps practices Instana is looking to distinguish itself from rival APM platform providers by “walking the talk” when it comes to best DevOps practices, Hirschauer said.

    The ability to configure agents as code follows a recent update to the Instana APM platform that, among other things, added support for Redis Enterprise Monitoring Sensor, IBM MQ Monitoring Sensor and NGINX tracing, which automatically integrate with Instana End User Monitoring (EUM) to natively extract tracing requests.

    Although competition across the APM space is crowded, Instana as a startup is trying to take advantage of two macro trends to supplant rivals. The first is the shift toward converging the management of software and IT infrastructure. The Instana APM platform discovers all application service components and application infrastructure and then automatically deploys monitoring sensors that trace all application requests and profiles every process. It then detects application and infrastructure changes in real-time, adjusting its own models and visualizing the changes and any performance impact without requiring any human configuration or even application restarts.

    The second trend is the rise of microservices. Historically, IT teams have used APM platforms to only monitor their most mission-critical applications because of the cost of deploying agent software. However, given the inherent complexities of microservices-based applications, IT teams are employing APM platforms more broadly to monitor dependencies.

    It’s too early to say how this latest round in the APM platform wars will play out. However, there are more organizations than ever evaluating APM platforms, many of which would never have employed one before. The good news is that as open source agents become more widely available, the cost of employing APM platforms should come down. However, open source agents are still not quite as simple to configure and deploy as most proprietary agent software. DevOps teams will need to decide for themselves how much that convenience is worth.

  • CNCF Provides Jaeger Distributed Tracing Update

    CNCF Provides Jaeger Distributed Tracing Update

    The Cloud Native Computing Foundation (CNCF) has made available a report detailing the progress being made around the open source Jaeger distributed tracing software. Among other things, the report notes there are now more than 300 organizations contributing to the project.

    Jaeger is designed to provide a framework for monitoring microservices-based applications in a way that captures every interaction as part of an effort to simplify troubleshooting.

    Originally developed by Uber, Jaeger has almost 2,000 contributors. Developers from Uber and Red Hat make the bulk of those contributions., while other developers work at Ryanair, IBM, Ticketmaster and CloudBees.

    Thus far, there have been nearly 40,000 contributions, 4,300 code commits and 3,200 pull requests for Jaeger.

    Yuri Shkuro, a software engineer at Uber who created and maintains the Jaeger project, said as open source agent software in the form of OpenTelemetry, a separate sandbox-level initiative also hosted by the CNCF, gains traction, the more feasible it will become for DevOps teams to embrace distributed tracing. Currently, most DevOps teams are dependent on sampling techniques typically employed via an application performance management (APM) platform. While that approach can indicate there might be an issue, distributed tracing makes it easier to pinpoint the precise problem.

    That’s critical because many DevOps teams can spend hours, if not days, trying to identify the source of an issue that often only takes a few minutes to fix. The trade-off is that distributed tracing collects a lot more data than sampling, so IT teams will need to decide how long they may want to store that data. Most organizations will only store tracing data that identifies anomalies based on a reasonable retention schedule rather than allocating storage resources to what could become massive amounts of tracing data, noted Shkuro.

    Providers of commercial observability platforms have been embracing OpenTelemetry to provide distributed tracing services, so it’s not clear to what degree IT organizations will opt to deploy Jaeger on their own or access a managed Jaeger-based service.

    Regardless of how they are invoked, next-generation observability platforms based on Jaeger should become more affordable at a time when microservices-based applications are being more widely deployed. Given the inherent complexity of those applications, observability platforms that are a core tenet of any best DevOps practice become a requirement. In comparison, the use of ALM platforms was typically limited to only the most mission-critical applications because of the costs associated with deploying proprietary tools.

    It may be a while before every application is instrumented by default. In the meantime, Shkuro said the Jaeger project is looking to recruit additional maintainers. As is often the case with any open source project, there are plenty of contributors. IT professionals willing to volunteer to maintain a project are often more scarce.

  • Sumo Logic Expands Observability Platform Scope, Reach

    Sumo Logic Expands Observability Platform Scope, Reach

    Sumo Logic announced today it has extended the reach of its monitoring platform to provide deeper insights across application and infrastructure logs, metrics, traces and metadata in real-time.

    The latest additions to the company’s suite of software-as-a-service (SaaS) offerings include Sumo Logic AWS Observability Solution, which focuses exclusively on AWS services, and additions to the Sumo Logic Software Development Observability Solution that provide support for GitHub, Jenkins and PagerDuty alongside existing support for Jira, Bitbucket and OpsGenie. The Sumo Logic Software Development Observability Solution is based on a key performance indicator (KPI) methodology developed by the DevOps Research and Assessment (DORA) organization, an arm of Google.

    observabilityIn addition, Sumo Logic has launched a closed beta for a Distributed Transaction Tracing service based on the OpenTelemetry standard that will integrate logs, metrics and metadata. Finally, the company has added more tracing capabilities to its existing Microservices Observability Solution.

    Sumo Logic got its start by providing a cloud service for analyzing logs as an alternative to Splunk. Since then, the company has extended the scope of its services to address a wider range of observability requirements for DevOps teams.

    Ben Newton, director of field evangelism for Sumo Logic, said the company is trying to engage IT organizations at any level of maturity by providing access to a range of offerings from log analytics to observability tools for various platforms including Kubernetes. Those offerings now span the application life cycle from coding to grave, he said.

    Sumo Logic also differentiates a pricing model based on data tiers that enables IT teams to analyze logs, metrics and traces across a variety of use cases without monthly limits, peak provisioning or on-demand charges for data volume overages or exceeding custom metrics limits.

    In the wake of the economic downturn brought on by the COVID-19 pandemic, the rate at which DevOps tools have been shifting into the cloud has accelerated. With more DevOps teams working from home, cloud-based services are more flexible. At the same time, more organizations prefer to treat IT costs as an operating expense at a time when the overall economic outlook remains uncertain. The entire IT organization needs to be able to respond to rapidly changing business conditions in a more agile manner, noted Newton.

    Less clear is whether the economic downturn might also drive consolidation across what today is a spectrum of observability tools spanning log analytics to application performance management (APM) platforms used primarily to sample application traffic. It’s even less clear whether the rise of distributed tracing capabilities might reduce dependency on application sampling altogether.

    What is apparent is IT teams have never had more visibility into IT environments that increasingly are more complex. The challenge and opportunity now is determining how best to apply a wide range of observability tools to turn all that insight into actionable intelligence.

  • New Relic Makes Revamped APM Platform More Affordable

    New Relic Makes Revamped APM Platform More Affordable

    New Relic has revamped its application performance management (APM) platform as part of an effort to make observability more accessible and affordable.

    Bill Staples, chief product officer for New Relic, said New Relic One has been updated to provide a new user interface designed to make it easier to navigate and explore an observability platform that now monitors both applications and IT infrastructure.

    At the same time, New Relic has reduced costs by adding a free tier with no hidden costs or credit card required, he said. It provides one free license to 100GB of data every month. The first 100 million application transactions per month free as are the first 1,000 incident events per month.

    Initial pricing for the next level tier is at 25 cents per GB of ingest on a per-seat basis with applied intelligence priced per transaction or event.

    Staples said New Relic is further reducing costs by leveraging open source agent software to collect data, which along with the revamped New Relic One platform will make observability ubiquitous.

    The move to reduce observability costs coincides with the rise of microservices-based applications that by definition have many dependencies that need to be monitored continuously. Historically, many IT organizations have limited use of APM platforms to only their most mission-critical monolithic applications because of the costs involved. Given their inherent complexity, however, microservices-based applications require IT teams to employ an observability platform. They also drive organizations to embrace best DevOps practices, of which observability is a core tenet.

    Staples said it’s still early days in terms of the adoption of observability platforms, noting in light of their absence, most of the adoption of DevOps thus far could be described as a half-measure.

    To further that goal, Staples said New Relic One will also make it more cost-effective for IT organizations to embrace distributed tracing as an alternative to application sampling without having to incur massive storage costs. Distributed tracing monitors all requests between services with each segment recorded as a span. All the spans of a request are combined into a single distributed trace to provide a method to monitor an entire request.

    Competition among provides of APM platforms is now nothing short of fierce. New Relic today has a significant share of the market, but as demand for observability platforms continues to expand, it has more rivals than ever. In the wake of the economic downturn brought on by the COVID-19 pandemic, IT organizations are also pressuring vendors to reduce costs. The challenge IT organizations face is that while they are trying to reduce costs, they are also rolling out more cloud-native applications based on microservices that require deeper levels of observability.

    It’s unclear how the battle of the future of observability will play out. The good news, however, is the cost of proactively monitoring IT environments appears to be dropping by the day.

  • 3 Observability Strategies to Reduce Debugging Cycles

    3 Observability Strategies to Reduce Debugging Cycles

    These observability tips can help developers uncover issues that impede performance and derail customer experience

    Modern technologies and methodologies such as cloud services, containers, DevOps, microservices and serverless have made it easier for organizations to deploy application code to production. However, the additional layers within the modern tech stack have increased complexity, making it more difficult to identify performance issues and trace them back to the root cause before customers are impacted.

    While all these layers can be instrumented for observability, each of them spits out different information and for different roles. If something goes wrong, where does a developer begin to look? Maybe they get mentioned on a support ticket. Or they end up staring at high-level visualizations of systems from the various performance monitoring and logging tools. But there are graphs everywhere. There’s no surefire way for the developer to hone in on what they’re supposed to look at quickly. By standing back and eyeballing the graphs, they’ll obviously see the spike. But with all this information and so many variables, it’s not easy to pinpoint the reasons why.

    When incidents impact large numbers of customers, they could spend many days trying to find the answer. Without context into what’s causing the issue, developers spend most of this time blindly following different trails and doing things like arbitrary code rollbacks. It’s costly. Studies show organizations spend about $4.6 million annually on incident management.

    Observability: Strategies to Consider

    Development teams can save time and reduce costs by implementing three overlooked observability strategies that offer a new perspective and carry learnings forward.

    Compare Changes Over Time

    To help reduce the time it takes to trace the issue back to a specific reason, developers should look at metrics over time. Find the closest representation of an identical window of activity and compare it to a previous point in time to help spot an outlier. For example, if a development team is alerted to an incident in which customers are reporting slow response times with an application, they can compare transaction data from similar time periods to look for correlations. Data may reveal the issue is only with API calls, although individual API call times were not significant enough to meet thresholds and trigger alarms. However, comparing those API calls to those from a week ago under the same parameters—same time, same server, etc.—they discover the aggregate of the API calls is performing 20% slower.

    Looking at performance comparisons over time gives developers visibility into performance degradation before it starts to hurt a large number of users.

    Analyze User Behavior Patterns

    A development team should also evaluate the behavior patterns of individuals and IP addresses that are interacting with an application. This can provide insights that help to differentiate between external (user, browser) causes and internal causes (problems with code or a company’s systems).

    For example, consider an e-commerce customer trying to modify items in their shopping cart before checking out. The application is responding slowly to their click (it’s taking 2 seconds), so they click repeatedly. A single occurrence might be overlooked but repeated 2-second delays will add up to a significant impact. It may even trigger alerts that the database is overloaded or there’s a code problem when in reality user behaviors are compounding an underlying problem. Some log activity may look like an attack, but investigating the users impacted may reveal the root cause is actually a browser behaving unusually or a misconfigured proxy that is sending anomalous traffic.

    In either case, developers end up wasting time by implementing corrective actions that may not solve the problem. But considering patterns—viewing events that fired before and after the problem and behavior from individual users along with IP addresses—will enable developers to quickly trace performance issues back to the root cause.

    Properly Assess Impact

    Properly assessing the impact of an issue is another useful strategy that can help to determine response to an alert. For instance, if a subset of users < 0.5% are repeatedly encountering an error with an API, are unable to access the functionality (as in the shopping cart example) and are persistently re-attempting the API, you will see a spike in error rates that implies a bigger problem.

    Another example might be new functionality that has been rolled out that is for some reason incompatible with components of older accounts, such as incompatible profile information or data thresholds. As customers explore, this small subset of users will encounter the bug. It may appear as though the feature is broken when, in reality, it is a problem with some legacy data.

    When problems affect only a few customers, it is beneficial for developers to lean on monitoring tools for alerts and context necessary to resolve an issue without needing to rely on support or support tickets.

    Apply Observability Learnings Forward in Post Discovery

    For issues that impacted many users or were difficult to diagnose, development teams should consider adding a custom metric or monitor when they do their post-discovery analysis. Whatever the metric is—an extra line in a log, a StatsD metric or putting a catch around it to log the trace—it is important to capture the lesson learned and make it actionable for the future, which will save time during discovery when it happens again. Without this step, the mean time to resolution for future issues may continue to worsen as software complexity increases.

    Lack of actionable data is one of the reasons why companies spend millions of dollars annually on managing and resolving incidents. As development teams look to expand observability practices, they should first consider what puts the developer in the best position to resolve an error or performance issue quickly and ultimately deliver exceptional customer experiences.

  • Performance Issues: Looking Beyond the Infrastructure

    Performance Issues: Looking Beyond the Infrastructure

    In most cases today, resolving performance issues will require architecture changes or code refactoring

    Imagine you’re a software reliability engineer with your service-level objectives clearly laid out on your Grafana dashboard. Suddenly, an alert appears: Your 99th percentile latency is going through the roof!

    A quick glance at the relevant metrics reveals the culprit: A spike in traffic has exceeded the current system throughput. It’s clearly an issue caused by a lack of capacity, which adding a few extra instances to the cluster should solve, right? After all, more machines mean more capacity. You remain calm as the charts stabilize and the alert fades away. There’s no cause for concern; you automated the scaling process a long time ago.

    But this story could have resulted in a very different, far worse scenario. Capacity is easily accessible these days, especially in cloud environments that offer simplified scaling processes. But the ease of provisioning and scaling also incurs rising infrastructure costs.

    In many cases, handling performance issues or improving performance can’t necessarily be achieved simply by adding more machines due to application bottlenecks or resource management inefficiencies. To paraphrase a wise uncle: With greater compute power (adding more machines) doesn’t come greater performance. Unfortunately, in most cases today, resolving performance issues will require architecture changes or code refactoring.

    Optimizing the Software

    Since increasing the node count rarely helps with improving the performance, let’s explore what can be accelerated. The stack is composed of hardware, an operating system (OS), libraries and the application, among other components. Making improvements at the hardware level is not always feasible, especially when running in the cloud.

    Rather than spending more on your cloud bill, consider checking how fast the userspace code is. Application developers have a lot on their plates already, so there is only so much they can optimize. While it is possible to invest R&D efforts and time in replacing a poorly performing library with a more performant one or doing the occasional performance-focused rewrite in the hopes of resolving the issue, it’s possible neither will work.

    When fidgeting with the hardware isn’t an option and the developers are unavailable to help, another option is to attempt to address the problem at the OS level.

    A Trip Down Memory Lane

    The history of computing has not only been about smaller transistors and faster clocks. Back in the mainframe days, machines ran a single program at a time that was encoded on a punch card and inserted by a computer operator.

    Then businesspeople came along looking for a way to make computers more efficient since, during a program switch, the machines remained idle. This led to the creation of the operating system, a program that executed other programs and managed resource allocation between them. Operating systems were designed for users behind the keyboard running simultaneous tasks; therefore, they were designed to provide this illusion of parallelism by optimizing internal resource management to achieve high interactivity and fairness.

    Today, it’s not uncommon to command a fleet of generic virtual Linux boxes that are focused mainly on running a specific application, a microservice. But the OS underneath hasn’t changed much. It still behaves as if it is supposed to execute multiple programs and share resources between them, which isn’t necessarily the most efficient in such a case and doesn’t provide optimal performance for the application.

    Optimizing the OS

    There are a number of potential performance improvements that can be tested and applied directly at the OS level. Tuning sys controls can have a significant impact on the performance of many subcomponents, such as networking.

    The I/O scheduler may be worth looking into as well. For example, with databases, the default CFQ (Completely Fair Queuing) can yield results that are inferior to those of the deadline scheduler. On the other hand, a no-op scheduler allows you to avoid having to schedule I/O operations twice in cloud environments. After all, the VM’s hypervisor often manages the hardware already.

    No matter what your approach, though, constant meticulous measurement in a production-like environment (or even the production itself, if you’re into chaos engineering) is recommended. Performance tuning is a highly advanced field that requires specialistic system knowledge.

    Advanced OS Tweaks

    Some OS features are not so easily accessible for performance tuning. For example, the Linux process scheduler utilizes the Completely Fair Scheduler (CFS), which is perfectly sensible in most cases. However, it can sometimes create a significant performance gap that cannot be easily found with standard profiling tools. And even if you do discover it, you can’t simply change a parameter in one of the configuration files; rather a kernel patch and a rebuild are required.

    Let’s say you’re perfectly fine with the algorithm, but you’d simply like to state that some threads are more important than others. By default, you can’t do this, as the niceness setting only works at the process level.

    I/O-bound applications are also complicated. Even when using raw sockets and epoll, there is no runtime mechanism to provide selection logic or even a priority to the sockets in the queue. And there is no way for a kernel to know the performance budget for a request.

    Additional Means for Performance Optimization

    In an ideal world, your application will consist of purpose-built operating systems tailored for each microservice and exploiting every opportunity to boost performance and synergize with the application. In such an ideal world, the internal resource management mechanisms within the operating system will be tailored to the application-specific utility function to drive optimized performance and, in turn, also deliver reduced infrastructure costs.

    Unfortunately, we’re not there yet, and such solutions are currently only available to corporate giants who can afford to hire a few dozen people to do just that full time. In the words of William Gibson, “The future is already here – it’s just not evenly distributed.”

    So what is left to those with finite budgets? A new approach for real-time continuous optimization that enables organizations to leverage AI-driven infrastructure optimizations that are suited specifically to the running workload. Using application-driven scheduling and prioritization algorithms, it is possible to identify contended resources, bottlenecks and prioritization opportunities and solve them in real-time.

  • Sentry Adds Application Performance Monitoring to Platform

    Sentry Adds Application Performance Monitoring to Platform

    Sentry has extended the reach of its agentless monitoring platform to now track performance issues in addition to surfacing errors in code.

    Company CEO Milin Desai said IT organizations can now consolidate the number of monitoring platforms they employ to reduce their overall costs. Previously, the Sentry platform only identified errors in applications. The Sentry platform, he said, now provides a more holistic view of the overall health of JavaScript and Python applications without requiring IT teams to install and manage agent software in every application.

    Performance monitoring tools now make it possible to dynamically track application response times based on latency and throughput data. IT teams can analyze slow response times, increases in transactions and error rates to diagnose and fix all performance issues.

    IT teams can also set thresholds that generate alerts if performance metrics fall past a predefined tolerance level. IT teams can also drill down into transaction details within tracing waterfalls to visually highlight application programming interface (API) call times that are taking longer than expected.

    There is also a Transaction Summary View that sorts transactions based on slowest duration time, related issues and the number of users having a slow experience. IT teams can also track specific critical transactions in addition to gauging how users react to new code pushed to production.

    A Root Cause Analysis tool makes it possible to identify and drill down into differences in characteristics between outliers and normal performing transactions.

    Finally, a tracing capability makes it possible to identify the exact database query that caused an error or performance issue.

    Desai said Sentry requires developers to add only five lines of code to their application. As such, developers can take advantage of Sentry without requiring the help of IT teams to manage agent software. In some cases, however, DevOps teams are standardizing on Sentry because it enables performance and error monitoring to be pushed further left toward developers, who are in the best position to address an issue, he said.

    As applications and IT environments become more complex in the age of microservices, there is obviously a greater need for instrumentation. The debate is how best to go about achieving it. Many DevOps teams now find themselves managing a raft of agent software alongside every application that is deployed. Over time, the weight of all that agent software starts to impact DevOps processes.

    In the meantime, IT teams continue to spend more time looking for the root cause of an issue once a problem is surfaced than they do actually fixing it. As applications are developed in larger numbers, thanks in part to the rise of DevOps, it becomes more critical to resolve application issues faster. Otherwise, application developers will wind up spending most of their time debugging applications versus writing new code, which obviates the whole reason for investing in DevOps processes in the first place.

    Observability, of course, is a core tenet of DevOps for that very reason. The challenge is making sure observability is provided in the least frictionless way possible.

  • OpsRamp Adds Synthetic Monitoring to AIOps Platform

    OpsRamp has extended the capabilities of its namesake AIOps platform to include synthetic monitoring capabilities alongside existing tools for monitoring end user experiences.

    Bhanu Singh, senior vice president of engineering and DevOps for OpsRamp, said the Summer 2020 Release of the software-as-a-service (SaaS) platform adds synthetic monitoring that not only identifies bottlenecks across multi-step transactions but also correlates transaction performance such as page responsiveness and page timeouts with business metrics such as conversion rates and completion rates.

    By combining synthetic and end user monitoring capabilities, OpsRamp is effectively reducing the total cost of monitoring at a time when many organizations are under increased pressure to reduce costs, noted Singh.

    The OpsRamp Summer 2020 Release also improves monitoring with transaction latency breakdown for each step that contributes to user experience issues.

    It also adds visualizations for event correlations enabled by machine learning algorithms, support for HTTP response header logging for web performance insights and the ability to customizable transaction steps to provide more context.

    The OpsRamp Summer 2020 Release also adds 22 monitoring integrations for Amazon Web Services (AWS), including AppStream, Cognito, EventBridge, GuardDuty, Lex, OpsWorks and SageMaker.

    OpsRamp has added alert integrations with AppDynamics, Microsoft Systems Center Operations Manager, Sumo Logic and Sysdig. In addition, OpsRamp can now consume Sysdig events.

    Finally, OpsRamp is making it possible to access alert sequencing explainers that describe how the machine learning algorithms work. Alert sequence policy status shows model training progress at each stage of the event management life cycle.

    Singh said this latter capability is critical if IT teams are to gain confidence in AIOps platforms such as OpsRamp. In the wake of the downturn brought on by the COVID-19 pandemic, the need for AIOps has never been more pronounced. IT organizations are now under more pressure than ever to automate IT operations as part of a larger effort to reduce costs.

    The challenge they face is IT environments have arguably never been more complex. In many IT environments, the level of complexity is no longer feasible to manage IT processes manually. Automating IT processes is challenging because in most cases the IT environments have been customized extensively. AIOps presents an opportunity to employ machine learning algorithms to learn how each application environment functions and then automate it based on best practices.

    At this juncture, it’s more of a question of the degree to which IT organizations will be relying on AIOps. It may be a while before IT teams gain confidence in AIOps tools. However, with each passing day, machine learning algorithms become a little bit smarter. They may never have the intelligence of a human IT administrator; however, they never forget what they learn, require time off or quit to take another job.

    On the downside, of course, is that should machine learning algorithms make a mistake, the potential damage to an IT environment could be significant given the level of scale machine learning algorithms operate on. As such, IT organizations will always be well-advised to make sure the appropriate level of human supervision is always available.

  • How to Synchronize Jira Projects Between 2 Jira Instances

    How to Synchronize Jira Projects Between 2 Jira Instances

    Most of us are aware that Jira is a highly regarded application lifecycle management tool. One of its main features is team collaboration. Sometimes, however, collaboration between a business team and its partners can pose a challenge due to their network restrictions.

    In this article, we will see how this problem can be addressed and the available options.

    Jira Business Case

    As an external partner, we supported an embedded system customer who already was using Jira for its internal users. During that time, the customer had tight security measures in place and its IT team was unable to grant us access to its systems and tools; instead, we had to use a customer-provided laptop with VPN connectivity. This setup wasn’t efficient and led to more investment and procedures to follow when a new external user needed access, so we set out to find an alternative solution to run the business more effectively with good collaboration with everyone through the Jira portal.

    Many vendors have addressed this problem with automatic synchronization as a Jira plugin.

    Some of those plugins are:

    This article takes a look at Backbone Issue Sync and how the synchronization of Jira projects can be done between two instances.

    Backbone Issue Sync

    Backbone Issue Sync helps users synchronize Jira projects, enabling collaboration across departmental and B2B borders. Its setup and configuration are very simple compared to other plugins.

    Backbone Issue Sync is a paid plugin developed by the K15t Group. It is available in the Atlassian marketplace.

    This plugin supports the following Jira versions:

    • Jira Cloud.
    • Jira Server from 6.2–8.6.1.
    • Jira Data Center 6.3–8.6.1.

    Key Features:

    • Automatic bi-directional issue synchronization between Jira projects.
    • Control issue, comment, field and attachment mapping.
    • Map workflows.
    • Uses JQL to define issue syncing, filters and limits.
    • Sync comments and attachments.
    • Defining workflow mapping and specifying distributed responsibilities.
    • Simple setup, configuration and admin UI.
    • Performance, reliability and scalability proven by enterprise installations.
    • Full privacy and security control.
    • Synchronization of data via HTTP(S), file and email.
    • In-product troubleshooting support available.
    • Partners/vendors can sync unlimited projects and issues.

    Let’s consider we have a business team and external partner where they want to work together in a Jira issues on daily basis but they have a network restriction between each team.

    In this case, we need to set up a separate Jira instance and create a project with the same name on both sides.

    Prerequisites:

    • Install Jira on both sides.
    • Create a Jira project with the same name in both Jira instances.
    • Create a Jira user named “syncuser” on both instances.
    • Grant “syncuser” Jira permission to Browse Projects, Create Issues and Edit Issues.


    Establish a Connection Between the Projects

    1. Open the Jira Project in the first Instance, then select Project Settings > Issue Synchronization > New Synchronization. To make things simple, select Centralized Configuration (this is Backbone’s ‘default’ synchronization type and is recommended for most use cases).
    2. Set up the synchronization:
      1. Enter the base URL of your Jira in the first Instance and the base URL of the external partner’s Jira URL in the second Instance.
      2. In the Sync User field, enter the synchronization user’s username (in this example, that’s syncuser).
      3. In the Password field, enter the synchronization user’s password.
    3. On the next screen, select which project you want to synchronize with. Select the same project name in both instances.
    4. Next, assign the synchronization a name and description. When you create multiple synchronizations for a Jira project, descriptive naming is important to avoid confusion. For now, we will go with default values.

    We have established the connection between Jira projects of two different instances. Now, let’s configure what are all the data will be synchronized between the projects of each instance.

    Configure Synchronization Settings

    1. In the below step, we’ll configure the synchronization data, telling Backbone what data it should synchronize between the projects of two instances.
    2. Click … > Configure to go to the configuration UI:
    3. Click the Edit Configuration button to start configuring.
    4. On the Issue Types tab, click Start with simple mappings and select an issue type to synchronize in both directions between two instances of Jira projects.
    5. Now, map which fields should be synchronized at Fields – Mappings > Start with simple mappings.
      1. Enable the checkbox for Summary and Description field and click Create.
      2. Click the Publish Draft button to save the configuration, then select Start to start the synchronization.

    Synchronization with Backbone Issue Sync is now configured.

    Let’s verify the synchronization:

    1. Create a new issue with type Task in the first instance and enter some content in the Summary and Description fields.
    2. Open the Jira Project in the second instance: You should see that the issue has been synchronized.
    3. Open the synchronized issue and edit the summary and description in the second instance.
    4. Go back to the issue in the first instance: You should see the edits have been synchronized.

    Conclusion

    Backbone Issue Sync helps overcome the challenge of collaboration between a customer and external partners over a restricted security network. Using this plugin, many highly secured business teams are able to collaborate effectively without issue.