Logz.io announced at its online ScaleUp! 2020 conference announced today it has added support for open source Jaeger distributed tracing software to its observability platform based on a curated instance of open source Elasticsearch, Logstash and Kibana (ELK) software.
Logz.io CTO Jonah Kowall said support for Jaeger extends the reach of the open source platform by enabling the platform to consume data generated by Jaeger agent software, which is now being deployed more widely to instrument complex distributed computing applications.
Jaeger, which is being developed under the auspices of the Cloud Native Computing Foundation (CNCF), is finding traction among DevOps teams who are deploying microservices-based applications based on containers, which tend to have a lot of dependencies that are challenging to monitor and troubleshoot.
A survey of more than 1,000 DevOps and software development engineers conducted by Logz.io finds 50% of respondents have half their applications or more running in containers, with 38% using service meshes and 33% employing serverless computing frameworks. The survey also finds 87% of respondents view their main observability challenges to be Kubernetes, microservices and serverless frameworks. The most common Kubernetes difficulties cited are monitoring and troubleshooting (44%), followed by security (35%), networking (34%) and cluster management (30%).
More than a quarter of respondents (26%) said they already make use of distributed tracing, with 68% reporting they expect distributed tracing to play an important role in their observability strategy. Nearly two-thirds said they expect to implement distributed tracing in the next two years, with 91% of respondents reporting they already employ two or more observability tools. The most commonly used tools are log management and analysis (90%) and infrastructure monitoring (78%).
Just over half of respondents (56%) also noted that more than half their infrastructure now resides in the cloud, with 42% noting that cloud now accounts for more than 75% of their infrastructure. Amazon Web Services (AWS) is the most widely used cloud (66%), followed by Microsoft Azure (12%) and Google Cloud Platform (11%).
Kowall said that while interest in employing ELK along with visualization tools such as Grafana is rising to reduce the overall cost of observability, IT organizations are also making it clear they don’t want to integrate an ELK stack themselves. Most IT organizations would prefer to focus their efforts on building and deploying applications rather than maintaining an observability platform.
The rise of microservices clearly is forcing the observability hand of more organizations. Most application performance management (APM) tools use has been limited to mission-critical monolithic applications because of the cost of deploying proprietary agents and platforms. Open source platforms now present an opportunity to observe both microservice and monolithic applications at a time when the overall IT environment has become much more difficult to manage.
There is, of course, no shortage of options when it comes to achieving the observability of IT environments. The challenge now is determining how much observability is actually required and at what level of acceptable cost.
In addition, LogDNA has expanded an existing alliance to IBM to add support for instance of Red Hat OpenShift running on VMware platforms hosted on the IBM Cloud, which enables IT teams to centralize log management using LogDNA and IBM Log Analysis.
Chris Nguyen, chief strategy officer for LogDNA, said the goal is to continue to establish partnerships that will enable DevOps teams to manage larger swaths of the IT environment via a single pane of glass.
LaunchDarkly is a feature management platform that serves more than 6 trillion feature flags a day spanning 14 million mobile devices and 3 million servers. The integration between LogDNA and LaunchDarkly enables developers to rapidly iterate on feature flags using logging data surfaced by LogDNA.
Nguyen said that as IT environments continue to become more complex, more organizations are relying on log analytics to reduce the noise level being created by all the tools and platforms that make up a modern IT environment. The challenge IT organizations face is most of them can’t find or retain a site reliability engineer (SRE), so they need tools that enable developers to make better-informed decisions.
LogDNA is making the case for a log management platform deployable in the cloud or on-premises, designed for DevOps teams as an alternative to existing log management platforms that were designed for IT administrators who rely on graphical tools. LogDNA instead provides developers access to log analytics that are accessed via command-line interface (CLI) or a user interface.
It’s not clear whether or how much IT organizations may be willing to replace legacy log management platforms. However, as more organizations embrace best DevOps practices that include observability as a core tenet, LogDNA is betting those organizations will prefer an approach to log management aimed at developers rather than IT operations staff.
As DevOps teams assume more responsibility for the management of IT on an end-to-end basis, a seismic shift in IT tooling is underway. Providers of legacy IT tools are quickly shifting toward making APIs and CLIs available in response to a range of startups that are making available tools designed from the ground up to appeal more to DevOps teams. It’s too early to say how this battle for control over observability will play out, but the number of providers of tools for DevOps teams has never been greater.
In the meantime, many DevOps teams are still sorting out when best to employ log analytics, metrics and distributed tracing to optimize IT environments. The challenge these days isn’t so much being able to discover what’s occurring in an IT environment as much as it is making sense of it all.
Company CEO Diego Oppenheimer said Algorithmia Insights provides a level of observability into ML models that DevOps teams have come to expect from applications. To make that monitoring capability more accessible, Algorithmia has partnered with Datadog to stream operational and user-defined inference metrics from Algorithmia to the open source Kafka data streaming platform, from which the Datadog Metrics application programming interface (API) can consume that data.
That capability will enable DevOps teams that have adopted the Datadog monitoring platform to employ a single pane of glass to both monitor their IT environments as well as detect data drift, model drift and model bias with an ML model, Oppenheimer said.
As organizations infuse ML models into applications many of them are encountering DevOps workflow challenges. It can take six months or more to develop an ML model, which then needs to be embedded with an application that often is updated several times a month. At the same time, organizations are discovering that ML models often need to be replaced either because assumptions about business conditions have changed or additional relevant data sources have become available. In many cases, data scientists have adopted DevOps principles to create a set of best practices known as MLOps to update their models.
The alliance with Datadog is significant because it enables IT teams to start melding DevOps and MLOps processes, noted Oppenheimer.
At this juncture, it’s apparent that almost every application to varying degrees will eventually be enhanced using machine learning algorithms. Most of the data scientists that create these models, however, have little experience deploying and updating ML models in a production environment. It’s now only a matter of time before ML models become just another artifact flowing through a DevOps workflow. Organizations that have invested in ML models, however, will need to spend some time bringing together a data scientist culture that is currently distinct from the rest of the IT organization.
A recent survey of more than 100 IT directors conducted by Algorithmia finds the COVID-19 pandemic has required 40% of survey respondents to make adjustments to at least half of all their AI/ML projects either in terms of priority, staffing or funding. Over half the respondents (54%) said AI/ML projects prior to the pandemic were focused on financial analysis and consumer insight. In the wake of the pandemic, survey respondents said more of their AI focus is now on cost optimization (59%) and customer experience (58%).
The survey also notes respondents were spending at least $1 million annually on AI/ML prior to the pandemic, with 50% saying they are planning to spend more than that going forward. Overall, nearly two-thirds (65%) said that AI/ML projects were at or near the top of their priority list before the pandemic, with 33% now saying these applications are now higher on their list.
It may be a while before every DevOps team regularly encounters ML models, but at this point, it’s more a question of when rather if before DevOps processes expand to include ML model artifacts.
One of the fundamental premises of software reliability engineering is that you should base your reliability goals—i.e., your service level objectives (SLOs)—on the level of service that keeps your customers happy. The problem is, defining what makes your customers happy requires communication between software reliability engineers (SREs) and product managers (PMs) (aka business stakeholders), and that can be a challenge. Let’s just say that SREs and PMs have different goals and speak slightly different languages.
It’s not that PMs fail to appreciate the value that SREs bring to the table. Today, in the era of software as a service, features such as security, reliability and data privacy (which used to be considered “non-functional requirements”) are respected as critical features of the service-product a SaaS company delivers. Modern application users and customers of software services care a lot about data privacy, cybersecurity and uptime; therefore, PMs care, too. In fact, it’s not uncommon to see these features touted prominently on a company’s website (I saw one today claiming “99.99% uptime for every customer!”) because the folks in marketing know that customers are making purchasing decisions based on whether the company can deliver reliability, speed, security and performance quality. So, yes, PMs do care.
The difficulty lies in the negotiation between the PM and the SRE about the value of providing that level of service and the cost associated with it:
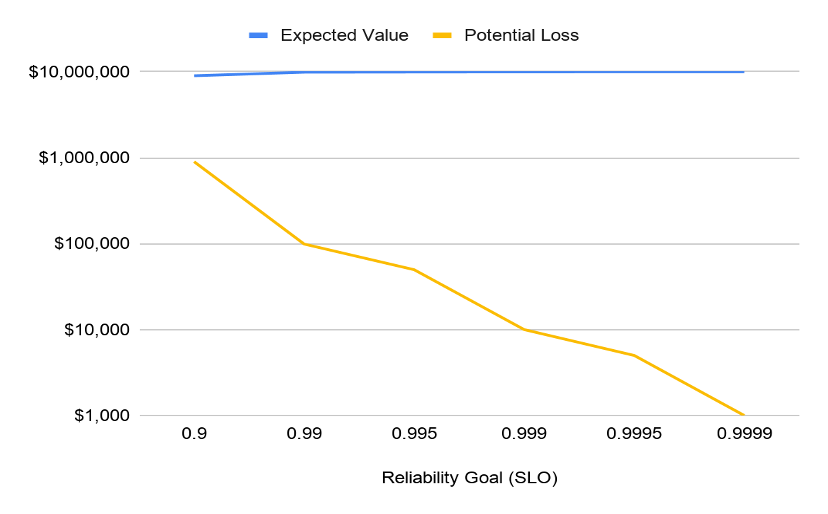
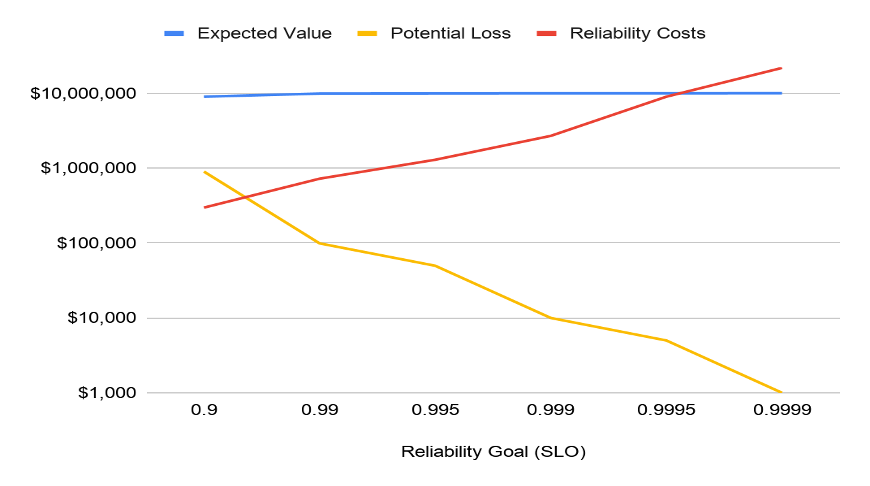
The people and infrastructure costs associated with providing the next level of reliability increase geometrically for a host of reasons, but the expected value to a $10 million business of losing out on that one in 1,000 transactions versus one in 10,000 is only $1,000.
But translating “customer happiness” into actual objectives derived from observable metrics is easier said than done, particularly for companies that are just getting started with SLOs. Let’s face it, all the talk about “nines” can be difficult to conceptualize. Fortunately, there’s an easy way for PMs and SREs to get on the same wavelength.
Engineers, stop asking your PMs for SLOs! Instead, convert user stories into reliability goals.
User stories are a great way for PMs to express a customer’s experience and expectations to the engineering team. SREs can then translate the user stories into SLOs in a few simple steps.
What is a User Story?
User stories are narratives that describe how a particular type of user engages with the service. The first-person plotline might go like this: I am this type of person, and this is what I needand expect to be happy, and if I’m not happy, this is what it’s going to cost you.
Note: In this user story, we’ve taken the liberty of including empathy for the reliability expectations of the user.
Retail example: I’m a shopper on your online store on Black Friday, and I want to take advantage of your Black Friday sale. I want to log on, peruse your Black Friday deals, pick the products and features I prefer, and make my purchase in just a moment or two. If it takes too long to log on, or if I get hung up in the system, I’ll easily get frustrated and move on to other retailers. I don’t want to miss the deals!
An SRE can take that user story, ask the PM a few questions to gather just a few more critical bits of information, then do some simple math to derive the SLO for your Black Friday.
Ask Your PM These Questions
To determine the reliability goals for a user story, you need to add three pieces of context:
Step 1 – Identify the Top Critical User Transactions
First, determine the relative priority or criticality of the transaction being successful. Not all transactions are created equally, so we need to understand what kind of transaction we’re talking about here. For example, browsing a catalog page (which could be refreshed if unsuccessful) is different from the shopper’s checkout experience.
Retail example: We have several transactions in a retail business, including:
Inventory catalog search.
Order fulfillment.
Payments processing.
Price and discount.
Checkout experience/shopping cart abandonment.
For our example, let’s develop the SLO for payments processing, which is a throughput metric—the total number of transactions a retailer can handle in a given period of time.
Step 2 – Estimate the Volume of Transactions at Various Times
Now that we know the transaction we’re talking about (payment processing throughput), we can estimate the rough volume of transactions or user interactions that will occur in each of those categories, rounded to the closest order of magnitude (see Fermi Estimation). How much of your business happens during this time? Do you have a critical time of day? Do you have a critical season? Do you have a critical day(s) of the year?
The same transaction at a different time may be more or less valuable. Think about an ad playing during the Superbowl or stock prices while the market is open. Or when your CEO is giving a critical customer presentation. Timing matters.
Retail example: Our hypothetical retailer has critical periods in the holiday shopping season and a critical day called Black Friday. Typically, 4% of annual business happens during Black Friday weekend, and 16% of annual business happens during the remaining holiday season.
Step 3 – Estimate the Business Value of Transactions in Each Circumstance
Finally, we can now understand how the reliability of this transaction affects business outcomes. This could be the risk of lost revenue or perhaps a brand reputation metric such as reduced CSAT. Now you have a pretty clear picture of the business impact of unreliability.
Retail example: If our imaginary retailer has revenue of $10 million, it would make $400,000 of that during Black Friday weekend, and $1.6 million during the rest of the holiday season. On Black Friday shopping carts are worth $100, $80 during the holiday season and $50 the rest of the time. There are 800 transactions per day on Black Friday, 625 per holiday season day and 488 any other day.
Now that you have this input, you can start to calculate appropriate SLOs based on the value at risk and the cost to meet that reliability goal.
If possible, you can estimate the cost to deliver each level of reliability. Consider not only the cloud computing and direct operational costs, but also the reliability investments in testing, performance, security, chaos engineering, release management, rollback, monitoring, on-call, automation, etc., that would be required to achieve the reliability level at each point. By plotting this cost (at least to the order of magnitude) you can find a break-even point where the value at risk and cost of reliability crossover. This is the business-justifiable SLO for these transactions.
Plot the value-at-risk as a function of value x volume x SLO. The value-at-risk will decline sharply as the reliability is increased; however, the cost to achieve this reliability also increases exponentially. It’s simply not worth investing more than that at-risk amount for any given user story, so the SLO determination is clear. Note that the SLO may not be achievable for the team currently, but you have a precise idea of what matters to the business and the break-even point of your reliability investments.
Instead of asking PMs to “speak SRE,” span the communication gap by using the common language of user stories to build business-cogent SLOs.
At the same time, AppDynamics has added a Cloud Data Collector that automatically captures data from public cloud services generated by tools such as Amazon CloudWatch from Amazon Web Services (AWS).
Finally, AppDynamics has added a visualization interface optimized for monitoring cloud-native applications and integration with Cisco’s Intersight Workload Optimizer tool, which organizations can employ to better optimize IT infrastructure resources usage to reduce costs across a hybrid cloud computing environment.
AppDynamics CTO Ty Amell said the need for deeper levels of observability into IT environments has become more pronounced in the wake of the COVID-19 pandemic. Organizations have launched multiple digital business transformation initiatives that depend on the ability to correlate events occurring in IT environments in real-time. To provide that capability AppDynamics has been investing in machine learning algorithms to analyze data that can now be more easily collected, he said.
Cisco, meanwhile, has been investing in various machine learning technologies to automate the management of compute, networking and storage infrastructure, which Amell said also serves to provide deeper insights into the overall IT environment when combined with the AppDynamics platform.
The shift toward a more holistic approach to observability justifies Cisco’s acquisition of AppDynamics, which provides a widely used APM platform. However, much of that shift is being made by DevOps teams, where roles tend to be a lot more conflated than in traditional IT environments. Nevertheless, Amell noted the shift will continue to accelerate as IT organizations realize they can also reduce costs by rationalizing legacy monitoring tools.
As IT environments continue to become more complex, there’s no doubt the tolerance for spending days and sometimes weeks navigating multiple tools to uncover the root cause of an issue is declining. It’s especially frustrating when the root cause of an issue turns out to be something trivial that can be fixed in a few minutes.
Of course, it will be up to each organization to strike a balance between observability and automatic remediation of an issue uncovered by an observability platform. Many IT teams prefer to review changes before they are applied.
Regardless of their level of comfort with automation, the amount of metrics, logs and traces that can be collected and analyzed has increased dramatically. As more of that data is collected, the more precise the observability platform becomes. The challenge now is finding the most efficient way to instrument an IT environment as the number of platforms running either monolithic or microservices-based applications continues to expand. In fact, at this point collecting all the relevant data is still often a bigger challenge than analyzing it.
Vercel, during its online Next.JS Conf event, announced an update to its open source reactive programming framework that adds support for automatic image optimization along with access to continuous Web Vitals analytics.
Company CEO Guillermo Rauch said Next.js 10 also adds support for internationalized routing and automatic language detection and quick-start e-commerce capabilities.
Pioneered by Facebook, reactive programming frameworks are gaining traction as the need to build more interactive applications to drive digital business transformation and other initiatives becomes more critical. Vercel makes it easier to build those applications via a managed serverless cloud environment.
Image optimization becomes a problem for websites because over time successful waves of application updates conspire to slow performance. Next.js 10 gives developers a replacement for legacy HTML and browser image stacks, which support only one image size and type. Developers can automatically replace legacy HTML image tags with image components based on React that load in a progressive fashion, said Rauch.
E-commerce applications are especially “ripe for revolution,” he said—as organizations increase their dependency on online interactions in the wake of the COVID-19 pandemic, they are discovering their existing applications are not only slow but also not especially engaging. The more satisfied customers are with an application experience, the more likely they will return to that website, Rauch noted.
Vercel’s open source Next.js Commerce platform using Node.js 10 adds automation along with a data layer and reusable data primitives developed by BigCommerce to modernize e-commerce applications. Vercel is also in the process of testing a video platform built in Node.js that will be made available as an open source platform.
Finally, a Next.js Analytics module provides continuous feedback to help developers better understand how their site or application performs. Page rankings on the Google search engine site are now being influenced much more by Google Web Vitals scores, Rauch said, and the analytics module is designed to identify First Input Delay and Cumulative Layout Shift issues that adversely impact the performance of React-based applications.
Ultimately, the goal is to deliver a new generation of web and mobile applications. Organizations employing Node.js include Apple, Twitch, TikTok, Lululemon, Target, Lyft and Hulu. Companies such as Airbnb, Hashicorp, Washington Post and TripAdvisor also deploy their front-ends on the Vercel cloud platform.
It may take a while before every company has modernized their web and mobile application portfolios, but at this juncture, it’s now a matter of when rather than if. Organizations that depend on legacy HTML approaches to building and deploying these applications will find that over time, the use of their applications—and, by extension, websites—will decline. At a time when organizations are more dependent than ever on web and mobile applications to remain relevant to customers, interactive applications may soon be nothing less than a matter of survival.
If our developers have what they need to create the best possible applications, they—and our customers—benefit
Goji Investments was founded on the principle of democratizing access to real estate, business lending, renewables and other alternative investments. The idea is to allow financial service organizations to provide traditionally unavailable investment opportunities to private investors on a global scale. A critical component of the Goji plan for success is the investment platform. Not only do we make the application available as a white-label solution, it can easily integrate into other platforms via APIs. We wanted to create a modular platform that we could update in pieces when needed and easily scale up as clients came online.
High-Performance Development Teams
A major reason for Goji Investments‘ success in these first few years is our high-performance development organization, which is instrumental in building and delivering the vision of the investment products needed to generate new business. As we’ve moved from simply building our applications into making them more scalable, we’ve focused on getting the right tools in place for Ops and Dev. Of course, bonus—it makes developers happier if they have cool tools to use.
One of the things we try to do is keep our application/platform deployment process as agile as the applications themselves—constantly looking to improve and making updates whenever necessary, whether needed to deploy new technologies and applications or based on feedback from the team. The idea is to keep our DevOps pipeline operating smoothly and efficiently.
One of our key operational strategies is that if we make our developers happy at work, they will deliver better quality applications, which results in happier end users. Of course, developers like to create to come up with innovative ways to deliver great features. One roadblock to coding innovation is performing repetitive low-level tasks, so we’ve actually gone out of our way to automate whatever we can and free up Dev resources for more value-specific application development.
Automating Deployments is a Start, but Just a Start
We automate the deployment process through GitHub. Each developer pushes their own services into GitHub themselves, where it goes through a quick review process. After review (if it passes), it’s merged into the master. Any master merge triggers build pipeline execution (which is using ThoughtWorks GoCD), and this automation includes several rounds of testing: unit test and integration test followed by an automated acceptance test. Developers have the option of executing additional tests themselves when desired.
Any new master is promoted into pre-prod, which mirrors production. When changes are finally rolled into production, we use HashiCorp Nomad’s blue-green deployment capabilities—if a problem were to occur (which means it was missed in official testing), Nomad takes care of any rollback needs.
The stack is fairly straightforward: The applications are written in Java and run on a DropWizard framework in containers. Nomad is our orchestration platform. One of our foundational principles when selecting application and infrastructure technologies is the ability to automate our deployment processes. We’ve done a fairly good job of automating anything we possibly could, but automating monitoring was more difficult. Our traditional APM tool was fine for alerting us to issues such as an EC2 crash or a resource availability issue for a reboot, but if we wanted to actually troubleshoot the issue we essentially just had to examine logs and hope we could see something out of the ordinary.
As much as everyone is excited about writing data into logs, combing through those logs to troubleshoot application issues is a waste of time and valuable developer resources. After all, operating 20 different microservices that cover everything from taxes and payments to customer notification required optimization of each element of the DevOps pipelines. The last piece we added was performance monitoring.
The Value of End-to-End Distributed Tracing
There’s a great line from Jurassic Park: “T-Rex doesn’t want to be fed. T-Rex wants to hunt.” Well, developers don’t want to be analyzing log files; they want to code. In fact, they want to be creating the next great feature. To get our dev team out of the weeds, we began thinking about a different way to get—and analyze—application performance data.
We wanted a system that added observability, monitored performance, managed service levels and included visibility from our end user requests all the way into our back-end systems. Oh yeah, we also wanted all of that to happen automatically so that our developers never had to worry about anything other than their own features. Installation, agent setup, discovery, mapping, alert configuration and reporting—as much as possible without requiring human setup.
We knew tracing was critical—so much so that we avoided missing any problems by specifying a 100% solution, wanting a complete trace of every request to the application.
Troubleshooting Application Performance Problems
The real reason you buy application monitoring software is to solve problems, so optimizing our ability to find bottlenecks and eliminate them is a key component of our monitoring solution. First, like the other aspects of monitoring, we didn’t want to have to spend time configuring thresholds for warning and danger alerts. Our need was for automatic anomaly detection with event analysis. Every little bit helps keep our dev team focused on dev, not analyzing data—especially in logs.
Of course, sometimes, you can’t help it; you have to look at log data, but we wanted to be smarter about that, too. We wanted our application monitoring tool to automatically integrate log analysis tools so that all data could be analyzed at the appropriate level whenever needed.
Don’t Forget Testing
Sometimes, testing gets lost in the value of a good monitoring solution. While we weren’t necessarily looking for a testing tool, we knew if a monitoring solution could also operate effectively in test (that’s not just the ability to run in test; rather, I mean the ability to add value in the testing process), well, so much the better.
It turns out that our applications are quite complex, and that complexity can create lengthier test cycles—commonly in this scenario:
We recently released a new feature for distributing dividends. As you can imagine, this is a fairly important feature, so we wanted to ensure that it operated as desired and expected. We were especially concerned with being able to scale the feature appropriately. We set up a stress scalability test that took 20+ hours to run (essentially processing hundreds of thousands of payments).
What we didn’t count on was having to stop some way into the test for someone to either submit an optimization update or actually fix a bottleneck—getting 10-12 hours into the test, then having to halt it and restart it—over and over and over again. We started thinking we might never finish.
This is one of the pain points we hoped to solve with an automated way of monitoring. By pointing the automatic APM solution at our test environment, not only did we not have to configure anything (or even set up a special start command) but we also got almost immediate feedback on any change (both positive and negative). It also pinpointed the exact location in the code where the problem occurred, so the developer could almost immediately update their code and initiate a restart of the test. Finally, we could pick any two runs and compare their execution and performance to identify the real problem.
Two things happened:
We were able to iterate different runs ~5 times faster.
We got such great bottleneck and debugging data from our solution that we cut the runtime of the test from 20 hours to less than one hour.
Give Developers the Tools to Shine
While all employees like to succeed, developers especially love when they can rise above their challenges and deliver high-performance code. We like to give our dev team the best possible tools to help them achieve this excellence. Approaching the decision process for selecting a tool for them should be handled no differently than thinking about your end users:
Identify pain points.
Find a resolution.
Execute the solution.
For our development team, that meant relieving them of low-thought repetitive tasks that we could automate and stop making them spend their time culling through performance logs.
Making the Right Choice??
The long and short of it is that we replaced our legacy APM tool with a solution that delivers the automation we crave and eliminates the need for log deep-dive analysis to solve any problem. It also supports log analysis with various integrations, which was important to us.
We get a trace of every single call, which is important to the Ops and customer support teams—and they profile every production process automatically, which gives our developers more than enough information to take action.
Ultimately, we’ve accelerated our application delivery and update processes, streamlined testing and monitoring. And our developers are super happy that we give them the tools they need and then challenge them to make the best possible applications using those tools.
At the same time, Grafana Labs announced version 2.0 of Loki, which normalizes different structured, unstructured or JSON log formats in a way that allows DevOps teams to extract additional labels as well as enable additional filtering and grouping. IT teams are also not required to define labels in advance and store those labels in the database.
A Loki 2.0 query can also be used to directly generate an alert statement using a new distributed rules evaluation engine. Previously, Loki would have to have been configured as a Prometheus data source, which then would allow the distributed instance of Prometheus, dubbed Grafana, to generate alerts.
Tom Wilkie, vice president of product for Grafana Labs, says Loki 2.0 also serves to make the database employed to observe events in real-time smaller, resulting in faster queries. The result is an approach to analyzing log data that is significantly less expensive than legacy platforms, he said, noting DevOps teams should expect to see Grafana Labs also use Loki to address security use cases.
Wilkie said both Loki and Grafana Tempo are intended to reduce the barriers to achieving observability in a way that doesn’t require nearly as much time, effort and skills on the part of a DevOps team. Grafana Tempo supports the same Tempo data discovery engine employed by Loki and the open source Prometheus monitoring platform and the Grafana platform built on top of Prometheus. That level of integration makes it easier for IT teams to narrow in on a specific trace using open source tracing protocols such as Jaeger, Zipkin and OpenTelemetry. Users of the platform can jump from log to trace and back again easily, he said.
There is also no need to set up and maintain a separate index that IT teams must maintain, Wilkie added. In addition, Tempo is compatible with object storage systems commonly found on cloud services, so the total cost of achieving observability drops significantly compared to platforms that rely on a proprietary database, he said.
Despite observability being a core tenet of DevOps, it remains an elusive goal for most IT organizations. There is no shortage of tools for monitoring individual applications and systems, but aggregating all the data the tools generate into actionable intelligence requires a significant amount of time and effort. Loki makes it much easier to analyze the relevant logs at the right time in a way the average IT administrator can navigate without having to become a superuser of more complex platform, said Wilkie.
It’s too early to say how the observability wars will play out. The good news from an IT perspective is at least now there is no shortage of options.
I would like to share a recent case study on our organization, Logz.io, which battled a very serious performance issue, the solution for which turned out to be a small change in code but with a huge impact on all of our HTTP endpoints in our platform.
Among other topics, I’ll cover:
How we investigated and found the root cause.
Logs, metrics and tracing all together to have better observability.
How Jaeger, as a tracing tool, ease to visualize our potential bottlenecks.
How to correlate logs and traces.
Performance: Our Wake-Up Call
Some may say we are experts in observability and mainly in logging; after all, that’s what we do for a living. Once we encounter any performance issue, it should be no-brainer for us to fix it in no time.
That might be true in certain use cases, such as whenever there are few slow endpoints and identifying the root cause via logs is easy. But in practice, logs are not enough when the situation is more complicated. We’ll see this later on.
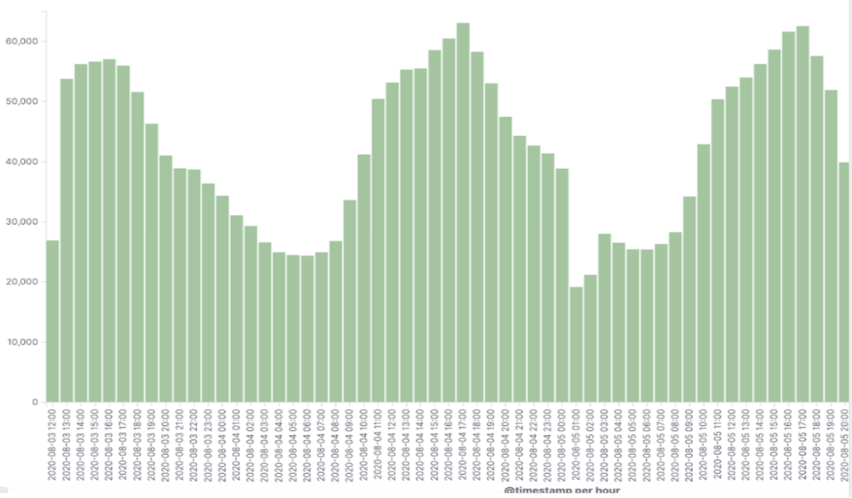
In our case, performance issues were reported especially during peak usage times—2-7 p.m. local time, overlapping between EU and U.S. customers.
We use our own product, just like any other customer, so we saw on our internal Slack channels that employees were experiencing increased latency over the same period of time.
Better Observability When Using Logs, Metrics and Tracing
To correlate users’ complaints and actual monitoring data, we usually check all three main pillars of observability: logs, metrics and trace data. Let’s have a closer look at how we used each one of them in this case:
Logs
Our log analytics product is built on top of open source ELK stack.
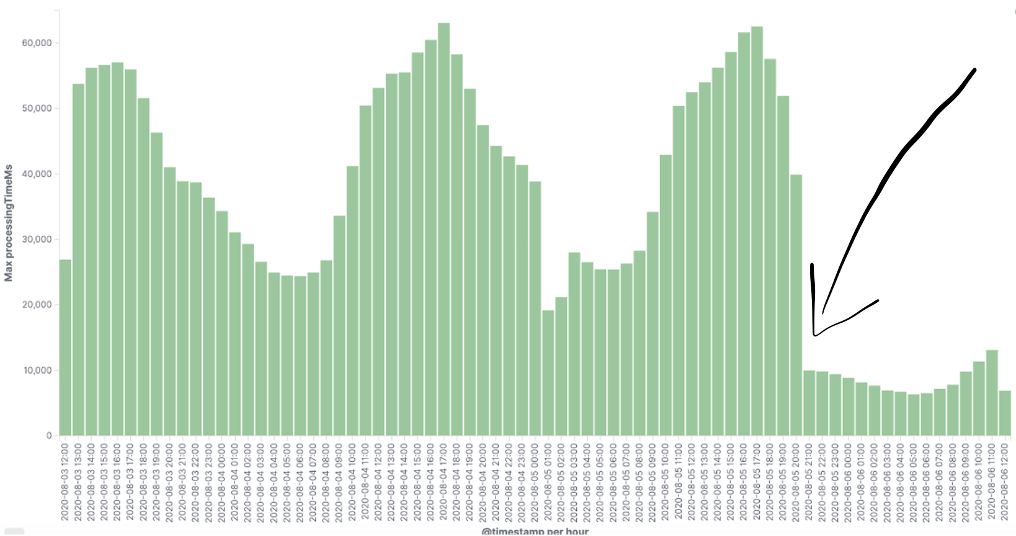
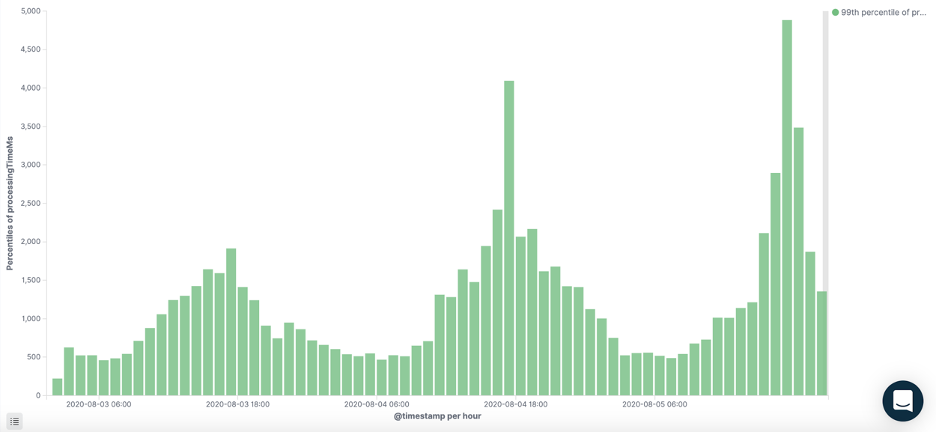
We use a custom field processingTime (the amount of time it takes for a backend endpoint to be processed) in our access logs and then visualize it over time in Kibana. That better picture can identify suspicious endpoints that take more time than anticipated in peak times. We can see below an example of an endpoint that consistently takes more time (ms) during the 2-7 p.m. window.
In addition to the processing time each suspicious request took, we saw growth in the number of requests to the microservice handling our user session tokens. Likewise, we noticed a very high load of requests during those same peak hours.
Metrics
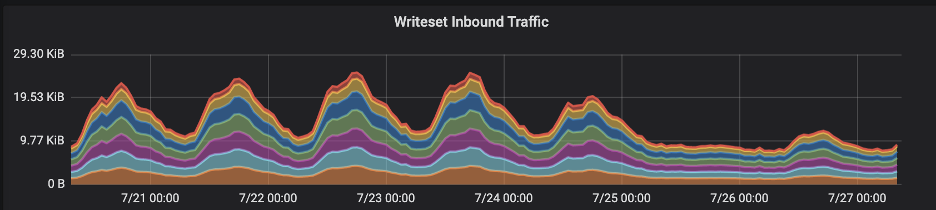
Our metrics product is built on top of open source grafana. In our backend infrastructure dashboards, we found consistent spikes in transaction commit size written into our distributed database (Galera). Those spikes correlated with the same peak times above between Monday and Thursday. Apparently, this might look pretty valid because these are our customers’ rush hours, but we’ll see later why it made us suspicious.
Additionally, we faced significant replication latency in our database cluster during the same period:
Distributed Tracing
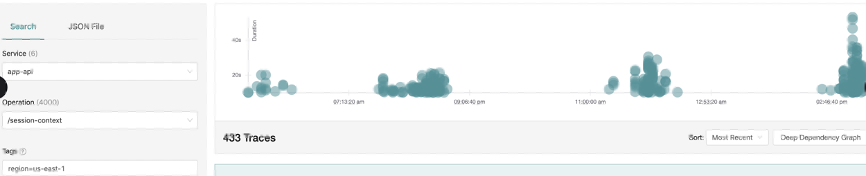
Last but not least, our tracing product is built on top of open source Jaeger. We checked for patterns of high latency by filtering out requests that took less than 5 seconds. Again, slow requests popped up more during peak hours.
Each type of representation of data has its own benefits, so with using Logz.io it was very easy to correlate all data and navigate between them to find the performance bottlenecks.
One of the must-have features to correlate logs, metrics, and traces is using the trace-id common tag. Alternatively, in lieu of it, another common tag such as request-id matches these requests throughout all of our microservices together.
Performance Investigation Deep Dive With Jaeger
As we already discussed, our goal was to find what made our application slower than usual during peak hours. We needed to trace our application flow to find out where the performance bottlenecks were. More importantly, we can track how we got there, i.e., find the request flows that led us to the suspiciously slow span. As modern microservice-based applications boom, it gets more difficult to trace things manually, by adding dedicated logs of before and after any needed code block. Moreover, it makes the code cluttered and unclear with unwanted log lines.
In our case, Jaeger made our life much easier. Especially for a new developer in the company who was not fully familiar with all of the involved components, it was easier to understand the business flow by identifying long-running spans before changing any code (which takes much more time).
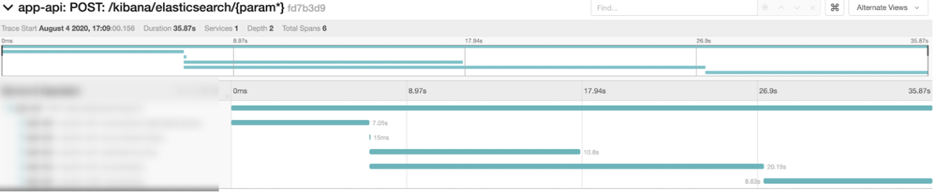
So, if we could point to the exact places in our code where performance bottlenecks, it would be super easy to fix it in no time. However, our case was a bit different. Virtually every endpoint in the back end was suffering at peak times while firing a search request:
Peak hours trace
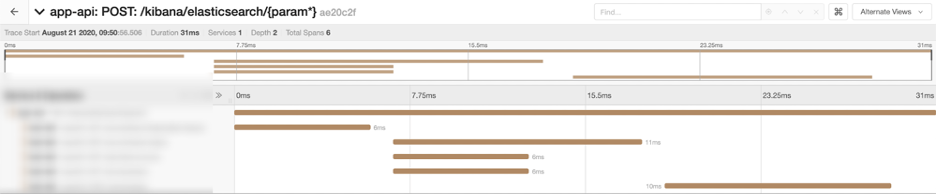
Normally with slow search queries the suspicion falls on the database, in this case Elasticsearch. So, we correlated the above span from the POST /services/query request with our logs and realized that the actual Elasticsearch query only took 15ms! So, we were able to rule that out.
It’s important to emphasize that in non-peak hours, these microservices take 10 milliseconds at most:
Off-hours trace
As we can see, that looks way different from the example we showed before! So, why does it behave so dramatically worse in rush hours?
The Root of Performance Issues: We Found It!
We encountered pretty much the same slow pattern in all related endpoints when performing search requests. As a result, we were pretty confident that the root cause for all of it had to be in one of our core cache components. In other words, too many requests were delivered to our internal microservice (which serves the user session token object from the database) instead of getting it directly from the cache.
This hypothesis also fits the scenario above since more active users implies more SELECT and UPDATE queries for each user session token at precisely the same time we saw latency peaks in our graphs.
From there, finding the best solution was pretty straightforward and the fix took us just two lines of code! It was a matter of changing the configuration of our session token cache eviction policy.
Boommmm
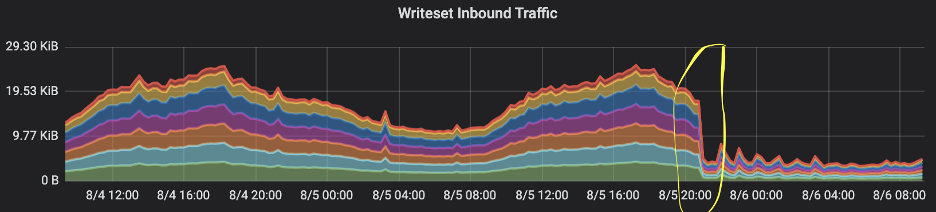
The most exciting part of these kinds of fixes is to see how all the graphs change immediately. The writes and reads traffic to and from the database, plus the high latency in many requests, dropped as soon as we pushed the fix live to production. The impact was absolutely clear in our application dashboards:
We could see the total size of transaction commits dropped right after the deployment.
Also, we saw the total number of requests to the problematic service cut off by more than 80%!
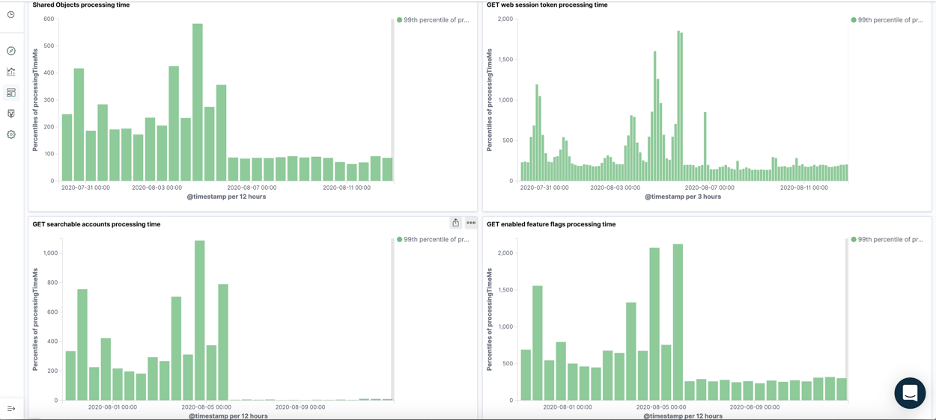
And most importantly, as soon as we deployed the fix, the latency dropped across all the impacted endpoints:
For the coup de grace, we were waiting to hear from our customers any positive feedback. And we didn’t have to wait long—we immediately received high marks.
Summary
We still have a long way to fully instrument our system, but even with what we did so far we see that the efforts have paid off. We got a really cool and meaningful view of our system, which makes us better understand our business flows and, more importantly in our case, to quickly identify any bottlenecks.
We already learned from our ongoing tracing adoption journey a few tips worth sharing:
Correlation between spans and logs is a must-have. The best practice for doing it is with a unique identifier such as trace-id or in case it’s missing with request-id. It brings a lot of value when you better want to examine a full request end to end by one click, which moves you to the respected logs page and vice versa. With Logz.io, you will get the log-trace correlation out of the box, which simplified things for us.
If your application is multi-tenant and you want a better view of traces of a specific customer, I’d recommend adding custom tags like customerId or userId.
If you want more finely tuned traces, consider adding custom spans for important pieces of application logic. Don’t just wrap every endpoint, which is the easy thing to do. If we suspect, for example, a slow query in the database, we can easily add in code for a custom span that will measure just this section and then it’ll be visualized under the parent transaction span, so we can see how much time it takes comparing the other spans.
Having Logz.io made our journey much smoother—having logs, metrics and traces in one consolidated platform without the need to install and maintain it ourselves and with built-in correlations.
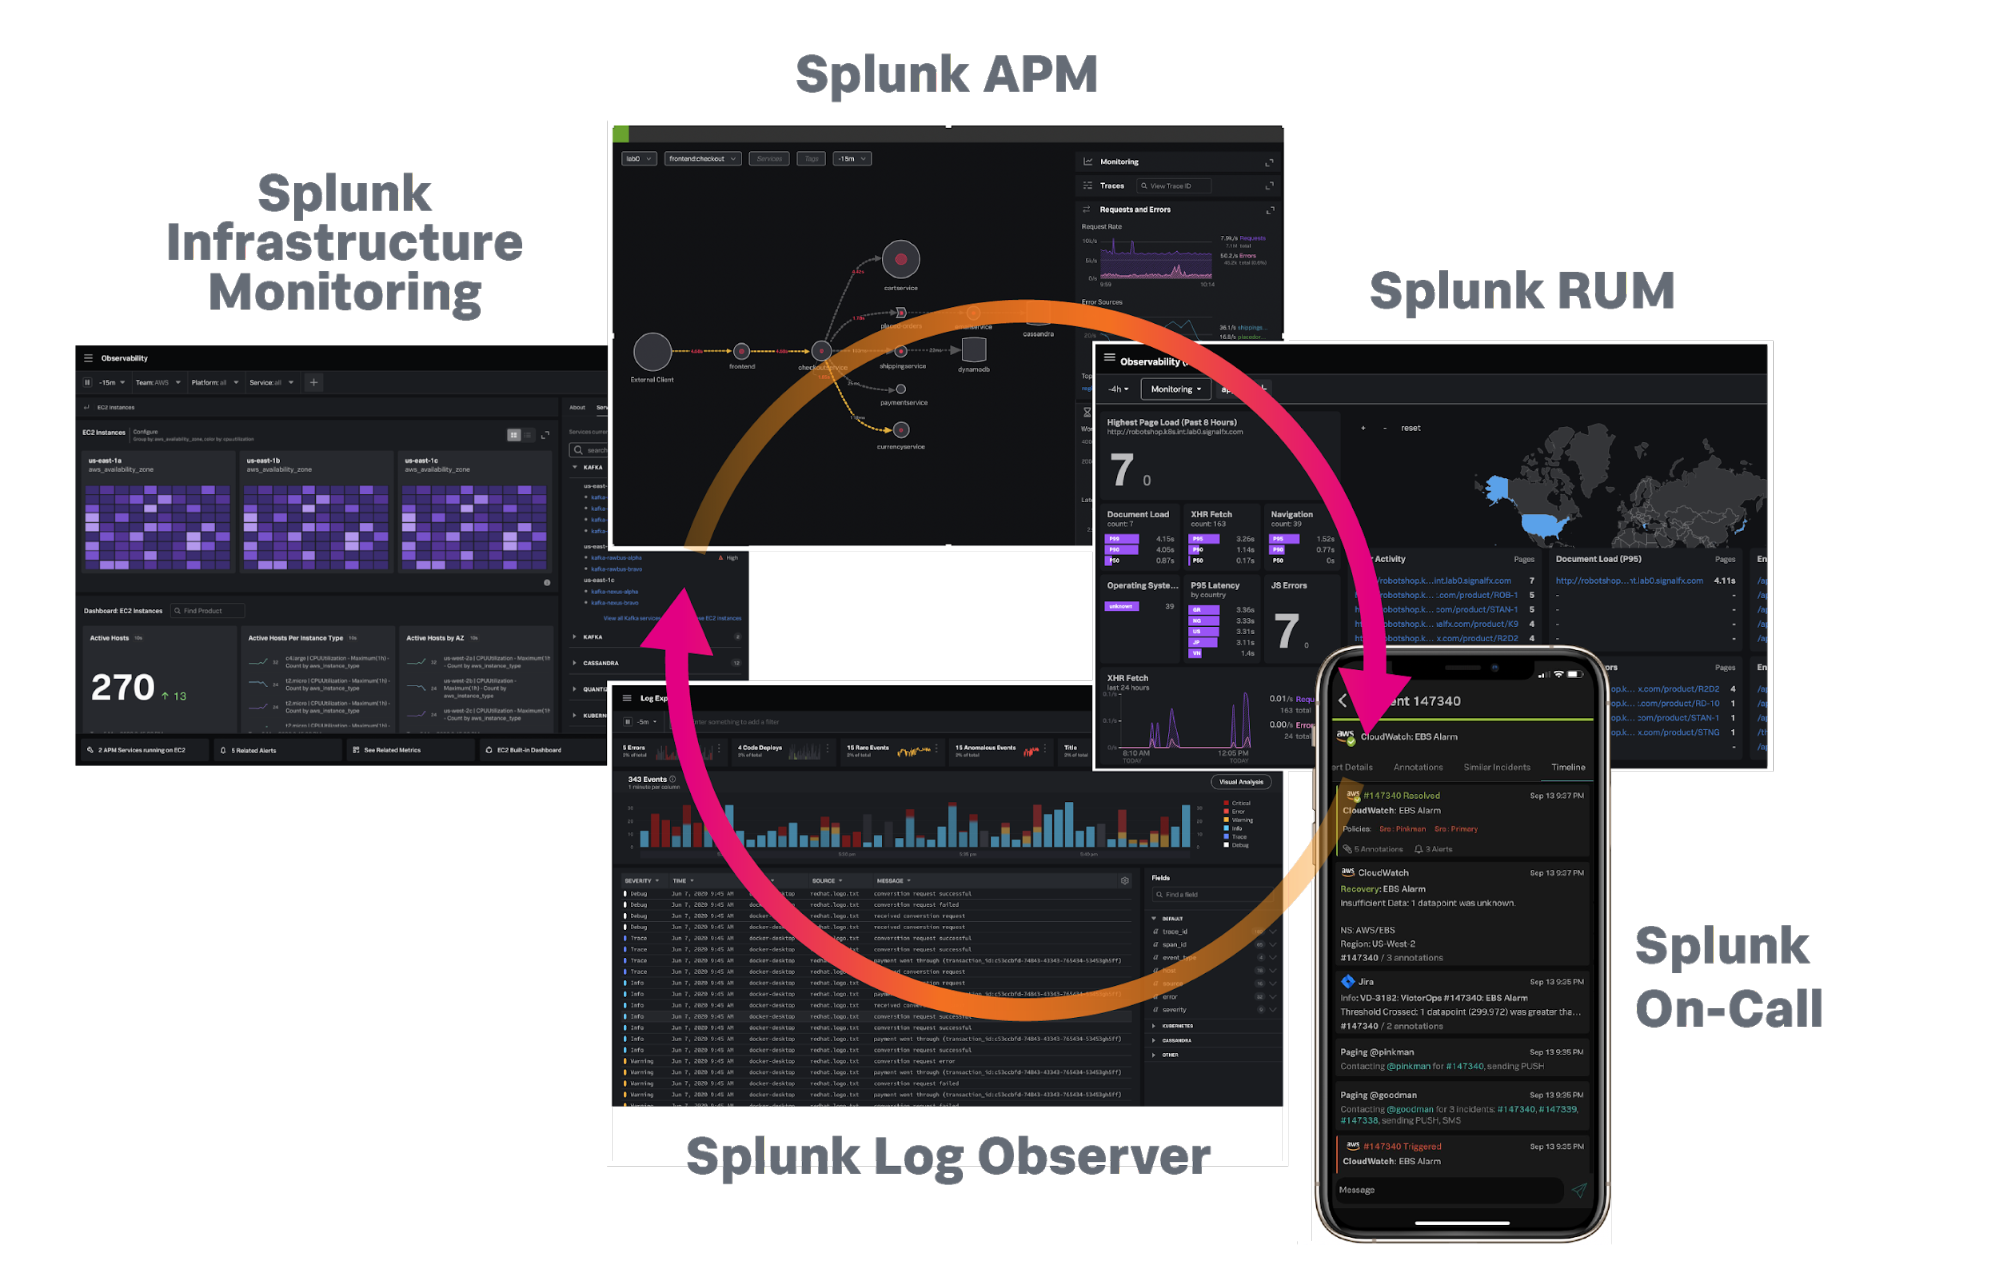
Splunk this week at its online.conf20 conference revealed it has acquired Plumbr, a provider of an application performance management (APM) platform, and signed a definitive agreement to acquire Rigor, a provider of synthetic monitoring and application optimization tools.
Both platforms are destined to be integrated with the Splunk Observability Suite, a suite of IT management tools the company launched this week as well.
Splunk CTO Tim Tully said the goal is to provide a full-fidelity platform that leverages machine learning algorithms to observe IT environments in real-time.
Plumbr, which includes real user monitoring capabilities as part of its platform, will extend real user monitoring (RUM) capabilities, currently in beta, that Splunk has developed on its own.
Tully said Splunk is also committed to making its platforms available across hybrid cloud computing environments by leveraging cloud-native technologies such as Kubernetes, Docker containers, Envoy, Istio and Terraform.
Splunk has embraced observability, a core tenet of best DevOps practices, as part of an effort to provide a range of digital experience management capabilities at a time when many organizations are accelerating their investments in digital business transformation initiatives. Splunk last year acquired SignalFX for more than $1 billion to gain access to another APM platform that would expand its reach beyond its core IT operations analytics platform.
It’s not quite clear how many platforms and services will ultimately make up the Splunk Observability Suite. The company is clearly moving toward a model for consuming its services based on value rather than the amount of data collected. Determining that value will naturally be different for each customer, but in the wake of the economic downturn brought on by the COVID-19 pandemic, the pressure to reduce IT costs has intensified. In many cases, the cost of acquiring an observability platform can easily be justified by eliminating the licensing fees organizations pay to employ a dozen or more tools from different vendors that typically are not integrated.
Competition across providers of observability tools has also intensified. In addition to every provider of an APM platform recasting itself as a provider of observability tools, there is a range of startups that address all or some aspect of observability. A wave of consolidation among providers of observability tools and platforms is all but inevitable.
Much of the focus on observability is being driven by the rise of microservices-based applications that have levels of dependencies requiring a level of context to successfully manage what isn’t possible to achieve by relying on legacy tools that monitor applications and infrastructure in isolation. The lack of integration is also one of the primary reasons why IT teams waste so much time in “war rooms” trying to deduce the root cause of an issue, which, once discovered, only takes a few minutes to fix.
Splunk, of course, enjoys a considerable advantage in the observability wars. Its core IT operation platform is widely employed by internal IT operations and security teams. However, much of the transition to observability is being driven by DevOps teams who take the lead when it comes to instrumenting applications. Many of those teams are far less committed to any specific platform no longer how established it may be.










 Despite observability being a core tenet of DevOps, it remains an elusive goal for most IT organizations. There is no shortage of tools for monitoring individual applications and systems, but aggregating all the data the tools generate into actionable intelligence requires a significant amount of time and effort. Loki makes it much easier to analyze the relevant logs at the right time in a way the average IT administrator can navigate without having to become a superuser of more complex platform, said Wilkie.


 It’s important to emphasize that in non-peak hours, these microservices take 10 milliseconds at most: