Category: Application Performance Management/Monitoring

  • Oracle Includes GraalVM Support in Java SE Subscription

    Oracle Includes GraalVM Support in Java SE Subscription

    Oracle announced today it is adding a GraalVM Enterprise virtual machine for building Java applications to Java SE Subscription at no additional cost.

    Donald Smith, senior director of product management from the Java Platform Group at Oracle, said GraalVM Enterprise provides developers with a high-performance application runtime, built on Oracle Java SE, that includes a compiler that accelerates Java application execution. That’s critical as developers look to build microservices-based applications employing microservices that tend to be latency sensitive, Smith said.

    The first stable release of GraalVM arrived last fall. It consumes less memory, and enables Java applications to spin up faster by taking advantage of capabilities such as a just-in-time compiler. GraalVM Enterprise adds a native image utility that compiles Java and JVM-based applications ahead-of-time (AOT) into self-contained native executables. That approach only includes the classes and libraries needed to run the application, which reduces the size of the binary that gets generated.
    Including GraalVM Enterprise in the Java SE Subscription make it easier for Java developers to switch to that Java virtual machine (JVM) to build microservices rather than having to learn another language, Smith said.

    Smith said most organizations will continue to build monolithic applications at the same time they’re attempting to construct microservices. The Java SE Subscription makes it possible for developers to employ different JVMs depending on the type of application being constructed or updated, Smith said. A survey of 560 developers conducted by Oracle last month finds nearly half (48%) are already employing GraalVM to build microservices using Java.

    How much will organizations rely on Java to build microservices, given all the other programming language options available? That’s up for debate. However, being employed in the enterprise for more than 25 years, the number of developers that know Java well is substantial. Rather than waiting for those developers to become proficient in another programming language, there’s a natural tendency for organizations to want to stick with a familiar language. Each additional language introduced to build applications also tends to complicate DevOps processes in a way that can increase the total cost of IT.

    At the same time, however, the number of developers that know how to develop applications using everything from JavaScript to Go is also increasing. Oracle, via ongoing investments made in the OpenJDK project, is moving to make sure Java stays relevant at a time when the number of programming languages being employed has never been greater. For what it’s worth, GraalVM is designed to support multiple programming languages, including JavaScript.

    It’s unlikely Java will fade into obscurity any time soon. IT organizations have a vested interest in embracing next-generation JVMs, if for no other reason than making Java applications more efficient, regardless of how they are built.

    It’s also worth mentioning that frameworks – such as Quarkus from Red Hat – that enable Java-based microservices to run natively on Kubernetes clusters already rely on GraalVM. In some cases, developers may wind up employing such a framework without realizing it relies on GraalVM. In other cases, the challenge will be getting developers to opt for GraalVM as their JVM of choice when so many of them have routinely used the same JVM for more years than they care to admit.

  • Tidelift Secures Open Source Software Supply Chains

    Tidelift Secures Open Source Software Supply Chains

    Tidelift today announced the general availability of a platform dubbed Tidelift catalogs, through which enterprise IT organizations can more effectively manage their open source supply chains.

    Donald Fischer, Tidelift’s CEO, says the Tidelift catalogs platform enables IT teams to curate, track and manage open source components that have been vetted and adhere to compliance requirements by Tidelift. The company is working directly with the maintainers of those open source projects to compensate them for making that additional effort, said Fischer.

    Developers can reliably pull components spanning common language frameworks like JavaScript, Python, Java, Ruby, PHP, .NET and Rust, with more programming environments to follow, added Fischer. Those components are made available via a Tidelift Subscription service.

    Fischer said Tidelift is going beyond merely scanning open source components for vulnerabilities. The company is ensuring that when developers access versions of open source components, those versions comply with specific sets of policies, said Fischer. As a part of that subscription service, Tidelift monitors components for vulnerabilities as they are discovered, and works with maintainers to implement updates as needed.

    While many organizations are starting to employ DevSecOps best processes, Fischer said the discovery of an issue involving open source components often comes far too late in the process. The Tidelift catalog approach ensures there are no last-minute surprise that are only discovered just before an application is about to be deployed in a production environment.

    Securing software supply chains has become a higher priority since it was revealed that cybercriminals successfully inserted malware into an application update made to network monitoring software provided by SolarWinds. That malware subsequently rippled across IT environments involving multiple corporate entities, as well as several Federal agencies.

    Of course, securing a software supply chain doesn’t happen overnight. Most IT organizations don’t have the processes and platforms required to vet open source components and frameworks. Tidelift is betting most of those organizations would prefer to subscribe to a service, rather than set up that infrastructure themselves. However, for organizations that require in-house monitoring of all the elements of their application development platform, Tidelift will make an on-premises edition of its platform available.

    As organizations become more dependent on software, the potential impact malware can have on their operations can be extensive. Organizations of all sizes should expect to be fielding inquiries from customers, suppliers and partners concerning the level of rigor being applied to their software development processes. In effect, they are going to demand to know the provenance of the software they are being asked to implicitly trust. In many cases, those inquiries will provide the incentive to accelerate adoption of DevScOps best practices.

    The days when organizations blindly used software with little regard to its origins are coming to a close. That doesn’t mean reliance on open source software is necessarily going to decline; however, it does mean application development teams will be held more accountable for the open source components they rely on.

  • vFunction Automates Conversion of Java Apps to Microservices

    vFunction Automates Conversion of Java Apps to Microservices

    vFunction has developed an eponymous platform capable of automatically converting a monolithic application written in Java into a set of microservices. The startup is emerging from stealth mode today.

    Fresh from raising $12.2 million in seed funding, vFunction CEO Moti Rafalin said the company’s platform employs dynamic analysis, static analysis, data science and automation to enable IT teams to reengineer, in a repeatable fashion, the source code used to create monolithic Java applications.

    As part of that process, vFunction also detects and eliminates code that is no longer executed to reduce the footprint of an application, minimize security risks and overall maintenance tasks.

    The vFunction platform is deployed as a server that communicates with agent software injected into the legacy monolithic application. The server then creates a microservice that is scanned by additional tools to determine how best to optimize it to run on, for example, a Kubernetes cluster based on the Red Hat OpenShift platform, said Rafalin.

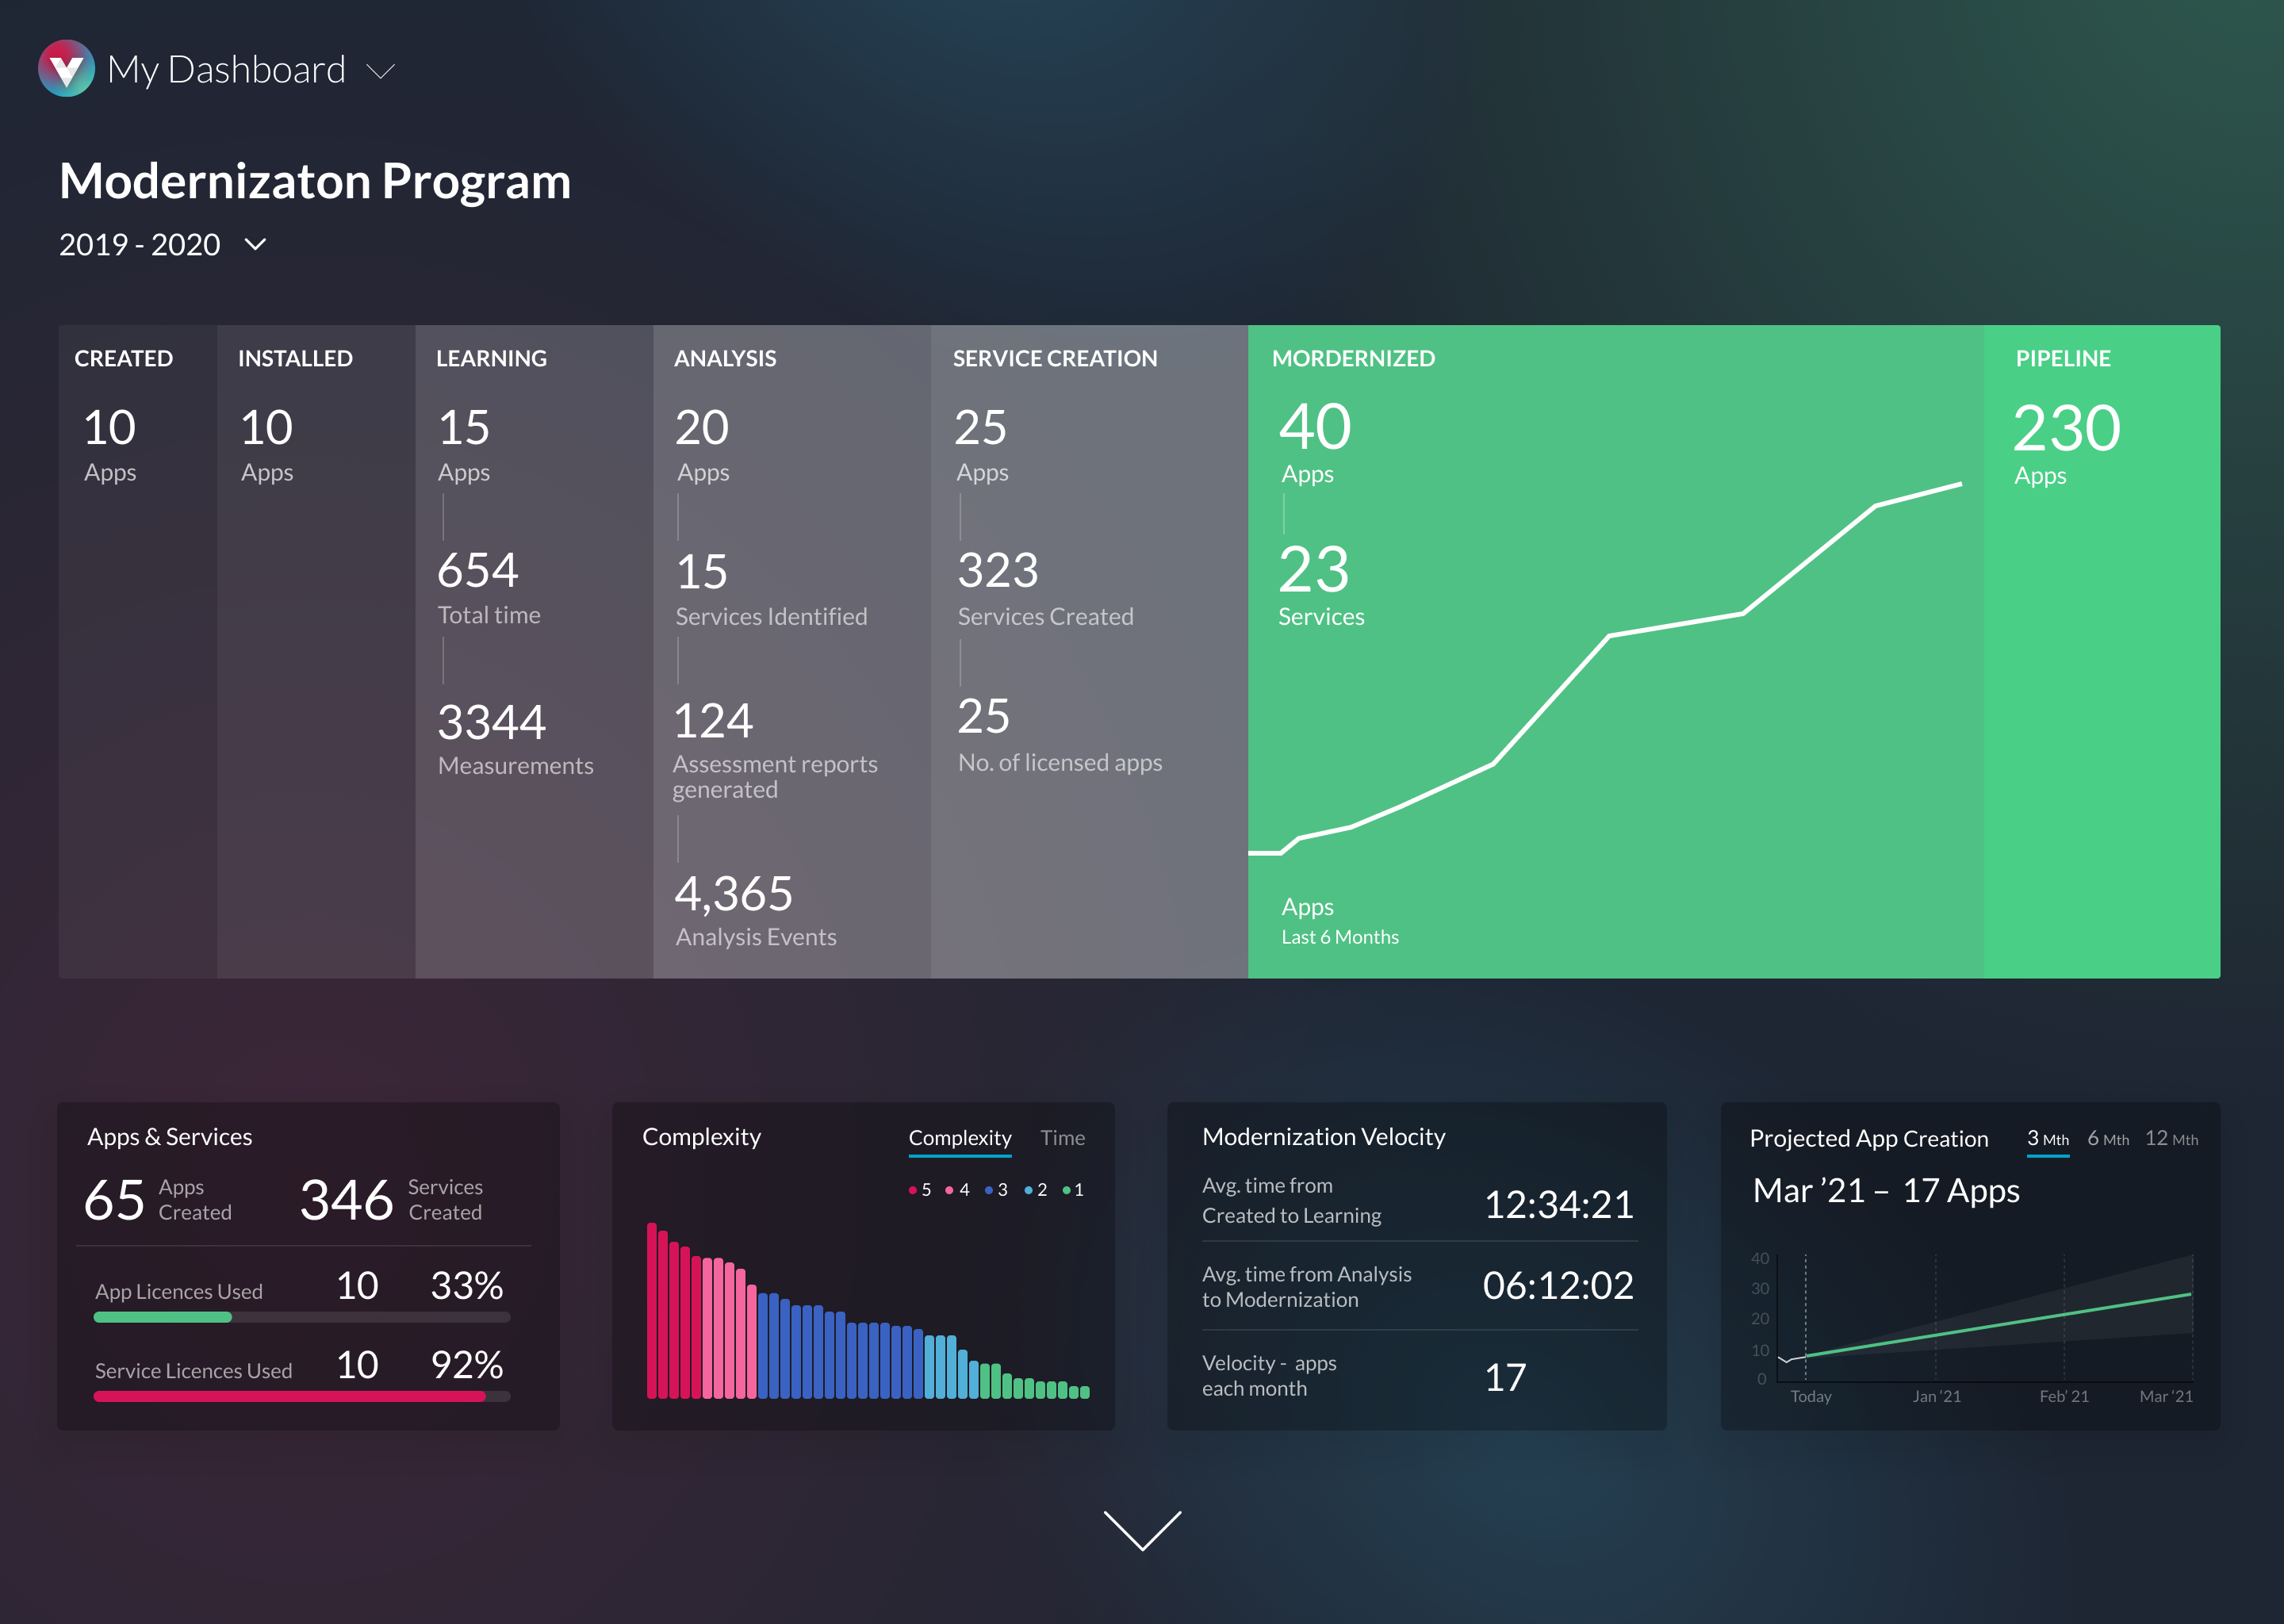
    IT teams can also employ vFunction to determine which monolithic applications are better suited to being converted into a set of microservices that can be automatically extracted into separate compilable projects. Each project comes with an estimated timetable for completion that can be accessed via a Modernization Factory Dashboard and Application Complexity Assessment tool provided by the platform.

    Rafalin said most monolithic applications are made up of large amounts of ‘spaghetti code’ that was added over multiple generations by different development teams. Manually analyzing that code as part of an effort to refactor a legacy application would require weeks of effort, Rafalin said. As such, the rate at which most organizations are re-engineering applications is extremely slow, he said.

    In fact, it’s not unheard of for IT organizations to to start, but quickly abandon such because the time and effort required proved too costly. vFunction claims its automated, domain-driven processes accelerate manual refactoring by a factor of ten, resulting in a savings of anywhere from $300,000 to $500,000 per application.

    Pricing for vFunction is based on a per-application model. The company has also established alliances with system integrators such as HCL Technologies, Tata Consulting Services and Wipro that are regularly contracted by IT organizations to refactor their applications.

    Of course, not every monolithic application needs to be converted into a set of microservices. However, most monolithic applications have components that would be easier to maintain and support as a distinct microservice. Organizations, in general, are embracing microservices to build applications that are more resilient. In the event a microservice becomes unavailable, requests for services are rerouted to another microservice to make sure the application degrades gracefully, rather than crashes altogether. The challenge is that, over time, the dependencies that can exist between hundreds of microservices can be more challenging to manage than those of the monolithic application being replaced.

  • DevSecOps Implementation: EDR/XDR

    DevSecOps Implementation: EDR/XDR

    We mentioned host intrusion detection and network intrusion detection in an earlier blog, and mentioned firewalls a couple of times in passing. Let’s delve a bit into the history to understand how these tools’ functionality has evolved over time.

    On the host side, we had virus detection, in one form or another, from early in the evolution of the Internet. The idea being that, if an antivirus program could scan your files, it could help protect you from malicious applications. Applied to an organization, if antivirus applications could scan all users’ desktops, it could help protect the organization. And it did kind of work. Most organizations were protected, at one point or another, by their antivirus software. Then, they realized the need to see more than what simply scanning files could show. A file that looked innocent on disk could assemble malicious code while executing, so runtime environments also needed to be watched. Generally speaking, the same antivirus companies led the charge into runtime protection. But there is more to protecting systems than simply looking at running applications. Scripts, even database entries, could be made malicious, and activity over time could indicate a bigger problem than a virus – an intrusion. This problem was the reason host intrusion detection was born. The idea that all of your system(s) needed protection all of the time created a mostly agent-based environment that monitored several aspects of the running system to watch for suspicious activity.

    On the network side, firewalls were implemented early in the growth of the Internet to allow limited access to corporate resources over the network. If no one ever needed to telnet to the machines on subnet X, the telnet port for subnet X could simply be blocked at the firewall, and no sleep need be lost over attempts to connect. Almost immediately after their inception, firewalls started logging attempts to access ports, and this information was made available to network administrators to review. This had an interesting impact on the management of hosts, because now, the firewall could inform network administrators if one of the internal hosts was constantly attempting to do something it shouldn’t be – possibly indicating an intrusion or a bad employee (more often than not, it turned out that undertrained, curious employees were just poking around). But firewalls – whether using whitelist or blacklist methodology – were fragile and/or interruptive. They also simply plugged holes in the perimeter without being proactive. That is when some bright people realized that, if you monitored streams running through the firewall, you could detect attacks and intrusions and offer admins proactive information about potential threats. That was the genesis of network intrusion detection (at least, as with all of these, as much of it as I can cram into a blog).

    But as time has moved on, there was a need for more. Network intrusion prevention was tried, but most organizations don’t want automated systems cutting off connections for fear of impacting real users. While it is still around, it hasn’t gained all that much traction. The next step was to “connect the dots,” so to speak. If the HIDS on host A was detecting a suspicious pattern of behavior, it only made sense to have the HIDS on the other hosts in the network take a look for similar behavior. Command and control of cross-HIDS installs is at the heart of endpoint detection and response (EDR), which gathers information from multiple HIDS agents and correlates it to get a more holistic view and alert on activity that a single host might not have noticed (a super simplified example: if the same user account tries to get super-user privileges with a single attempt on a dozen machines. HIDS might not raise a high-priority alert for a single attempt, but EDR sees twelve attempts on twelve different machines, not just the one on a given box, and can raise a high-priority alert).

    Extended detection and response (XDR) extends this information amalgamation and analysis to the network side, including attempts to gain access to the network (in our simple example above, imagine if the same user account tried to ssh into machines it doesn’t have network access to).

    As of this writing, EDR and XDR are using machine learning (ML) to perform faster processing of all the data they are seeing, and to limit false positives while raising critical alerts up to human operators. At this point in the ongoing feud between attackers and security personnel, I’ll go so far as to call it state-of-the-art. For now. Other attack vectors and XDR-defeating attacks will no doubt come along, and will have to be answered, but for now, if you have a publicly exposed network, it is the best you can get. Vendors have moved both EDR and XDR analysis to the cloud, ostensibly to improve analysis. It does reduce the amount of maintenance customers must perform, but cloud usage comes with an operational pricetag that prospects should understand before signing on the dotted line. Most mid-sized or larger organizations don’t have a storage or processing power shortage, so operational efficiency is what you are really paying for, in most cases. Make sure it’s worth the cost, and you have a plan if you lose access to that ML engine in the cloud.

    Meanwhile, keep kicking rear. Mark each day with, “At least we’re not SolarWinds,” and, remember: you’re doing your best to protect the org in a dynamic and hostile environment. Celebrate each day without a breach as a success – because someone did try.

  • OpenTelemetry Project Gains Log Agent Software from observIQ

    OpenTelemetry Project Gains Log Agent Software from observIQ

    Stanza, an open source log agent developed by observIQ, a provider of an observability platform, has become part of the OpenTelemetry Project for collecting telemetry data.

    Mike Kelly, CTO and co-founder, observIQ, said Stanza will make it possible to collect log data alongside other telemetry data using a common application programming interface (API) and software development kit (SDK).

    OpenTelemetry is currently a sandbox-level project being developed under the auspices of the Cloud Native Computing Foundation (CNCF); it provides a set of open source libraries, agents and other components for collecting the telemetry data consumed by observability and IT monitoring tools.

    Contributors to the OpenTelemetry Project include Amazon Web Services (AWS), Elastic, Google, Honeycomb, Lightstep, New Relic and Splunk. After Kubernetes, Kelly said the OpenTelemetry Project is now the most popular open source initiative being advanced by the CNCF.

    The OpenTelemetry Project is still a long way from delivering agent software that will be widely employed on an IT production environment. However, the potential implications of the project are already being widely noticed. Rather than having to deploy, manage and update agent software for individual IT management tools, it will soon be possible to deploy a single set of agent software to generate data that can be consumed by multiple platforms.

    That shift will enable providers of these platforms to focus more of their effort on enhancing their analytics capabilities rather than developing proprietary agent software that typically doesn’t provide much differentiated value, Kelly said.

    Stanza is part of an IT observability platform developed by observIQ when it was previously known as Blue Medora. After selling its platform for integrating monitoring tools to VMware, Blue Medora changed its name to observIQ. Now, it is making an effort to advance adoption of an observability platform that it makes available as a software-as-a-service (SaaS) application.

    Will DevOps teams roll out elements of OpenTelemetry themselves, or wait for the observability and monitoring tool and platform providers to support open source agents that would automatically be deployed? That remains to be seen. Regardless, the total cost of observability should decline, as open source agent software replaces the proprietary agent software strewn across enterprise IT environments today. The expectation for vendors is that more applications will be consuming analytics data surfaced by the observability and monitoring platforms they provide.

    Of course, it will be a while before that dream is fully realized. In the meantime, IT organizations will need to carefully evaluate the total cost of observability against the business value of the application deployed. Cost is one of the reasons application performance management (APM) tools are not widely employed today. Of course, as IT environments become more complex, thanks to the rise of microservices and serverless computing frameworks, it’s also become increasingly apparent that observability will soon be a capability IT teams can’t afford to do without.

  • ARMO Aims to Simplify Microservices Security

    ARMO Aims to Simplify Microservices Security

    ARMO this week emerged from stealth to launch a platform to secure cloud-native workloads and improve visibility. The ARMO Workload Fabric technology attaches code within the memory invoked by a microservice to enable cybersecurity policies to be applied via a cloud service.

    Company CEO Shauli Rozen said the ARMO Workload Fabric is designed to enable IT organizations to implement a zero-trust architecture more easily within the context of a DevSecOps workflow.

    Fresh from raising $4.5 million in seed funding, Rozen said ARMO’s approach eliminates the need to deploy and manage agent software, container sidecars or runtime application self-protection (RASP) software to enforce security policies across what inevitably will become thousands of microservices distributed across an enterprise IT environment.

    That leaner approach then allows for a centralized management platform that can be deployed on a cloud or on-premises IT environment to apply policies that restrict which microservices can communicate with one another, Rozen said. The approach would ensure that only microservices developed using a continuous integration/continuous delivery (CI/CD) platform are allowed to communicate with other microservices, Rozen said.

    Integration with multiple CI/CD platforms is already provided, added Rozen.

    That approach allows policies to be applied to microservices regardless of how they are constructed, Rozen said. That capability is critical, because developers are building microservices using everything from Python and Java to containers, he said. Many of those microservices are also frequently replaced, Rozen said, which can make updating any associated agent software a significant DevOps challenge. Given all the existing dependencies between microservices, overall application environment security is only as strong as the proverbial weakest link. The ARMO Workload Fabric enables developers to add a small amount of code to implement security policies each time a microservice is rolled out into a production environment.

    As part of an effort to make it simpler for IT organizations to apply those policies, ARMO provides a pre-built set of policies that organizations can immediately apply, in addition to creating their own polices over time, Rozen said. In many cases, IT teams simply don’t have the time or expertise required to build those policies, Rozen added.

    Microservices are being built and deployed at such a breakneck pace that it’s nearly impossible for cybersecurity teams to keep up. The ARMO Workload Fabric provides cybersecurity teams a means to centrally manage security policies that would otherwise be implemented as code by developers. It provides a level of observability for how those cybersecurity policies are being implemented across microservices that typically have a lot of dependencies on one another, Rozen said.

    Most organizations today recognize there is a clear need to shift responsibility for application security further left toward developers. The challenge is finding a practical way to achieve that goal, and in a way that doesn’t adversely impact the rate at which applications are being developed. The key to achieving that goal is finding a way to apply microservice security polices that causes the least amount of friction possible to existing DevOps workflows.

  • Sentry Updates Tool for Monitoring JavaScript Apps

    Sentry Updates Tool for Monitoring JavaScript Apps

    Sentry today announced it has updated its JavaScript SDK tool for monitoring applications to provide a more comprehensive view of application health.

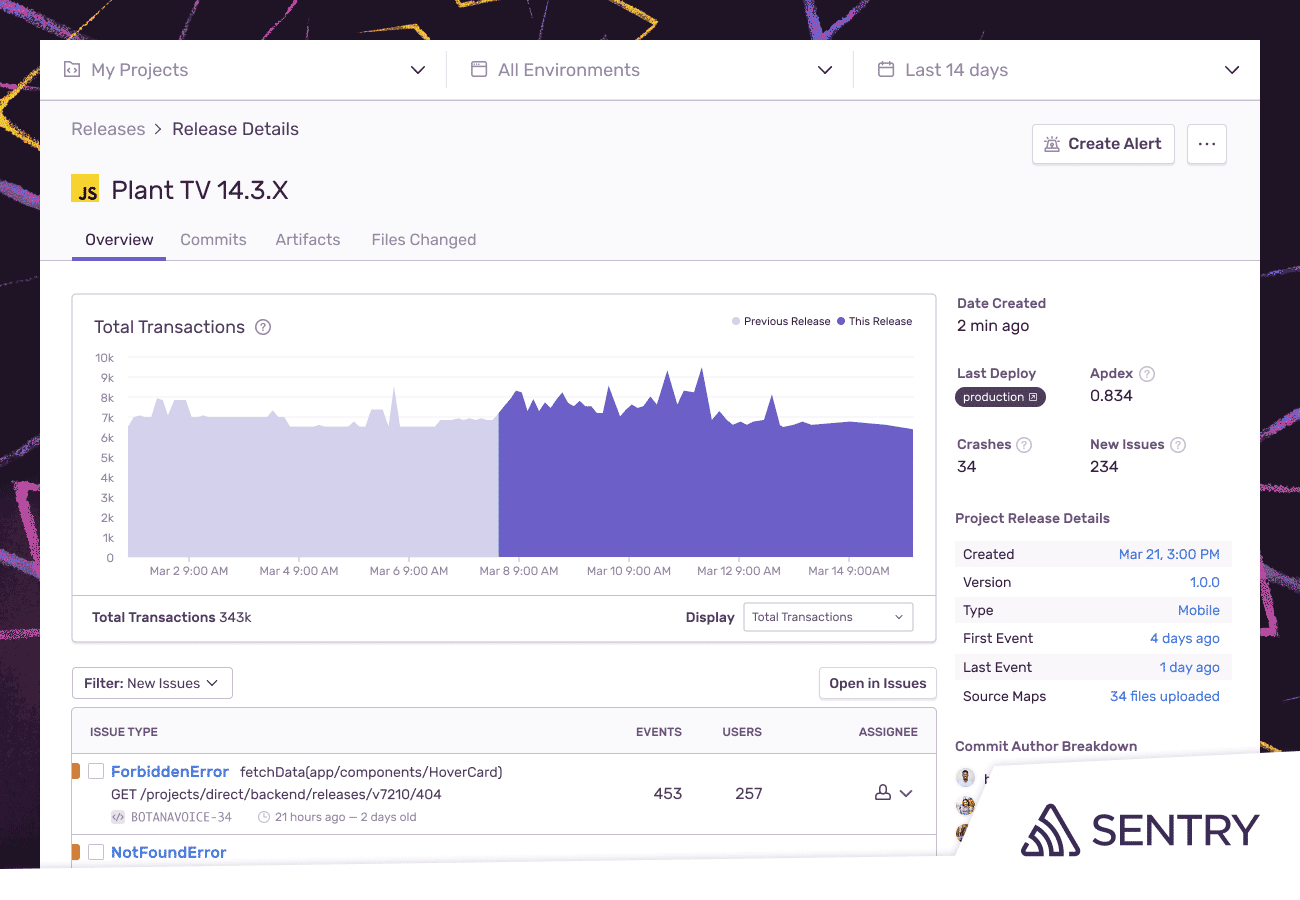
    Previously, Sentry’s JavaScript SDK enabled JavaScript developers to insert lines of code that would tell them, for example, how many times an application failed. A new release health capability now also identifies what percentage those fail instances represent of the total number of times that application was successfully launched.

    Developers can, in effect, better gauge adoption of a JavaScript application by tracking the percentage of crash-free sessions and crash-free users over the application’s life cycle.

    Ben Vinegar, vice president of engineering for Sentry, said the JavaScript SDK is designed to provide developers with a monitoring capability that doesn’t require an IT operations teams to stand up and manage an entire application performance management (APM) platform. That approach also eliminates the need to instrument JavaScript applications with agent software, Vinegar said.

    The JavaScript SDK consumes tens of kilobytes of memory after it is embedded directly within a JavaScript application, said Vinegar.

    In general, JavaScript is increasingly being used to build complex applications, using frameworks such as React, as an alternative to Java. Over the years, IT organizations have developed a certain amount of bias around how Java applications should be monitored and managed using APM platforms. However, as JavaScript developers assume more responsibility for their applications after deployment, they need real-time monitoring tools that can consume JavaScript application metrics and are built in to existing APM platforms, .

    Of course, APM platforms are managing more than just JavaScript applications, so they’ll remain useful for the forseeable future. However, ease of observation and monitoring is a significant factor when application developers choose a language in which to build an application, and it’s up to individuals to remediate issues that might arise in production. Developers, therefore, have a vested interest in discovering potential issues before that application is deployed.

    Historically, developers have not had access to JavaScript application monitoring tools that they could easily implement on their own. Sentry’s tools makes it possible for developers to identify performance issues, including calls to application programming interfaces (APIs) and other common errors, and address those before an application crashes.

    It’s possible, as performance and security issues shift left and developers become more accountable for user experience, that developers might one day instrument and monitor applications on their own – if for no other reason than self-preservation. Every minute a developer spends remediating a production issue in an existing application is one less minute they will have to write new code.

  • An Analytics Workload is a Critical Data Management Tool

    An Analytics Workload is a Critical Data Management Tool

    From an organizational perspective, an analytics workload is a way to gain a data-driven business advantage. Analytics workloads can serve a primary objective that translates to an actionable business impact (such as analyzing A/B testing results, understanding user retention or finding anomalies in a flow, for instance) or can serve in a supporting role for analysis (such as improving dataset quality, preparing a dataset for user consumption or adhering to a data-related regulation).

    Ideally, a workload should have a measurable ROI and should be monitored on key performance metrics such as business impact, time to deliver, cost of execution and total spend versus allocated budget. Managing workloads this way is extremely challenging for data teams. In reality, the impact of big data analytics projects – and the effort and resources spent on them – tends to be unpredictable.

    You can place workloads on a spectrum: on one end, you have workloads that are very close to their business consumers. On the other end, you have workloads that serve auxiliary and support purposes. The latter are the hardest to track, budget and measure their return on investment (ROI).

    Query vs. Workload

    When data platform teams are tasked with evaluating and implementing the infrastructure needed for an analytics workload, they tend to look at it from a technical requirements perspective. An analytics workload is a set of queries that read and write datasets; it consumes compute, storage and memory resources and has an expected level of availability, robustness and performance.

    One traditional approach for improving cost and user experience in a workload is to focus on specific queries – identifying the slow, heavy and expensive ones and optimizing them one by one. While many single queries can be made better (faster, cheaper) by rewriting and optimizing, this approach often misses the big picture, leaving money on the table.

    Knowing Which Queries to Focus On

    Stripped of workload context, queries can only be evaluated on cost or response time. But business-critical queries may not be the most expensive, nor the slowest ones. Having the full view of the workload allows for prioritizing efforts much more effectively.

    Behavior Fluctuations

    The most important query on Mondays is probably very different from the most important query on Fridays, so the effectiveness of optimizing one or both queries may be small. The workload perspective enables you to identify patterns and leverage insights for effective optimization.

    Cloud Elasticity

    Unlike legacy data platforms, the cloud enables a brute-force approach to solving performance problems by adding elastic resources on demand. While this approach can work to improve a specific query, cost quickly gets out of control when applied to all queries. Understanding the workload is key to distinguishing when a brute force solution is right, and when you need to spend the time to build a different data flow.

    Cloud Decoupling

    In legacy IT environments, where queries were competing for a limited pool of resources, optimizing a single query had significant impact. But in cloud environments where resources scale elastically, queries compete with each other on a much smaller scale, if at all. Therefore, optimizing single queries has very little impact on the overall performance of workloads.

    Measuring Performance by Looking at the Median

    The heaviest or slowest queries are in the top percentile of queries. When trying to improve the overall user experience, the median performance can matter more, but it is indirectly affected when handling the extremes, so it tends to be less effective.

    The Long Tail

    In many workloads, a few highly visible queries can paint a misleading picture. It is common to have less than ten queries responsible for 20% of the load, and thousands of undistinguished “simple” queries responsible for 80%. Therefore, when data teams are trying to reduce cost, focusing on the most expensive queries may draw attention away from lower-hanging and easier optimization opportunities in “simple” queries.

    “Big Picture” Optimization

    Actions that improve a query (such as changing the layout of a dataset) may result in unintended consequences to other queries. Only a workload perspective can help evaluate the wider impact across other queries.

    The Cluster Approach to Optimizing Big Data Analytics

    Another traditional approach to optimizing data platforms is analyzing behavior from the cluster perspective. Most data platforms offer decent cluster monitoring of technical metrics, such as CPU load and RAM usage.

    But, focusing on cluster-based KPIs will draw attention away from the elements that have the highest impact. Understanding the workload entails understanding the business logic of queries: repeating query patterns, hidden dependencies, failure modes.

    Looking at this from a cluster perspective limits you to technical parameters, such as CPU usage. Without understanding the workload, data teams will miss issues such as a repeating calculation (to be made into an ETL flow) or an inconsistent calculation flow (like having different ways to compute the same business KPI).

    In environments where clusters are shared between different workloads, data teams often encounter additional challenges:

    Workloads Have a Business Context, Clusters Don’t

    From a cluster perspective, there is no inherent prioritization between queries, and data teams find it difficult to focus only on business-critical workloads. The outcome is often reverting to focusing on specific queries, which doesn’t offer an effective solution.

    Workloads Have Different Needs

    Take, for example, an ETL workload which may require a large amount of RAM, run hours and which must be finished by 7 am. An interactive data product workload may be composed of thousands of queries that each must return in under 2 seconds. Analyzing the cluster as one unit can lead to suboptimal behaviour of both workloads. While this example can be considered simple to detect, many workloads that seem similar can have widely divergent needs.

    As data lakes gain momentum as production-grade, big data analytics architecture, data teams need to shift attention from optimizing queries to measuring, analyzing and optimizing workloads. In the early days of big data, data warehouses were isolated data platforms tasked to deliver insights for a very specific set of business questions. But as the cloud rapidly evolved, the mere migration of data warehouses to the cloud is not enough. The next stage is moving production workloads to the data lake.

    Storage is so much cheaper, and organizations want to run queries on any dataset, whenever they need it. It’s this heterogeneous collection of many different queries that requires workload-level visibility to ensure each workload can truly meet performance and budget requirements.

  • BYOPC Solves Endpoint Provisioning Challenges

    BYOPC Solves Endpoint Provisioning Challenges

    For many cloud-first companies, workstation imaging isn’t “a thing.” The notion that an IT organization might need several days – or even weeks – to onboard a new employee by provisioning an imaged laptop with correct security policies and only approved applications on it is absurd. The constraints of operating in an admin-centric model for IT service delivery would completely erode the agility that cloud native engenders.

    But let’s say your company was born before the cloud era. Or, suppose your company operates in a highly regulated industry, like financial services or health care, for example. For your company, workstation provisioning may still be a very real thing, and it may be weighing you down. That’s why a bring-your-own-PC (BYOPC) policy could be the answer.

    Now, take that basic provisioning problem and multiply it by a few orders of magnitude. That’s what happened to many companies in the crush to support remote workers in response to COVID-19. Most weren’t ready for the scale of the problem, and some had no means to enable secure remote work for their privileged users. So, when it came time to pivot to a remote-first stance, many IT organizations were unprepared, unprotected and overwhelmed. Between budgeting, acquiring endpoints and the provisioning of those devices, many companies incurred enormous opportunity and financial costs.

    But what if that didn’t have to be the case? What if, instead, there was an option to enable every new employee or newly remote worker instantaneously? What if the company didn’t have to bear the capital expense of purchasing new laptops for each employee? And what if the company didn’t have to carry the operating expense of having an army of IT admins whose job requirements are little more than commissioning and decommissioning workstations as new hires come on, as existing employees pivot from working in-office to working at home, and as others leave the organization?

    Scaling and Simplifying Enterprise Endpoint Provisioning

    Companies can unburden themselves by instituting a bring-your-own-PC (BYOPC) policy. BYOPC allows companies to scale back on investments in new laptops while allowing them to scale up their support for remote work. BYOPC provides employees the freedom to work how and from wherever they want, on whatever endpoint makes them most comfortable. Allowing employees to use their laptop of choice also offers the side benefit of helping to maximize worker productivity.

    At the same time, BYOPC helps companies to reap significant capex and opex savings. Permitting employees to use non-corporate devices reduces demand on IT admins’ time while also avoiding cost attributed to the purchase and maintenance of corporate endpoints. BYOPC, then, is a rare win-win for employees and the IT organizations that must support worker productivity, as long as the IT organization can effectively operationalize it.

    Gartner recognizes that BYOPC is on the rise, saying that companies need to “… support BYOPC practice, as it will be necessary for a long-term work-from-home strategy.” Further, our own research bears this out: in a survey we conducted recently in conjunction with Team8, we found that more than three out of four companies (78%) allow employees to access corporate networks or applications from a non-corporate device.

    Pairing BYOPC with a New Model for Endpoint Security

    Of course, a company can’t simply institute or dramatically scale a BYOPC policy without deploying or commensurately expanding a robust endpoint security policy. And this is where things get interesting: according to Forrester, spending on endpoint security had been rising, year-over-year, even before COVID-19 pushed so many companies to expand their remote access policies. During 2020, that investment has soared. However, we also know that 70% of security breaches start at the endpoint. So, it’s reasonable to conclude that something in the endpoint security ecosystem has to change, regardless of whether companies institute BYOPC or stick with traditional provisioning of corporate-managed devices to provide secure remote access.

    Companies have traditionally relied on a variety of isolated workspace approaches to provide corporate security while permitting workers to download questionable applications or visit dubious websites. Think app sandboxing or legacy remote access solutions like virtual desktop infrastructure (VDI) or desktop-as-a-service (DaaS). VDI and DaaS separate desktop images and applications from the user’s device. The images and applications reside on servers that are usually positioned in the cloud.

    Authorized users access VDI or DaaS resources from thin clients, corporate-managed laptops or user-owned devices, leaving no corporate assets vulnerable on the endpoint. With app sandboxes, threats that come in from the sandboxed application are contained within the sandbox, preventing malware from affecting the operating system (OS).

    These isolation methods have provided some level of protection, but each has shortcomings that experienced bad actors are able to exploit. Likewise, browser isolation is yet another strategy that works well within its confines – blocking malicious web content – but browser isolation also leaves other vectors completely exposed. Given that each of these isolation methods has significant gaps that leave corporate assets vulnerable to attack, the isolated workspaces market has been ripe for disruption.

    That disruption has come in the form of OS-based isolation. OS-based isolation allows an end user to have multiple operating systems on a single endpoint, allowing unrestricted access to the internet, email and non-privileged information via an unlocked OS while reserving a second, privileged OS for accessing only high-value corporate assets, including sensitive data and other systems.

    This privileged OS restricts internet access, prevents the user from installing or running unsanctioned applications, and rejects all peripherals. Corporate data is encapsulated on the same endpoint in the isolated environment and cannot be exfiltrated.

    From an enterprise perspective, key attributes of an enterprise-grade OS isolation solution must include purpose-built tools to centrally manage isolated environments remotely, supported by a robust and fine-grained set of networking, clipboard and data security policies such as access control, application management and insights across the entire workforce. With OS-based isolation, breaches may still happen in the non-corporate environment, but there’s no possibility of exfiltration of malicious code, meaning the corporate environment remains protected.

    There were days when every employer provided its workers with company-managed mobile devices. In many cases, those days are long gone. It may still take a while before the expectation of working on a company-provided laptop becomes nothing more than a memory, too. But the time is right to give workers the freedom to use an endpoint of their choice without opening up the company to security threats. Doing so will make workers happy, relieve the budget pressures on IT, and still allow security teams to sleep at night. That’s what we call a win-win-win trifecta.

  • How MLOps Can Help Get AI Projects to Deployment

    How MLOps Can Help Get AI Projects to Deployment

    Did you know that most AI projects never get fully deployed? In fact, a recent survey by NewVantage Partners revealed that only 15% of leading enterprises have gotten any AI into production at all. Unfortunately, many models get built and trained, but never make it to business scenarios where they can provide insights and value. This gap – deemed the production gap – leaves models unable to be used, wastes resources and stops AI ROI in its tracks. But it’s not the technology that is holding things back. In most cases, the barriers to businesses and organizations becoming data-driven can be reduced to three things: people, process and culture. So, the question is, how can we overcome these challenges and start getting real value from AI? To overcome this production gap and finally get ROI from their AI, enterprises must consider formalizing an MLOps strategy.

    MLOps, or machine learning operations, refers to the culmination of people, processes, practices and underpinning technologies that automate the deployment, monitoring and management of machine learning models into production in a scalable, fully governed way. Laying an MLOps foundation allows data, development and production teams to work collaboratively and leverage automation to deploy, monitor, manage and govern machine learning services and initiatives within an organization. In short, MLOps can help enterprises see AI projects through to deployment at scale by addressing the three previously mentioned barriers: people, process and culture.

    People

    There’s a skill, motivation and incentive gap between teams developing machine learning models (data scientists), operators of those models (DevOps, software developers, IT, etc.), and the business leaders who look for the results of that work. By providing actionable visibility into the different steps of the machine learning model life cycle for these different roles, MLOps can increase collaboration across departments so that enterprises can streamline the process of getting models operational and finally meet strategic goals.

    Process

    Operations teams are geared towards ensuring overall quality of service, optimizing runtime environments on their cloud, resource management and role-based access, among many other tasks. Data science teams are often unaware of the considerations these dependencies require, and, hence, models they create do not take these tasks into consideration. Additionally, lack of a proper native governance structure as it pertains to machine learning models – with system, performance, life cycle, and user logs – stifles troubleshooting, as well as hinders legal and regulatory reporting. Organizations that don’t properly monitor their models end up introducing potential risk to their organizations. When production models don’t reflect the ever-changing patterns in data and user behavior, these factors may affect the accuracy and overall performance of the model. Machine learning-based applications are far more sensitive to production environments than typical software applications. Therefore, machine learning models need to be validated and updated over time to ensure that they’re performing properly and leveraging the most accurate and recent data. As part of implementing an MLOps strategy, by having the right monitoring processes in place to detect drift – and many other machine learning-specific metrics – enterprises can ensure their models are delivering the most accurate results, and that their projects are more likely to move forward.

    Culture

    Fear of failure (or worse) can delay organizations from collaborating to operationalize machine learning models, or prevent this entirely. Leadership needs to be clear about their commitment to the process and fully support teams in enduring the hardships involved. This is only compounded by the fact that machine learning applications typically tend to involve processes that might introduce material risk to the company. To stay on top of such transformations while still producing trustworthy value, enterprises must keep careful tabs on all model deployment processes and the updates they entail. Many operations professionals are not aware of the unique characteristics and sensitivities of machine learning. As their role is focused on managing mission-critical production environments, they are often solely concerned with the implications on their work that deploying machine learning into production might have. While these are justifiable concerns, in the final analysis, they serve as trivial reasons for significant delays in progress and deployment. The way to mitigate all these risks and get all teams aligned around these common goals is to implement a solid MLOps strategy that matches the goals and unique position of the organization and its various teams’ responsibilities.

    MLOps: All Systems Go

    MLOps allows organizations to alleviate the people, process and culture issues posed by machine learning. MLOps provides a strategy and a set of processes and best practices, a technological backbone, for managing and scaling machine learning-based services through automation. It also provides for seamless collaboration between the data science teams responsible for generating models with the teams that are accountable for running the services in production environments. This combination of process automation with role-based collaboration and governance capabilities helps pave the way toward strategic AI goals. Specifically, MLOps can help organizations move from anticipating the management and scaling of machine learning services into production and turn that into reality.