Category: Application Performance Management/Monitoring

  • LogDNA Adds Usage Quota Tools to Help Control Costs

    LogDNA Adds Usage Quota Tools to Help Control Costs

    LogDNA announced today it will enable IT teams to apply usage quotas to help rein in log management costs.

    Tucker Callaway, CEO, LogDNA, said as applications become more complex – thanks, in part, to the rise of microservices – the amount of log data that a DevOps team can collect has significantly increased. IT teams can now assign DevOps teams both hard and soft quotas to limit the amount of log data collected during a specific time period, Callaway said.

    IT teams can set a daily or monthly hard limit on the volume of logs stored or, alternatively, they can also set soft daily or monthly quotas that can apply throttling logic to ensure mission-critical log data will continue flowing through LogDNA as usage volume approaches the limit threshold. It will then be up to each IT team to determine, based on the tasks at hand, whether to enable a DevOps team to exceed those thresholds, Callaway said.

    IT teams can also make use of soft limits to reallocate storage resources from one DevOps teams to another based on how much log data might be generated in a specific time period, Callaway noted.

    LogDNA will notify team members any time a quota is hit, or when an exclusion rule is triggered because a quota has been reached. Those alerts can also be integrated with email systems or the Slack messaging platform. Logs that are not retained are not counted toward the monthly bill, but are displayed and will trigger other relevant alerts.

    In the wake of the economic downturn brought on by the COVID-19 pandemic, IT organizations are, generally, more sensitive to costs. At the same time, many of them are encouraging developers to assume more responsibility for application life cycle management as they embrace DevOps best practices. The usage quotas are intended to enable IT teams to strike a better balance between what can be two competing agendas, Callaway said. IT leaders are not necessarily trying to discourage DevOps teams from collecting log data as much as they are trying to make sure costs are predictable, Callaway added.

    Log data, of course, is one of the core elements of any observability strategy. While observability has always been a core DevOps principle, the number of organizations that have been able to meaningfully achieve it has been limited. However, as organizations start to deploy microservices with multiple dependencies, the need to provide context when troubleshooting those applications has become more acute.

    It’s not clear to what degree more granular control over log data might sway an IT organization toward one platform versus another. However, when it comes time to justify a choice to senior IT and business leaders, it’s always a good idea to address, at some point, how one decision versus another might have a more positive impact on the bottom line.

  • Lightrun Tool Now Debugs On-Premises Apps

    Lightrun Tool Now Debugs On-Premises Apps

    Lightrun today announced it has made its namesake debugging tools available for applications deployed in on-premises IT environments that, for one reason or another, can’t be deployed on a cloud platform.

    lan Peleg, CEO of Lightrun, said Lightrun is unique in that software teams can capture live production data from software installed on their customers’ sites via a set of command line interfaces (CLIs). That approach eliminates the need for the end customer to set up a separate environment to troubleshot an application, said Peleg.

    Instead, software teams can troubleshoot their software without requiring on-site visits by support engineers or even a phone call, Peleg said.

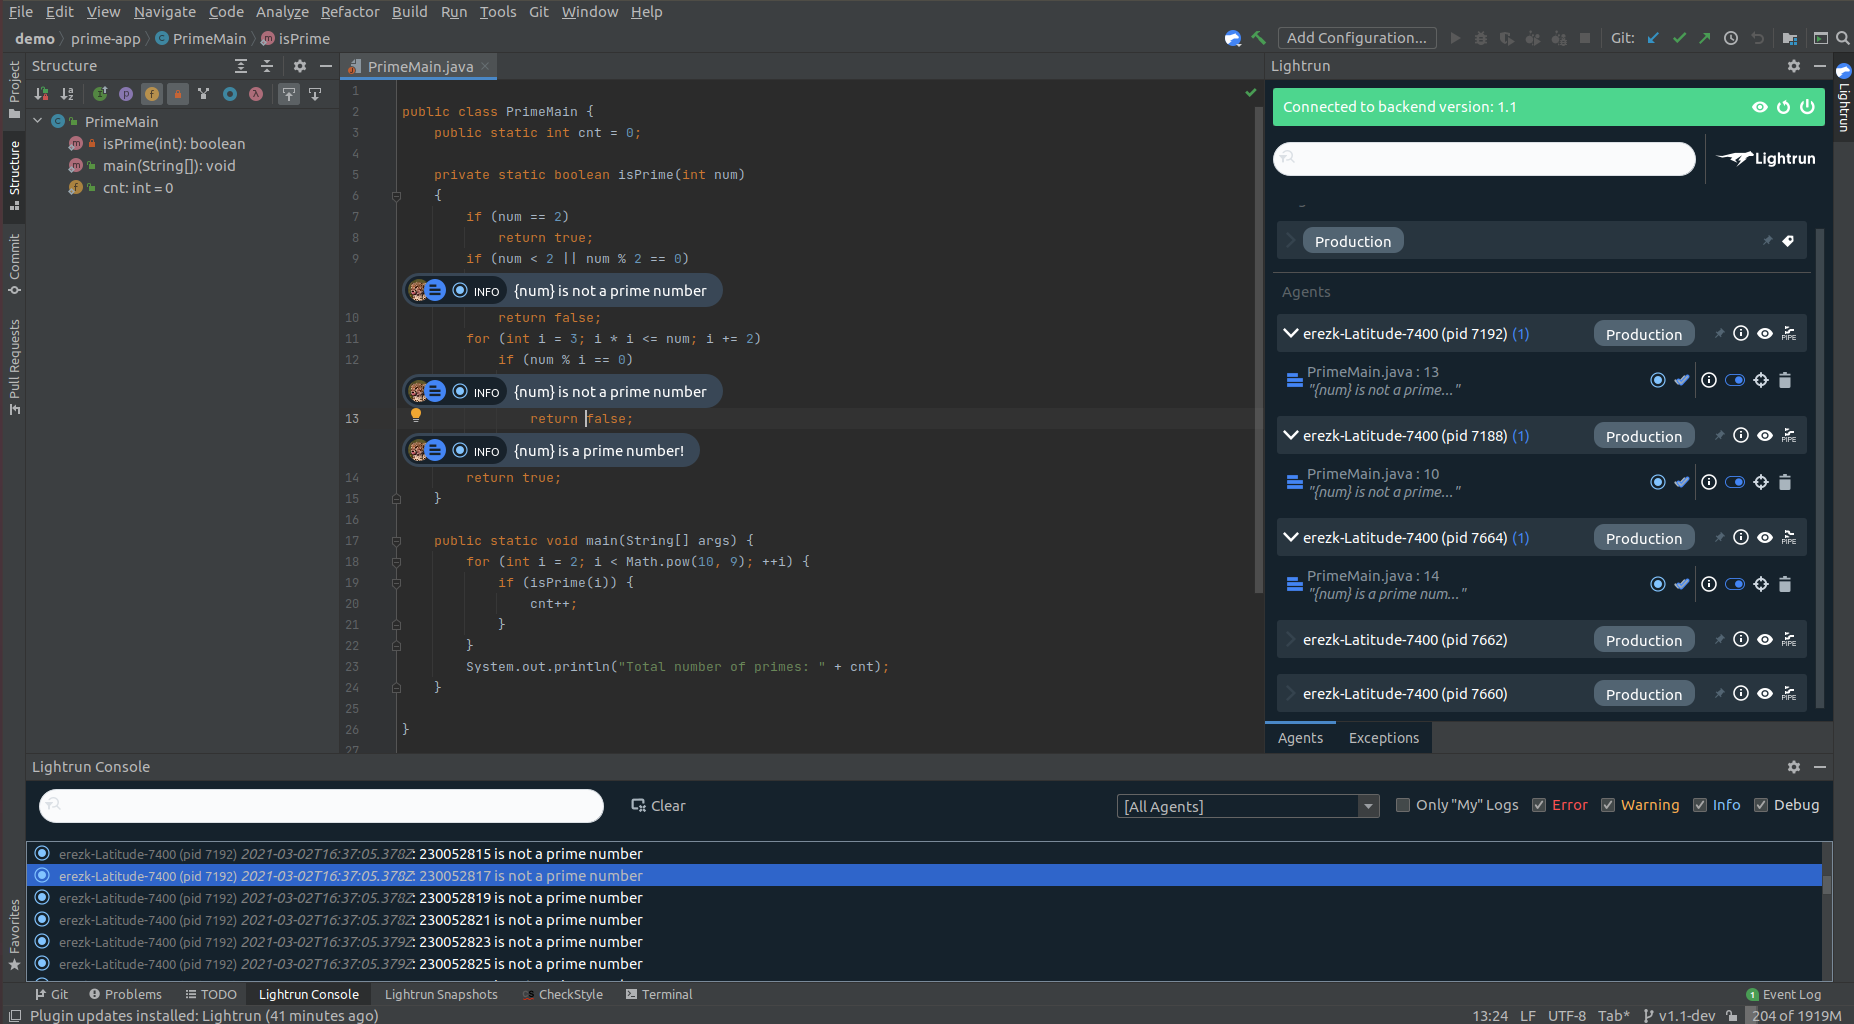
    Lightrun makes it possible to add logs, virtual “breakpoints” and metrics while an application is running. Those capabilities are critical because many applications are not fully instrumented. Lightrun makes it simpler to triage issues by adding a missing log line, instrumenting a new metric or taking a snapshot of an application as it runs in a production environment. Those capabilities make it possible to find bottlenecks and errors without requiring the application to stop running.

    The performance impacts of Lightrun range from tens to hundreds of microseconds per invocation to minimize overhead, Peleg said.

    In general, Peleg said, debugging applications is becoming more challenging. Monolithic applications continue to grow in size while emerging microservices-based applications have dependencies that make them challenging to debug. Many organizations are employing application performance management (APM) platforms and other observability tools to try and address these issues. However, those platforms require IT teams to continuously collect data, and even then there is no guarantee the insights needed to troubleshoot an application will be surfaced. Lightrun, conversely, makes it possible for developers to troubleshoot an application and capture the metrics needed in real-time. That data can then be shared with an APM platform to make it easier to address similar issues if required, Peleg said.

    As developers become more accountable for application performance, many of them are not going to want to employ the same tools and processes that IT operations teams have historically relied on. Lightrun provides a lighter-weight approach to troubleshooting applications, within the context of a DevOps workflow, that doesn’t require as much overhead, said Peleg.

    Although observability is a core DevOps principle, many organizations have been unable to achieve it in a meaningful way. There is no shortage of tools for monitoring IT environments, but correlating all the data those tools generate is problematic. It’s not uncommon for organizations to spend weeks trying to identify the source of an issue that only takes a few minutes to fix. Now that developers are assuming more responsibility for managing the entire lifecycle of an application it is likely different approaches to achieving observability will be considered.

    In the meantime, as the number of applications deployed in production environments continues to increase, different approaches to debugging software will be required. Otherwise, at the current rate of deployment, it won’t be long before developers find themselves spending most of their time debugging existing applications, versus actually writing new code.

  • Value Stream Management Consortium Makes Debut

    Value Stream Management Consortium Makes Debut

    A consortium dedicated to advancing the adoption of value stream management best practices is being launched today with backing from Digital.ai, HCL Software, Plutora, ServiceNow and Tasktop.

    The Value Stream Management Consortium (VSMC) will create an open community around which organizations that are seeking to expand DevOps workflows and processes across functions and organizations can more easily collaborate.

    VSMC chair Helen Beal said that while value stream management has been around as a concept for years, the number of organizations that have fully embraced the concept remains relatively small. The VSMC is dedicated to enabling organizations to orchestrate software development processes more flexibly, she said.

    VSMC Chair Helen Beal

    That goal has proven elusive, because it requires a level of collaboration between release managers, DevOps managers and product managers as well as IT and business leaders. Value stream management provides a framework for enabling organizations to embrace value stream management concepts as they become more adept at employing DevOps workflows to manage multiple application development initiatives simultaneously.

    Initially, Beal said, the VSMC will function as a central hub of information and education pertaining to value stream management. Ongoing research will track how organizations measure value. Eventually, the VSMC will provide certified training, Beal added.

    The concept of value stream management traces its lineage back to lean manufacturing methods, which called for each step of a manufacturing process to be continuously measured. As software development has evolved from being a craft to a process that is automated as much as possible using DevOps best practices, an appreciation for the value of monitoring things such as the impact of missed software development deadlines on the business is growing steadily as organizations realize how dependent on software they have become.

    As organizations come to terms with this new reality, many also realize there is a much greater need to align software development with their core business processes. Value stream management platforms automatically take technical metrics, gathered via a DevOps process, and match them to a set of key performance indicators (KPIs) defined by business leaders. The challenge many organizations still face is making sure they have the tools in place to collect the appropriate technical metrics and then define the KPIs that truly matter to the business. Once those metrics are gathered and KPIs established, organizations are then able to apply advanced analytics to the massive amounts of DevOps data they collect.

    Business leaders are especially anxious to understand how any software development project delay might impact future revenue projections. Rather than being a set of tools employed mainly by IT leaders to track software development projects, value stream management platforms make it possible for other stakeholders to track KPIs spanning multiple software development projects. It then becomes easier to make informed decisions about how to reassign resources across various projects as different bottlenecks are encountered.

    It may be a while before organizations achieve that level of DevOps sophistication, but as software continues to eat the world it’s only a matter of time before value stream management becomes the table stakes organizations will need to survive and, hopefully, thrive.

  • How to Build Actionable Logging Systems

    How to Build Actionable Logging Systems

    Logging is often considered an automatic process that doesn’t require much thought. We see logs, in general, from any system and take for granted that those logs have the information that’s needed. However, thinking through a logging strategy and architecture is extremely important for troubleshooting and performance efficiency. Regardless of how you log, the most important part of logging, after simply having logs in the first place, is having logs you can actually use. Actionable logs provide enough information, enough detail and enough history to ensure you can use the logs to get something done.

    Let’s examine an example system. This example system is an application, with a microservices architecture, running on a Kubernetes cluster that lives on top of an RHEL box. By default, you get logs from the operating system and Kubernetes. But to get logs for the different microservices, you have to program those logs into your application while building the codebase. So how do you set up useful, actionable logs successfully?

    Three Main Considerations

    Consider the following elements when you think about building actionable logs.

    Enough Information

    Your logs should provide enough information to answer ‘when,’ ‘who’ and ‘where’ for any event. As an example, let’s say you want access logs. If there was an access event for your system, the log line for that access event should tell you when that access occurred; this is known as the timestamp. The log line should also include information about who accessed the system. Often, this detail comes in the form of an IP address or other identifier, and the ‘who’ should include not just human interaction, but also actions by other systems. Always log every access! Finally, the log line should include the location from where the system was accessed, meaning which service or which part of the platform was accessed.

    Enough Details

    Your logs should provide enough details to tell you exactly what happened during any single event. Simply answering the who, when and where doesn’t actually tell you what happened, and a basic answer such as “This pod started,” doesn’t provide enough detail to differentiate a code change triggering a pod restart from a system crash triggering the orchestrator to restart pods.

    Enough History

    Finally, your logs should provide enough history to understand why something happened. Logs, overall, help you understand the context of the action that was taken. Writing log lines to a terminal somewhere without storing them is pointless. A single log line doesn’t provide you with enough context to understand the “why” for any action or event. How could you tell if an event was normal for a system without an easily accessible history?

    All three of these components are necessary to create a plan that will lead to actionable logs—logs you can actually use to understand what happened, why it happened, and how you can act to handle the situation. If you can answer who, what, where, when and why from your logs, you probably have actionable logs, and are well on your way to meeting or exceeding logging best practices.

    Next-Level Considerations

    Once you’ve thought through those higher-level considerations, you can think about the nitty-gritty of your logs themselves. When I think about the practicalities of logging, I think about these main considerations: log levels and data needs, format and structure and security and compliance

    Log Levels and Data Needs

    Using log levels properly ensures that you collect and store the data that you need, and only that data. Logging can get very noisy, very fast in modern environments. Log levels provide the ability to fine-tune your logs to store only what you need; this can help you find information quickly in an emergency, rather than digging through the haystack for the proverbial needle. In addition, someone is more likely to keep logging capabilities turned on when it gets noisy if they have the ability to reduce the noise and fine-tune the information, versus having only an on-off switch.

    Different programming languages use different combinations of log levels, but all of them have general categories of major, minor and debug logs. Major logs, as you might guess, should be on for all environments. Minor logs, generally, are turned on in environments for which you need to be able to understand the data flow without necessarily knowing the minute details. Finally, debug logs are generally turned on in dev or QA environments, and only when you need to know every detail – such as when you’re looking for issues that could turn into problems later on. You will need to ensure the necessary log levels are set in your code, as they aren’t necessarily automatic, but taking this extra step is worthwhile.

    Format and Structure

    You need to think about who or what is the primary audience of your logs. If you anticipate sifting through the logs yourself, you’ll likely not mind a text-based format. However, most modern logging uses machines to parse the logs and make the mounds of data more useful. In that case, you should use structured logging; JSON is the standard for structured logs due to the plethora of tools available for working with the standard.

    Security and Compliance

    Logging for security and compliance could be (and has been!) a full article, on its own. The short version, however, is that logging is a key pillar of a compliant system that is aware of, and actively monitoring, its security. If your stack doesn’t log everything to one or more append-only log files, stored in secure location(s) with a read-only archive stored in a separate location, then you’re at risk of an attacker coming in and modifying or deleting logs so you can’t track their actions across your system.

    Your logging processes shouldn’t store personally identifiable information (PII) in clear text or behind an easily broken cypher, either. It’s better to keep that PII in a secured and hashed database, with a unique identifier (UID) that correlates to the database, if you definitively need to keep that PII in your logs in some form, or strip it out if you don’t need it.

    Working Together

    All of these tips are fine and dandy, until you realize that you cannot get enough buy-in from others to ensure everyone follows the same best practices. It’s generally best to come to an agreement as to logging standards and practices across an organization. That will also help, as anyone working on a different system will start from the same baseline, and not have to understand another team’s standard, if they come in to help in an emergency. Ops teams working across many systems will appreciate the standards, as well. To get everyone to the table in the first place, start by appealing to each of their needs. Ask about people’s problems with logging and listen to responses. You likely will need to address assumptions folks make, misconceptions, complacency and resentment. The key is listening; you won’t get buy-in until everyone feels heard and validated.

    To get everyone on the same page, you should first identify, as an entire organization, the needs you have from your logs based on the components of actionable logs. Ensure everyone has a seat at the table and the ability to discuss and unearth all needs, so no one is tempted to go around the team’s decision. One team’s needs will not match another’s, so you need to ensure that all viewpoints are heard and accounted for. Then, organize related needs and set standards for those needs. Once you’ve agreed to your new standards, work together to update your systems. This will take time, just like it does with resolving any technical debt! Start with smaller systems, or less-critical systems, so you can monitor how the standards are surfacing in real life, and how well everyone’s needs are met. Adjust, if you need to, with everyone’s agreement. Needs and standards will change, just like your systems will, and they need to adapt to fulfill the needs of your teams. If you take the time to get everyone to the table and make sure everyone is on board, you’ll be better off.

    What You Need to Succeed

    Logging may seem like simple magic that ‘just works,’ but there’s a lot to think about before you can have a successful, useful system. You need actionable logs that have enough information, details and history to be useful. You need to think about the data you need for all of your various systems, how you’ll structure that data and how you’ll ensure you stay secure and compliant. Finally, you need to ensure your team is on board with standards so logging can be as useful as possible. If you do all of that, though, you’ll find logging becomes a great way to communicate across teams and organizations to ensure you deliver the best product possible.

  • Datadog to Meld Observability and DevSecOps

    Datadog to Meld Observability and DevSecOps

    Datadog is planning to expand the scope of the security and observability services it provides following the acquisitions of Sqreen, an application security platform provider, and Timber Technologies, a provider of a tool, called Vector, for collecting and normalizing log data.

    Ilan Rabinovitch, vice president of product and community for Datadog, said Vector makes it possible to collect, enrich and transform logs and other observability data from both on-premises and in-cloud environments in a way that makes it easier to route that data to wherever it is needed via a data pipeline.

    Sqreen is a provider of a software-as-a-service (SaaS) platform that detects, blocks and responds to application-level attacks using runtime application self-protection (RASP) capabilities enabled by a web application firewall (WAF) embedded within an application.

    Rabinovitch said as IT continues to evolve, it’s clear organizations are looking to embrace DevSecOps best practices in a way that will require security tools that can be embedded within an application, coupled with observability tools that provide more context about the overall IT environment. That context is especially critical, given the amount of data that needs to be analyzed to determine the potential scope of a security threat to an IT environment, Rabinovitch said.

    The Datadog platform is already widely employed to monitor cloud computing environments. There is an industry wide effort to take monitoring to the next level by enabling observability, which applies analytics to provide more context. Surfacing that context, however, requires the ability to normalize data across a pipeline using Vector, Rabinovitch said.

    Of course, the Vector tools are equally applicable to DevOps workflows that have yet to incorporate security technologies. The goal, now, is to make it easier for IT teams, made up of developers, IT operations teams and security specialists, to collaborate by breaking down the various data silos created by IT and security management tools.

    It’s too early to tell what impact the rise of DevSecOps will have on roles within IT organizations. Most organizations will continue to employ a range of specialists that will be able to work more closely with IT generalists, Rabinovitch said. Managing IT is becoming the equivalent of a barn raising, in that it requires members of a community with different skills to come together for a certain amount of time to accomplish a specific task, Rabinovitch added.

    It’s also not clear whether IT organizations view observability as a distinct capability separate from monitoring, or whether they will simply view observability as the next logical extension of existing tools. At the core of that issue is debate over whether observability platforms need to be acquired separately, as part of an effort to replace existing monitoring tools, or whether those tools will evolve over time to provide observability capabilities.

    Regardless of the path forward, it’s apparent the increased complexity of modern IT environments – made up of microservices, containers and serverless computing frameworks – is about to force that issue.

  • How to Respond to Rising Cloud Costs

    How to Respond to Rising Cloud Costs

    As organizations ascend to the cloud, their cloud expenses are floating to the same lofty heights. But are all cloud costs necessary? The answer is a resounding no — there’s a lot of waste.

    In 2020, organizations wasted $17.6 billion on idle cloud resources and cloud overspending, according to ParkMyCloud. Data egress, upgrades and subscriptions to SaaS tools also crowded the cloud invoice inbox. With digital innovation a pressing concern, cloud spend is forecasted to rise significantly in the coming years. Without the right fiscal discipline in place, companies face escalating fees.

    I recently met with Eugene Khvostov, VP of product management at Apptio, to discover how organizations can rein in cloud and SaaS spending. According to Khvostov, IT departments require increased visibility, optimization and responsibility if they are to curb the cloud checkbook. Below, we’ll see what he means and discover useful tips for reducing unnecessary expenditures. Following these general guidelines could help right-size your cloud offerings across AWS, GCP, Azure and other cloud-based tools.

    Where We Are With Cloud Costs

    The pandemic has ushered in significant growth in the cloud computing and SaaS space. We’re also seeing a multi-cloud fracturing effect, as cloud service providers like GCP and Azure reach parity with AWS offerings.

    Cloud tooling grants extraordinary flexibility, elasticity and scalability. Being able to spin up or wind down an instance on a whim has permanently altered how software architecture is built. Yet, with great cloud power, comes great responsibility. “How do I make sure I’m not wasting money in the cloud?” Khvostov asked.

    According to Khvostov, as more organizations move to hybrid and decentralized multi-cloud models, more and more questions arise: What is the total cost per service? Who is spending what? Is cloud spend actually driving growth, and, if so, how much? How are new tools being procured?

    Three Cloud Financial Management Strategies

    To address these concerns and plan for cloud spending increases, Khvostov recommended three general strategies. These three phases can be thought of as research, remediation and prevention.

    1. Access and Visibility

    “You’ve got to have access and visibility,” said Khvostov.

    First, companies require access to their spending data. In this case, large, general invoices are not granular enough. You need breakdowns by service, said Khvostov, to access more fine-grained spending habits.

    Second, you need to equate those spending habits to team usage. This requires improved visibility into your organizational structure and service usage tracking at a team-by-team level.

    2. Optimize

    Next comes optimization. Ensure cloud footprints are appropriately sized for each application, and ensure you don’t have any idle resources, Khvostov said.

    Where do you have the opportunity to optimize? Well, it could be as simple as shuttering an orphaned volume, such as an Amazon Elastic Block Store (EBS), which could persist even after an EC2 instance is terminated.

    “BS volumes tend to persist unless you select the Delete on Termination,” AWS explained. So, check your configurations. Amazon provides a way to detect this using OpsCenter.

    3. Responsibility

    Once things are optimized, you need to maintain standards. “You must ensure teams drive responsibility for spend management and optimization,” said Khvostov.

    But how do you instill an optimization mindset and empower engineers to take action? Khvostov said it’s all about demonstrating a measurable return on investment (ROI) and continuing discussions between stakeholders.

    A recent report from A Cloud Guru found that 90% of organizations plan to expand their cloud services over the next one to three years, but 44% lack a plan to upskill their workforce. Most groups have their work cut out for them if they are to assign accountability for cloud costs ownership.

    Specific Cloud Costs That Bite

    So, what are some other particular areas we should be watching? Well, arguably, the most common cost is hidden data transfer fees. Surprise ingress and egress fees can be costly — take the story of Chris Short, whose personal site was charged $2700 for an unexpected 30.6 TB data transfer.

    Watch out for other cloud costs around:

    • Services automatically launching or autoscaling.
    • Idle resources due to “orphan” instances or overprovisioning.
    • Price lock on granular commitments. You could be stuck in a savings plan on an Amazon EC2 R5 instance, which would be lost upon upgrade to R6. (Khvostov acknowledged that AWS has remedied this situation, to an extent).
    • Legacy, less-efficient code can rack up cloud costs, The Information reports.

    The Cloud Economist Role Is Trending

    To unearth these costs, some believe a brand new role is required. A cloud economist is a cloud financial manager that helps spot fees, directs further cloud optimizations and calculates overall ROI from cloud investments.

    The rise of cloud financial offers is an accelerating trend, Khvostov said, one that requires the right tools and practices within an organization to become a trusted ally. “It’s definitely a legitimate role in the sense that it’s critical to organizations,” said Khvostov. “It’s specialized enough that it requires technical and financial skills.”

    Hiring a cloud economist, or building a cloud financial center of excellence, could provide a lot of value. Yet, gauging the ROI of this role isn’t immediately obvious. Some optimizations could take time to visualize, Khvostov said. A certain change could instantly invoke 20% cost savings, but you may not register that impact for 30 days or more.

    “It’s not just about cloud infrastructure — it’s about your SaaS spend, as well,” Khvostov added. He believes companies desperately need a window into what infrastructure-as-a-service (IaaS) and automation, like Chef or Jenkins, cost, along with the time savings and dollar ROI their usage equates to — because, he said, “You can only right-size what you know.”

    Trimming Cloud Spend and Cloud Costs

    Some IT folks simply fail to understand the implications of their cloud resources. Surprisingly, a recent survey by SoftwareONE revealed that 30% don’t realize that everything in the cloud is metered. To rectify this knowledge gap, organizations could use better awareness into their cloud holdings.

    The cloud is the future, and we must prepare responsibly. Yet, having fiscal discipline in a world where every software function is commodified “as-a-service” is tricky — teams require financial visibility into their cloud holdings. To rein in costs, Khvostov recommended treating it as a continuous process: access and visualize spending data, optimize your existing cloud footprint and disseminate responsibility among teams.

    Once you have a better frame of reference, you can begin to right-size cloud, right-size SaaS and appropriately right-size the team. Eventually, with the right multi-cloud and SaaS financial management strategies, perhaps that cloud bill will start to feel a little lighter.

  • New Monitoring Features in PostgreSQL 13

    New Monitoring Features in PostgreSQL 13

    Every monitoring solution is limited by the information the system allows to be collected. PostgreSQL DBMS provides many metrics reflecting its internal state, running queries and background processes, and each release brings the community more monitoring-related features. PostgreSQL 13, which was released in September of 2020, added key improvements, including query sampling, improved WAL usage statistics and new system views. Let’s look at the benefits of each of these new features.

    Query Sampling

    Those who regularly monitor database queries are familiar with the following parameters:

    log_statement controls what SQL statements are logged
    log_min_duration_statement enables logging of statements that ran for at least the specified amount of time.

    These parameters help users track down unoptimized queries in applications. However, it is important to recognize that excessive log traffic may impact performance, especially when analyzing workloads with a lot of short queries. To help address this, PostgreSQL 13 introduced two new GUC parameters to allow logging of sampling statements.

    log_statement_sample_rate controls the sample rate (0.0 – 1.0). That is, it allows users to control the percent of queries that are logged.
    log_min_duration_sample defines the minimum required statement duration of queries to sample

    Only statements with a duration exceeding log_min_duration_sample are considered for sampling. Because of this, to enable sampling, both GUCs need to be set correctly. Further, the existing log_min_duration_statement GUC has a higher priority than log_min_duration_sample, so statements with a duration exceeding log_min_duration_statement will always be logged, no matter how the sampling is configured. This means that only configurations with log_min_duration_sample < log_min_duration_statement actually sample the statements, instead of logging everything. Note that only superusers can change these settings.

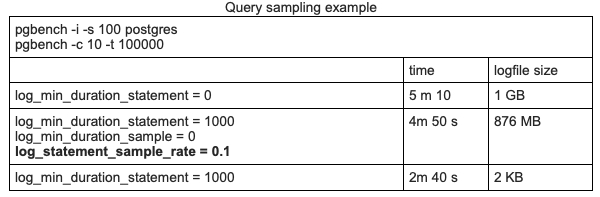
    Consider the following synthetic query sampling test using pgbench on a laptop.

    PostgreSQL 13

    • 1st Row: No sampling. All queries are logged
    • 2nd Row: Log all queries longer than 1 second, plus 10 percent of all other queries
    • 3rd Row: Log all queries longer than 1 second

    In this example, sampling improves timing slightly, but since the test was run on a personal laptop, this measurement does not signify much.

    However, the size difference is very interesting. Sampling helps make the logfile size approximately 10 times smaller. We can figure out that most of the queries in this test lasted less than 1 second. And if we log only long queries, the logfile remains almost empty (third row). The difference here is significant. Even if disk space consumption isn’t a concern, sampling can help speed up tools that analyze PostgreSQL logs.

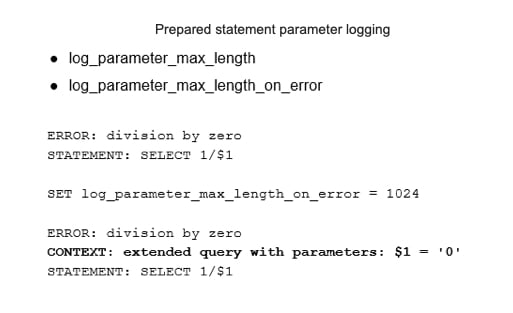
    PostgreSQL 13 also introduced settings to improve control over prepared statement parameter logging.

    If log_parameter_max_length is set, bind parameter values will be trimmed to this many bytes.
    log_parameter_max_length_on_error adds context for the failure of parameterized queries.

    Previously, prepared statement parameters were never logged during errors. Note, since these logging features can impact performance, they should be used with care.

    PostgreSQL 13

    Write-Ahead Log Usage Statistics

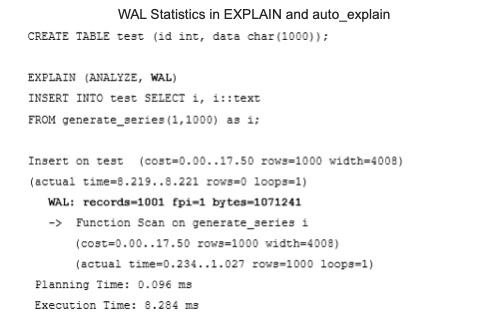
    A write-ahead log (WAL) is crucial to database system durability, and is also used for physical replication. This makes monitoring the WAL important. PostgreSQL 13 allows users to explore WAL usage per query using the EXPLAIN command. The following example shows that the insertion of a thousand rows generates 1001 records and takes about 1 Mb of space. Note that auto_explain also shows this statistic.

    PostgreSQL 13

    It is also possible to find WAL usage statistics in autovacuum log messages. However, this works only when autovacuum logging is enabled with the log_autovacuum_min_duration parameter.

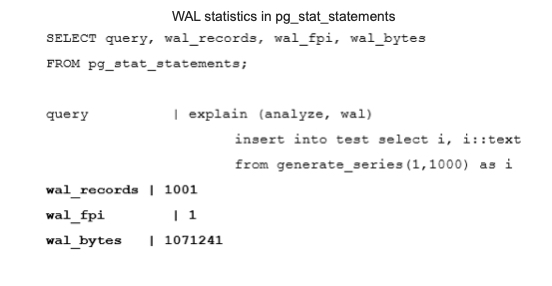
    Probably the most useful place to see WAL statistics for a monitoring plugin is in pg_stat_statements. PostgreSQL 13 has new columns that show WAL usage statistics per query.

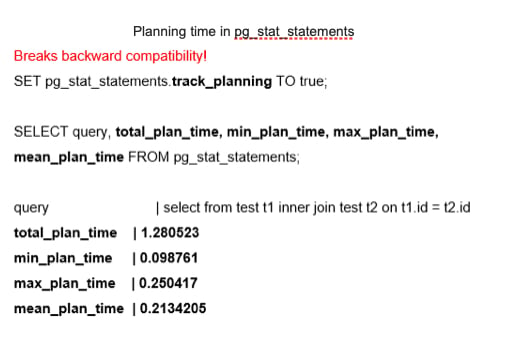
    Another addition to pg_stat_statements is a group of fields to track planning time. This feature is disabled by default because it can cause a noticeable decrease in performance. When enabled, it shows total, minimal, maximal and mean planning time. The pg_stat_statements.track_planning parameter enables this feature. It is important to note that this feature breaks backward compatibility. Previously, existing “time” fields — min_time, max_time, total_time and mean_time — had their suffixes changed from “time” to “exec_time.” As a result, all monitoring tools that rely on pg_stat_statements should be adjusted accordingly.

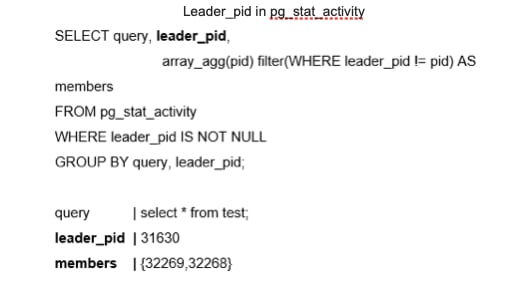
    The next feature provides more information about parallel queries. In the past, parallel queries did not reveal which back end was related to the parallel query or provide easy insight into all the processes involved in a query. It is now possible to show the parallel group leader information, at the SQL level, using the leader_pid in the pg_stat_activity system view.

    New System Views

    PostgreSQL 13 offers new system views that can be used for PostgreSQL monitoring. The first group improves progress reporting.

    pg_stat_progress_basebackup helps to estimate the progress of a base backup of a PostgreSQL cluster.
    pg_stat_progress_analyze shows information about backends running the ANALYZE operation, including autovacuum workers. It can help administrators understand how long it will take to collect statistics.

    Another group of new system views helps answer the following question: “How does Postgres spend its allocated memory?” These views will be mostly useful for DBMS admins and low-level support engineers who inspect bottlenecks and optimize memory usage.

    pg_shmem_allocation can be enabled for a deeper inspection of how shared memory is used for internal DBMS structures, including a lock table, process array, data about various background processes and so on.
    pg_stat_slru is related to the inspection of SLRU caches. SLRU is a special buffer cache where non-user data is stored, such as the state of each transaction, as well as information about subtransactions. Asynchronous notifications also use SLRU.

    Wait Events Changes

    PostgreSQL 13 introduced the renaming of various wait events to improve consistency. The brief reference to this in the release notes does not do justice to the importance of this change. Wait events were added in Postgres 9.6, and are usually needed to diagnose bottlenecks that occur because of interprocess locks. Previously, wait events were named in all possible styles. Now, the naming is more consistent, and the wait events are better documented and, hopefully, more understandable. However, admins need to update any monitoring scripts that use wait events, including the following:

    Hash/Batch/Allocating → HashBatchAllocate
    ControlFileLock → ControlFile
    clog → XactBuffer
    AsyncCtlLock → NotifySLRU

    Several new wait events were also introduced in PostgreSQL 13, including:

    VacuumDelay
    BackupWaitWalArchive, RecoveryPause
    RecoveryConflictSnapshot, RecoveryConflictTablespace

    Upper Limit for the track_activity_query_size Parameter

    One final small improvement in PostgreSQL 13 is worth noting: an updated upper limit for the track_activity_query_size parameter. This parameter specifies the amount of memory reserved to store the text of the command. The previous maximum was 100 KB, which could be too small when monitoring applications that generate large SQL queries.

    The new upper limit is 1 MB. However, keep in mind that the database allocates the amount of memory specified in track_activity_query_size in advance for all potential sessions. Thus, higher values can increase memory consumption.

    The Importance of These Features

    These significant updates in PostgreSQL 13 are vital for admins that run the database and want to tune the system, optimize applications, forecast system growth and do resource planning. However, the new features are also extremely important for DBMS developers who need to gather more information and collect real production statistics about various parts of PostgreSQL in order to find bottlenecks and opportunities to make improvements. As always, we look forward to even more great new features in future releases of PostgreSQL.

  • SolarWinds Unveils Revamped APM Platform

    SolarWinds Unveils Revamped APM Platform

    SolarWinds is unifying its various application performance management (APM) tools within a single suite accessed via a software-as-a-service (SaaS) platform.

    Denny LeCompte, senior vice president for products at SolarWinds, said the APM Integrated Experience offering combines the company’s AppOptics, Loggly and Pingdom tools to collect metrics, traces and logs along with real user monitoring capabilities and tools to simulate application traffic.

    APM Integrated Experience also provides access to a landing page that identifies what has changed in an IT environment over the previous week and highlights which of those changes might become an issue. As most IT professionals well understand, most IT issues can be traced directly back to a recent change made to an IT environment that was previously running as intended.

    Other capabilities include advanced search tools and the ability to inspect lists and maps for hosts, containers and plugins for web servers and databases. In addition, APM Integrated Experience is integrated with both Amazon Web Services (AWS) and the Microsoft Azure cloud.

    LeCompte said the goal is to make it less expensive for the average IT organization to broadly instrument applications using an agent developed by SolarWinds that can automatically be installed.

    Ultimately, the goal is to enable organizations to better manage their software supply chains, LeCompte added. Of course, SolarWinds is at the heart of the software supply chain breach that involved its Orion network management software. That software runs on-premises. In comparison, APM Integrated Experience is a SaaS platform that is more secure. In fact, LeCompte said, IT professionals that manage software supply chains are generally sympathetic to the challenge the company currently faces. Most of those organizations have dealt with similar software supply chain issues, albeit on a smaller scale, LeCompte added.

    In general, LeCompte said it’s apparent most organizations need access to an APM platform that costs substantially less than rival platforms and still delivers 90% of the capabilities they require. In many cases, IT organizations are paying for extra capabilities that only very high-end enterprises require, LeCompte noted. In fact, one of the primary reasons APM platforms are not as widely employed is most organizations have found rival APM platforms simply too expensive to deploy, said LeCompte.

    LeCompte declined to speculate whether there is a meaningful difference between what has been historically known as monitoring and so-called observability platforms that have emerged in recent months. Regardless of approach, however, it’s clear as distributed IT environments become more diverse and complex, the number of organizations that need more visibility into their application environment is steadily increasing, said LeCompte.

    Of course, with the rise of microservices-based applications, that level of IT complexity is only going to increase. As applications grow and expand, the number of dependencies between microservices starts to increase. Understanding how an issue with one microservice is impacting a distributed computing environment will undoubtedly require more instrumentation. The challenge, going forward, will be determining how best to achieve that goal at a reasonable cost.

  • 3 Common App Modernization Pitfalls to Avoid

    3 Common App Modernization Pitfalls to Avoid

    Application modernization has been a consistent theme for organizations year after year. Businesses today still rely on their legacy applications for the majority of their revenue generation, from mainframes to Java EE. New digital transformation initiatives and mandates have pushed application modernization back to the forefront, as a new generation of automation platforms and best practices are helping these organizations avoid the pitfalls of the past and accelerate their journey to cloud-native architectures.

    Here are the three most common application modernization pitfalls and how to avoid them.

    Lack of a Clear Organizational Destination

    Application modernization journeys need a north star – a destination point that development, infrastructure and DevOps teams can rally around. In order to establish a clear, unified direction, everyone must share a precise understanding of that destination. That journey starts by defining a set of business goals you are trying to accomplish (such as cost savings, business agility, resiliency and/or competitive advantage) that can guide and prioritize the technical decisions.

    Next, you need to decide which application modernization technologies, platforms, and infrastructure will help you deliver on those business goals (e.g., Red Hat OpenShift, Kubernetes, serverless, hybrid, private or public cloud, etc.). Setting common architectural standards will help avoid disparate future stacks and ensure a common shared platform for microservices architectures. For example, if an application starts with Java WebSphere, should the goal be to move to a modern container framework like Spring Boot, or a specific microservices Java framework like Quarkus? To avoid analysis paralysis and internal drag, set tangible objectives and targets that prescribe how teams are expected to prioritize, select and modernize these applications and how their progress should be measured, communicated and shared.

    Taking Shortcuts – Don’t Fall For the Old ‘Lift and Shift’

    The more one modernizes, the more value one gets from the cloud – but not all modernization efforts are created equal. For example, ‘lift and shift,’ putting a monolith into a container and application refactoring into microservices are all called “modernization.” But only refactoring allows enterprises to realize the true benefits of the cloud, including elasticity, regained engineering velocity and cost savings. Don’t fall into the quick-and-easy modernization temptation with lift and shift or brute force containerization. You will still have a monolith, in the end; you’ll simply end up paying more and trading one set of monolithic problems for another.

    Not Bringing Everyone Along – No Developer Left Behind

    Modernization is never just about technology. Modernization requires that your team’s processes (for example, agile practices), structure (vertical domain teams as opposed to horizontal teams – UI team, for instance) and skills must all adapt. The organizational culture needs to grow to adopt DevOps and cloud-native best practices to take advantage of the deep development, build, deployment and operational benefits that are available. Take the time to train and educate so everyone is brought along. Modernizing legacy applications can introduce a whole new set of technologists, responsible for those applications and the supporting infrastructure, into the cloud-native world. This is a win-win for everyone.

    In other words, the organization needs to have crystal clear answers to the where (destination), why (path) and how (team) to ensure success and avoid the three most common pitfalls of application modernization.

  • AppDynamics Survey Reveals High IT Stress

    AppDynamics Survey Reveals High IT Stress

    A global survey published today by AppDynamics, a unit of Cisco, suggests the last year took a substantial toll on IT teams at a time when many organizations either launched or accelerated digital business transformation initiatives.

    The survey, of 1,050 IT professionals in organizations with revenue of more than $500 million, finds organizations, on average, implemented digital business transformation initiatives three times faster in 2020 than they did in 2019 in response to the economic downturn brought on by the COVID-19 pandemic. That increased level of activity, however, appears to have come at a significant cost. The survey found 89% of respondents felt they are under immense pressure at work, with 84% admitting to having difficulty switching off after work.

    The survey also found stress levels are, not surprisingly, rising as well, with 81% of respondents experiencing increased frustration and 63% conflicting more with colleagues.

    The root cause of these issues cited most often include new sets of priorities and challenges (80%), technology sprawl and a patchwork of legacy and cloud technologies (78%), acceleration to cloud computing (77%) and multiple, disconnected monitoring solutions (74%).

    A full 85% also identified cutting through noise generated by increasing volumes of data to identify root causes of performance issues will represent a significant challenge in the year ahead. A total of 92% also noted the ability to link technology performance to business outcomes will be what’s really important to delivering on innovation goals over the next year.

    Three-quarters (75%) of respondents said they are already struggling to manage overwhelming “data noise.” Nearly three-quarters (73%) also noted they fear the inability to link IT performance with business performance will be detrimental to their business in 2021. Three-quarters (75%) of respondents also noted their organization needs to connect full-stack observability to business outcomes within 12 months in order to remain competitive. Two-thirds of respondents (66%), however, said right now they do not have the resources and support they need.

    AppDynamics regional CTO Gregg Ostrowski said the survey makes it clear that existing approaches to merely monitoring IT platforms are not going to be sufficient, at a time when observability across the full stack of IT platforms being employed is now absolutely essential. Rather than convening war rooms where IT teams responsible for different platforms compare reports in the hopes of identifying the root cause of an issue, Ostrowski said modern observability platforms provide a holistic view of IT environments that IT teams need to proactively resolve issues before they impact the business.

    That level of visibility will also play a crucial role in reducing the stress levels of IT teams that, in many cases, are now in danger of suffering from burnout, Ostrowski added. Of course, the more fatigued an IT team is, the more likely it is mistakes will be made.

    It’s not clear to what degree IT teams are embracing observability as a core IT management concept. The AppDynamics survey noted that 71% of respondents are wary of misleading claims from vendors who are re-labelling monitoring tools as observability platforms. Regardless of how observability is achieved, the general consensus remains: whatever observability means within the context of IT, most organizations lack it.