Category: Application Performance Management/Monitoring

  • Getting Started With Continuous Monitoring

    Getting Started With Continuous Monitoring

    DevOps continues to gain traction among organizations as demand grows for digital product and platform development. According to Gartner, 87% of business leaders believe digitalization is a priority. Every DevOps transformation requires a dedicated, continuous learning process and effective implementation to reach maturity. If a practice or pattern is passed over or ignored, it can put a damper on DevOps success. Continuous monitoring, for example, is a very important part of every DevOps life cycle that is often overlooked.

    Through effective continuous monitoring efforts, organizations can scale and deliver digital products and platforms faster and more securely. In fact, these continuous monitoring advantages tie directly to modern customer needs. If they haven’t already, business leaders must embrace continuous monitoring along every point of the DevOps life cycle. These best practices can help you get started.

    Understanding Continuous Monitoring

    The practice of continuous monitoring helps to collect and analyze outcomes, statuses, exceptions and key metrics within each step of the DevOps process – from development to deployment and production. Additionally, it offers deep insight for DevSecOps teams by enabling compliance triggers and security alerts configuration. It allows the organization to detect issues or security concerns throughout every phase of the DevOps lifecycle.

    Understanding what continuous monitoring does is a good start. However, to effectively adopt continuous monitoring, the organization must know what to monitor.

    What Should Be Monitored

    An effective continuous monitoring process collects enough data to gain sufficient understanding of both successes and failures of the organization’s systems and processes. Some of the events collected by the continuous monitoring systems will require immediate attention, while others may lead to longer-term strategy discussions.

    Collecting the right information is always tricky considering the number of endpoints that generate logs and events. One should rank the significance of each source in relation to the type of data it produces, the functional area it supports and the impact it has on the system’s performance, as well as on organization’s goals and commitments (requirements posed by SLA’s, regulations, contracts, etc.).

    A combination of technology and strategy helps ensure that the right data is collected at the right time. The next step, and perhaps one of the most significant challenges, is finding the balance between monitoring and analysis.

    How to Achieve Balance

    Balance is, by far, one of the most difficult decisions in log monitoring and analysis. Gather too little data and risk missing early trouble indicators or important alerts. Collect too much and get buried in analysis paralysis – essentially, leading to the same situation of overlooking items of significance. Striking the right balance requires understanding the system’s continuous monitoring processing capacity and using its full potential. This may also involve data preparation steps during intake to ensure optimal processing and storage of the collected material.

    Offloading mundane tasks and parts of the analysis to machine learning and artificial intelligence (ML and AI) and fuzzy logic systems will enable big data processing gains. With this approach, the continuous monitoring capacity can be significantly increased, along with the semantic quality of the alerts and notifications produced by the system. As a result, security operation center (SOC) staff can devote their attention to the analysis of events which are more meaningful to the system and operations, leading to a more efficient continuous monitoring process.

    A DevOps transformation will likely not reach full maturity unless the organization applies continuous monitoring to the DevOps life cycle. Although often overlooked, it remains central to DevOps success. With this in mind, a basic understanding of continuous monitoring, what to monitor and finding the balance between log monitoring and analysis, serve as a foundation for getting started with continuous monitoring.

  • Achieving Reliable Observability Part 1 – Making Cloud-Native Observability More Robust

    Achieving Reliable Observability Part 1 – Making Cloud-Native Observability More Robust

    I was having a conversation with a CxO level customer as part of an AIOps/Observability workshop, and from what I could tell, most are confused about how to properly operationalize cloud-native production environments – especially the monitoring/observability portion. Here is how the conversation went.

    “Andy, we are thinking about getting [vendor] to use for our observability solution based on your recent research. What do you think?”

    “Well, I don’t want to endorse any specific vendor, as they are all good at what they do. But let’s talk about what you want to do, and what they can do for you, so you can figure out whether or not they are the right fit for you.” The conversation continued for a while, but the last piece is worthy of being called out specifically.

    “So, we will be running our production microservices in AWS in the ____ region. And we are planning to use this particular observability provider to monitor our Kubernetes clusters.”

    “Couple of items to discuss. First, you realize that this particular provider you are speaking of also runs in the same region of the same cloud provider as yours, right?”

    “We didn’t know that. Is that going to be a problem?”

    “Not particularly. However, you may get into a ‘circular dependency’ situation.”

    “What is that?”

    “Well, as an enterprise architect, I always call for separation of duties as a best practice. For example, having your developer testing the code is a bad idea, having your developer figuring out how to deploy is a bad idea. In much the same way as when your production services run in the same region as your monitoring software – how would you know about a production outage if the cloud region takes a hit, and your observability solution goes down at the same time your production services do?”

    “Should we dump them and go get this other solution instead?”

    “No, I am not saying that. Figure out what you are trying to achieve and have a plan for it. Selection of an observability tool should fit your overall strategy.”

    For those who don’t understand the above conversation, here is the reason why this scenario could be a problem.

    Coming from an enterprise architecture background, we were taught, as a best practice, to operationalize production systems to avoid circular dependencies. This includes not having two services depend on each other, or not to colocate monitoring, governance and compliance systems as part of the production systems themselves. If you were to monitor your production system, you would do it from a separate and isolated sub-system (server, data center rack, sub-net, etc.) to make sure that if your production system goes down, the monitoring system doesn’t go down, too.  The same goes for public cloud regions – although it’s unlikely, individual regions and services do experience outages. If your production infrastructure is running on the same services in the same region as your SaaS monitoring provider, not only won’t you be aware that your production systems are down, but you also won’t have the data to analyze what went wrong. The whole idea behind having a good observability system is to quickly know when things went bad, what went wrong, where the problem is and why it happened so you can quickly fix it. You can check out this blog where I explain this in detail.

    The best practice would be to either:

    1. Consider an observability solution that runs in a different region than your production workloads. Better yet, consider something that runs on a different cloud provider altogether. Although it is exceptionally rare, there have been instances of cloud service outages that cross regions. The chances of both cloud providers going down at the same time would be slim.For example, if the cloud region goes down (a region-wide outage in the cloud is quite possible, and seems to be more frequent of late), then your observability systems will also be down. You wouldn’t even know your production servers are down to switch to your backup systems unless you have a “hot” production backup. Not only will your customers find out about your outage before you do, but you won’t even be able to initiate your playbook, as you are not even aware that your production servers are down.
    2. Consider having your observability solution in a different location/region, yet still close enough to your production services so latency is very low. Most cloud providers operate in close proximity, so it is easy to find one.
    3. Another option is to get a solution that gives you deployment flexibility. For example, there are a couple of observability solutions that allow you to deploy it in any cloud and observe your production systems from anywhere – both in the cloud and on-premises.
    4. You can also consider sending the monitoring data from your instrumentation to two observability solution locations, but that will cost you slightly more. Or, ask what the vendor’s business continuity/disaster recovery plans are. While some think the costs might be much higher, I disagree, for a couple of reasons. First, because monitoring is mainly time-series metric data, so the volume and the cost to transport is not as high as logs or traces. Second, unless your observability provider is VPC peered, the chances are your data will be routed through the internet even though they are hosted in the same cloud provider. Hence, there will not be much more additional cost. Having observability data, all the time, about your production system is very critical during outages.
    5. A very commonly overlooked consideration is monitoring your full-stack observability system. While it is preferable to have the monitoring instance in every region where your production services run, it may not be feasible either because of cost or manageability. On such occasions, monitor the monitoring system. You could do synthetic monitoring by checking the monitoring API endpoints (or do random data inputs and check to ensure it worked) to make sure that your monitoring system is properly watching your production system. Better yet, find a monitoring vendor that will do this on your behalf.

    When/if you get the dreaded 2 a.m. call, what is your plan of action? Just think it through thoroughly before it happens and have a playbook ready, so you won’t have to panic in a crisis.

  • Best Practices for Digital Experience Management

    Best Practices for Digital Experience Management

    The COVID-19 pandemic put digital services in the spotlight. The winners in 2020 and beyond will be those organizations which provide awesome user experiences for online products, services and apps. There is scant room for error, as digital leaders before the pandemic have upped their game even more.

    For example, streaming service provider Netflix’s 2020 Q4 revenue reached $6.64 billion – almost $14 million more than expected – and added 8.5 million paid subscribers. The company had more than 200 million users in the quarter and saw viewership for non-English titles jump 50% during the year as U.S. viewers sought new content from around the globe.

    Companies in more traditional sectors, such as restaurants and hospitality, also grew by investing further in digital strategies. Chipotle’s 2020 revenue increased 7.1% to $6 billion, with digital sales skyrocketing 174.1% and accounting for more than 46% of sales. Target’s digital sales increased 155% in Q4 while Costco grew e-commerce sales by 91% in FY20, as online ordering and curbside pickup became the new normal.

    Digital Experience Monitoring Basics

    To manage this onslaught of online customers and transactions, IT organizations are turning to digital experience monitoring (DEM). DEM is a broad area, but it comes down to delivering the best experience for your customers and employees by monitoring your IT assets and addressing issues that arise before they become problems. DEM allows you to mimic and test the end-to-end customer and worker experience. Such solutions can be used in on-premises data centers or run in multi-cloud and hybrid cloud environments.

    There are two key methods for DEM:

    Real user monitoring (RUM): This entails using real users’ devices to measure the performance of a page. A script is injected on each page to measure data on page load performance for every request made, monitoring the interaction of an application and the users. The data shows such aspects as how an application is being used and the geographic distribution of users.

    Synthetic monitoring: This technique tests the performance of a page using an automation tool rather than users’ actual experiences. Scripts are used to simulate how a user might move through a web application and then reports are created based on that performance.

    In a recent report, Gartner analysts said DEM products are evolving, moving from a focus on performance and availability to correlating infrastructure and operations (I&O) and business outcomes. Currently, fewer than 15% of digital business initiatives will require I&O leaders to report on business metrics from digital experience; that will jump to 70% by 2025, Gartner says.

    For years, organizations have been using monitoring tools to measure various aspects of their infrastructure. For example, IT operations management (ITOM) solutions track metrics and manage alerts and events for infrastructure hosted on-premises or in the cloud, including servers, networking systems, storage appliances and databases. The data also can be used for historical data analysis and to map out trends.

    DEM is specifically focused on the end user experience, giving IT professionals the visibility to run diagnostics, fix issues and measure performance at each point of contact between the users and the application. Acquiring a new customer is an expensive effort, and a customer can be lost because of a single poor experience. DEM is designed to ensure the optimal experience.

    Getting Started with DEM

    There are two common approaches for implementing DEM:

    Point tools: Domain-specific monitoring tools track and measure different layers of the technology stack, such as networks and applications. The upside to this approach is you get more in-depth coverage from the point tools, but it can lead to tool sprawl, which impairs visibility and increases costs.

    Platform: This approach provides native monitoring for many areas and integrates with other tools, as needed, to deliver a central, unified view that makes it easier to see everything at once. However, it doesn’t include best-of-breed performance or the deepest analysis capabilities you will want in every area.

    An important first step is to identify the metrics and outcomes priorities for your organization. Then spend time researching the proper toolset for the goals you want to achieve. If you decide on deploying multiple single-domain monitoring tools, remember that you will need an integration strategy. The tools will need to easily share data and display that centrally, to deliver a holistic view of digital experience. Integration is also critical for troubleshooting and connecting metrics to a specific business service. You also will need subject matter experts in these technology domains who can ensure that the DEM tool(s) keep pace with advancements in IT infrastructure and development technologies.

    The Future of Digital Experience Monitoring

    The DEM field is evolving, with more parts of the I&O stack coming under its purview. Solutions will offer more capabilities and be easier to integrate out of the box with other tools because the end-to-end flow doesn’t stop with monitoring and collecting metrics. ITOps staff need to take action on critical alerts with efficient workflows and intelligent recommendations. AIOps and machine learning analytics are playing a growing role here.

    DEM can reduce time-to-value for customers and workers, simplify and ease onboarding to new sites and apps and ultimately increase interactions and sales. Advanced solutions can fuel predictive analytics, form a deeper understanding of user behavior to optimize websites and apps in step with user requirements and dynamic infrastructure changes. In a digital-centric world, DEM capabilities are critical to the health and future of organizations in every sector.

  • Data Theorem Extends Scope of App Analyzer Portfolio

    Data Theorem Extends Scope of App Analyzer Portfolio

    Data Theorem, Inc. today added to its portfolio a Cloud Secure analyzer that promises to provide full stack visibility into applications through the client, network and cloud layers of a distributed computing environment.

    Doug Dooley, Data Theorem COO, said Cloud Secure extends an existing Analyzer Engine offering that is currently widely employed to identify vulnerabilities found in applications running on public cloud services. That enables DevOps teams to analyze application runtimes using a tool that can be integrated within a continuous integration/continuous delivery (CI/CD) platform as part of a DevSecOps workflow, Dooley noted.

    Cloud Secure now extends that capability to include the client layer for both mobile and web applications, as well as REST and GraphQL application programming interfaces (APIs) at the network layer, to provide a more comprehensive approach to attack surface management, Dooley said. That’s a crucial capability, because in modern IT environments, the single biggest attack surface is now all the APIs that need to be secured, Dooley added.

    DevOps teams can also employ multiple Cloud Hacker Toolkits, created by Data Theorem, to simulate hacks against various types of applications, including those now running on serverless computing platforms. That approach eliminates the need to rely on manual penetration tests that can’t keep up with the rate at which DevOps teams are now building and deploying applications, Dooley noted. For organizations to achieve DevSecOps, the whole security process needs to be just as automated as the rest of the DevOps workflow, he added.

    In general, Dooley said most of the results of penetration testing shared with DevOps and cybersecurity teams lack much-needed context. They may inform members of an IT team that there is a leak, for example, in an S3 bucket hosted on a cloud storage service from Amazon Web Services (AWS). However, they don’t identify what type of data is at risk. That’s critical information at a time when IT organizations need to make high-stakes decisions about where to prioritize their DevSecOps efforts.

    As developers assume more responsibility for application security, the biggest challenge organizations will face is finding security tools that can be easily integrated into application development processes that have become more extended as applications, made up of microservices, are deployed across highly distributed computing environments.

    It’s still early days as far as adoption of DevSecOps best practices are concerned, but as more tools become available, it’s becoming more feasible for organizations to make that transition from the bottom up. No developer sets out to deliberately write and deploy an insecure application. However, DevSecOps edicts issued from on high will fall on deaf ears if the developer lacks the tools required to achieve the goal. Tools that a developer embraces are going to be more widely employed than any tool that is specifically mandated by IT leaders that don’t really understand how applications inside their organization are constructed.

    Regardless of how DevSecOps is achieved, the one thing that is certain is as more applications get deployed, the probability there will be a major security incident becomes all but certain.

  • Cisco Leans on HashiCorp to Manage Infrastructure as Code

    Cisco Leans on HashiCorp to Manage Infrastructure as Code

    HashiCorp and Cisco today announced a Cisco Intersight Service for Terraform offering based on HashiCorp Terraform Cloud Business software.

    Cisco Intersight is an IT operations management platform that enables IT teams to manage IT infrastructure across a hybrid cloud computing environment. Open source Terraform tools have emerged as the dominant tool for provisioning infrastructure as code in the cloud and, increasingly, in on-premises IT environments.

    HashiCorp Terraform Cloud Business is an instance of Terraform that has been extended to include some additional security and governance capabilities enterprise IT organizations typically require.

    In recent years, Cisco has significantly expanded its presence in on-premises IT environments as many IT teams opted to deploy its servers alongside its networking equipment. Like every other provider of on-premises IT environment, Cisco has been moving to extend the reach of its management frameworks to public clouds to help foster the rise of hybrid cloud computing.

    Prior to the pandemic, most public clouds and on-premises IT environments were managed in isolation from one another. However, in the wake of the economic downturn brought on by the pandemic, more IT teams are trying to centralize the management of IT platforms as part of an ongoing effort to reduce the total cost of IT. The multiyear alliance with HashiCorp fills a major hole in the Cisco management portfolio, as Terraform increasingly becomes a de facto standard for provisioning IT infrastructure-as-code.

    Vijay Venugopal, head of product management for Cisco Cloud and Compute Software, said the alliance with HashiCorp will make it possible to provide Terraform support across a management portfolio that, over time, continues to be enhanced with machine learning algorithms that add artificial intelligence (AI) capabilities, also known as AIOps. That platform is already being employed by 6,000 customers to manage more than 600,000 servers, running primarily in on-premises IT environments, added Venugopal.

    HashiCorp Terraform Cisco

    It’s unclear how the battle for control over hybrid cloud computing will ultimately play out. While providers of on-premises platforms such as Cisco are making a case for using existing management frameworks to also manage workloads deployed on public clouds, the providers of those platforms are now extending their reach into on-premises IT environments. Cisco is, of course, betting that most organizations would prefer to extend an existing framework to achieve that goal, versus having to rip and replace existing IT infrastructure to employ an alternative framework from a cloud service provider.

    Regardless of how organizations ultimately decide to manage IT in the age of the hybrid cloud, it’s clear developers, thanks to tools such as Terraform, are exercising more direct control over IT infrastructure. Incorporating Terraform within a larger IT management framework presents an opportunity to bridge the divide between developers and IT operations teams that have historically relied on visual tools to provision infrastructure. The challenge now is finding a way for developers and IT administrators – with varying levels of programming expertise – to work more closely as management of IT environments become increasingly more complex.

  • Visualization Shines a Light on IT Metrics

    Visualization Shines a Light on IT Metrics

    Modern IT departments operate in a pressure cooker. Their highly distributed infrastructures are spread across legacy data centers and hybrid and multiple public clouds. Now, the Internet of Things (IoT) and the edge are part of the mix.

    Massive amounts of data are flowing through these multifaceted environments, and it falls on IT to make sense of it all, ensuring that issues don’t become problems and that it’s viable to produce measurable outcomes for the business. Dashboards are instrumental for visualizing and quickly making sense of that data.

    Metrics – numeric representations of data measured over time – give IT operators and site reliability engineers (SREs) a window into how a system has historically behaved. That data provides insights as to how the system(s) should perform in the future, and aids investigations when something goes awry. IT monitoring tools act as giant data lakes, holding time series data, while dashboards give everyone from IT administrators to C-level executives ways to easily digest the data.

    The visualization market is evolving. We’re seeing different kinds of databases, such as Prometheus, which bring with them new tools to leverage the data. Prometheus (PromQL) is growing in popularity in the DevOps space and becoming the standard for monitoring containers and microservices because it makes it easier to manage time series data. PromQL also comes with client libraries that include four core metric types:

    • Counter: Represents a single monotonically increasing counter where the value can only increase or be reset to zero on restart.
    • Gauge: Represents a single numerical value that can arbitrarily go up and down, such as CPU utilization.
    • Histogram: Samples observations and counts them in configurable buckets. It also can provide a sum of all observed values.
    • Summary: Samples observations and provides a total count of observations and a sum of all observed values. Configurable quantiles are calculated over a sliding time window.

    Selecting Visualization Charts

    Selecting the appropriate visualization dashboard for each user is important to maximize the value of the data. There are traditional line and bar charts, single value tiles – which display a single data point at a specific point in time – and lists and gauges, which offer a single value at a specific point in time in a series.

    Newer visualization types are now becoming common to address the various use cases in ITOps and DevOps. Let’s walk through a few:

    1. Honeycombs offer big-picture views of IT infrastructure, yet also display detail. The hexagonal display mirrors those in a honeycomb, and helps DevOps pros slice and dice the data based on attributes or tags. Each hexagon represents a specific host or resource, and can be organized in logical groups of elements. The colors change when thresholds are reached, and the hexagons can be sized differently based on the value of the metric. Consider a case of many AWS EC2 instances scattered across the globe. Each hexagon can represent an individual instance, and they can be grouped based on the “region” attribute. This honeycomb chart would let administrators see how each infrastructure site is performing.
    2. Gauge metrics use a language like PromQL to set a ceiling and a floor. If the user creates alert conditions based on particular thresholds, the dashboard will indicate if a certain resource has reached its threshold by changing the color. A gauge that turns red may indicate a critical problem, for example. Managed service providers have SLAs with clients to maintain uptime. If a problem arises, a red indicator on a gauge tile lets the IT administrator know immediately that the SLA agreement has been breached, and that an issue needs to be addressed.
    3. Heatmaps provide a graphical representation of the volume of data points within bucketed ranges. The color of each cell of a heatmap directly reflects the density of certain metric value ranges. Heatmaps are used to display group trends and spot outliers, which make them useful when viewing metrics with a wide distribution of values.

    Role-Based Requirements

    Picking the right chart depends in part upon the people viewing the data. CXOs, IT managers, sysadmins, SREs, network engineers and network operations center (NOC) operators will have different, yet overlapping, requirements.

    For instance, SREs want to ensure the reliability and resiliency of the infrastructure, so, through their dashboards, they look at everything from availability and latency to performance, efficiency and capacity planning. They can quickly spot outliers like server downtimes or memory issues and immediately begin to troubleshoot.

    CXOs, conversely, don’t need to get into the weeds of infrastructure operations. They use dashboards to gain a macro view of metrics for performance over time across websites and networks. They need to understand the correlation between IT metrics and business services and applications. Dashboards should be able to connect those dots.

    Other Considerations

    Finding the right visualization option is important. Once that is done, there are some other steps to take to ensure you get the insights you need from your dashboard:

    Positioning and ordering: Dashboard tiles should be placed in a logical order, with important high-level statistics near the top and the deeper, and more granular metrics progressively moving to the bottom to give users a quick understanding of system performance.

    Design: A well-designed dashboard with consideration paid to color schemes and themes also will make it easier for stakeholders to digest and understand the data.

    IT infrastructure performance is crucial to the health of a company. Massive amounts of data streaming out of systems can help IT administrators and others keep up-to-date about that performance and the overall end-user experience. Dashboards offer flexible ways to quickly view and understand the metrics; IT organizations now have a growing range of charts to choose from that can present the data they need in a way that works best for them.

  • LeanIX Extends Application Management Reach

    LeanIX Extends Application Management Reach

    LeanIX today unveiled a catalog that enables DevOps teams to more easily track the relationships between microservices as they are built and deployed.

    At the same time, the company also revealed it has acquired Cleanshelf, a provider of a platform for managing software-as-a-service (SaaS) applications.

    LeanIX CEO André Christ said the Microservice Intelligence catalog will make it simpler for IT organizations to keep track of their ongoing software development efforts, while Cleanshelf provides the mechanism for centralizing management of SaaS applications that are now widely employed across the enterprise.

    The Microservice Intelligence catalog is the latest addition to the LeanIX Continuous Transformation Platform used to manage enterprise applications. It automatically captures and correlates metadata being generated across disconnected toolchains, pipelines and Kubernetes clusters to create a 360-degree view of microservices and their dependencies, said Christ.

    In addition to being integrated with the LeanIX Enterprise Application Suite, Microservice Intelligence comes with out-of-the-box connectors for Kubernetes, Jenkins, GitHub Actions and Red Hat OpenShift platforms.

    By monitoring deployment frequencies, mean-time-to-recovery (MTTR) and failure rates, Christ noted it will become easier to make software engineering decisions based on data and insights surfaced via the Microservice Intelligence catalog. DevOps teams can also annotate the microservices recorded by the catalog to provide additional information, Christ added.

    The Microservice Intelligence catalog provides the added benefit of making it easier to onboard new developers, said Christ. Each new member of a development team can, on their own, explore the overall application environment without requiring an IT team to dedicate someone to describe it each time a new member of a DevOps team is hired, Christ noted.

    At the same time, other stakeholders, such as cybersecurity teams, can explore the application environment to better understand dependencies as well as the potential impact of a newly discovered vulnerability, Christ added.

    In general, Christ said, as application life cycle management across the extended enterprise becomes more complex it’s clear new platforms will be required to manage legacy monolithic applications, emerging microservices-based applications and SaaS applications that, in the wake of the COVID-19 pandemic, are being used to enable employees to work from home. The Cleanshelf platform, in particular, will be rebranded as LeanIX SaaS Intelligence to address that latter issue. A SaaS discovery and cataloging capability will also be made available as a free component of the LeanIX Application Portfolio Management module in the second quarter.

    IT environments have never been more distributed, and it’s clear most organizations are under pressure to reduce the total cost of IT by centralizing management functions. It’s too costly to dedicate a management platform for each type of application deployed across an extended enterprise. LeanIX is making a case for a platform that enables IT organizations to finally centralize the management of application environments.

    It’s unclear at what rate that centralization may occur, given the level of inertia that exists within most IT organizations today. However, as application lifecycle management continues to evolve, the centralization of the management of application portfolios that continue to grow is all but inevitable.

  • Grafana Labs Aligns with Elastic on Observability

    Grafana Labs Aligns with Elastic on Observability

    Elastic and Grafana Labs have allied to create a plugin through which DevOps teams that are employing Elasticsearch within a DevOps workflow will be able to invoke a monitoring platform, based on Prometheus, that is managed by Grafana Labs.

    Raj Dutt, Grafana Labs CEO, said both companies are dedicating engineering resources to building and maintaining a plug-in for a service, based on open source Prometheus software, that is rapidly becoming a de facto standard for observability in DevOps environments. One of the primary reasons for that expanded usage is that Grafana Labs doesn’t require DevOps teams to move data into a central repository to analyze it, Dutt said.

    The overall goal is to eliminate the “tunnel vision” that results when relying on tools that only visualizes a narrow set of metrics, Dutt added.

    The cloud platform provided by Grafana Labs is based on open source Grafana visualization tools. The primary tool for visualizing Elasticsearch data is based on open source Kibana tools. Grafana, however, is based on a fork of Kibana, so the plug-in represents an effort to bring those two open source communities closer together. The two companies plan to collaborate on including more aggregations, broader query language support and support for space-saving constructs like rollups as the partnership evolves.

    Grafana Labs provides a cloud service that aggregates data, pulled from multiple instances of Prometheus, deployed on clusters and servers. Prometheus, especially, gained a lot of traction as organizations began to deploy Kubernetes clusters that are also based on open source software. Both Kubernetes and Prometheus are being developed under the auspices of the Cloud Native Computing Foundation (CNCF).

    Once DevOps team initially employ Prometheus to monitor Kubernetes, they frequently expand deployments to monitor additional platforms. That shift has resulted in many providers of proprietary monitoring tools to extend the data they consume to include the metrics captured locally by Prometheus. Grafana Labs claims it has more 1,000 customers, including Bloomberg, JP Morgan Chase, eBay, PayPal and Sony, for a total of more 650,000 active installations of Grafana around the globe. Existing customers of Elastic that are paying for Elasticsearch support include Cisco, eBay, Goldman Sachs, Microsoft, The Mayo Clinic, NASA, The New York Times, Wikipedia and Verizon.

    It’s not clear to what degree Grafana and Kibana might ultimately re-converge one day, but it’s clear there will be a fair amount of ongoing cross-pollination across the two projects. In the meantime, DevOps teams should be able to opt for whichever open source visualization framework they prefer alongside Elasticsearch.

    In the longer term, it’s clear greater appreciation for observability platforms that provide more context will drive a wave of consolidation among all the monitoring tools that enterprise IT teams rely on today. As part of the transition, enterprise IT teams might even standardize on a set of visualization tools that would eliminate the need to master different user interfaces. After all, the only way to actually achieve observability is through a set of tools that makes surfacing the context required easier to consume.

  • Logz.io Adds Prometheus Service to Observability Portfolio

    Logz.io Adds Prometheus Service to Observability Portfolio

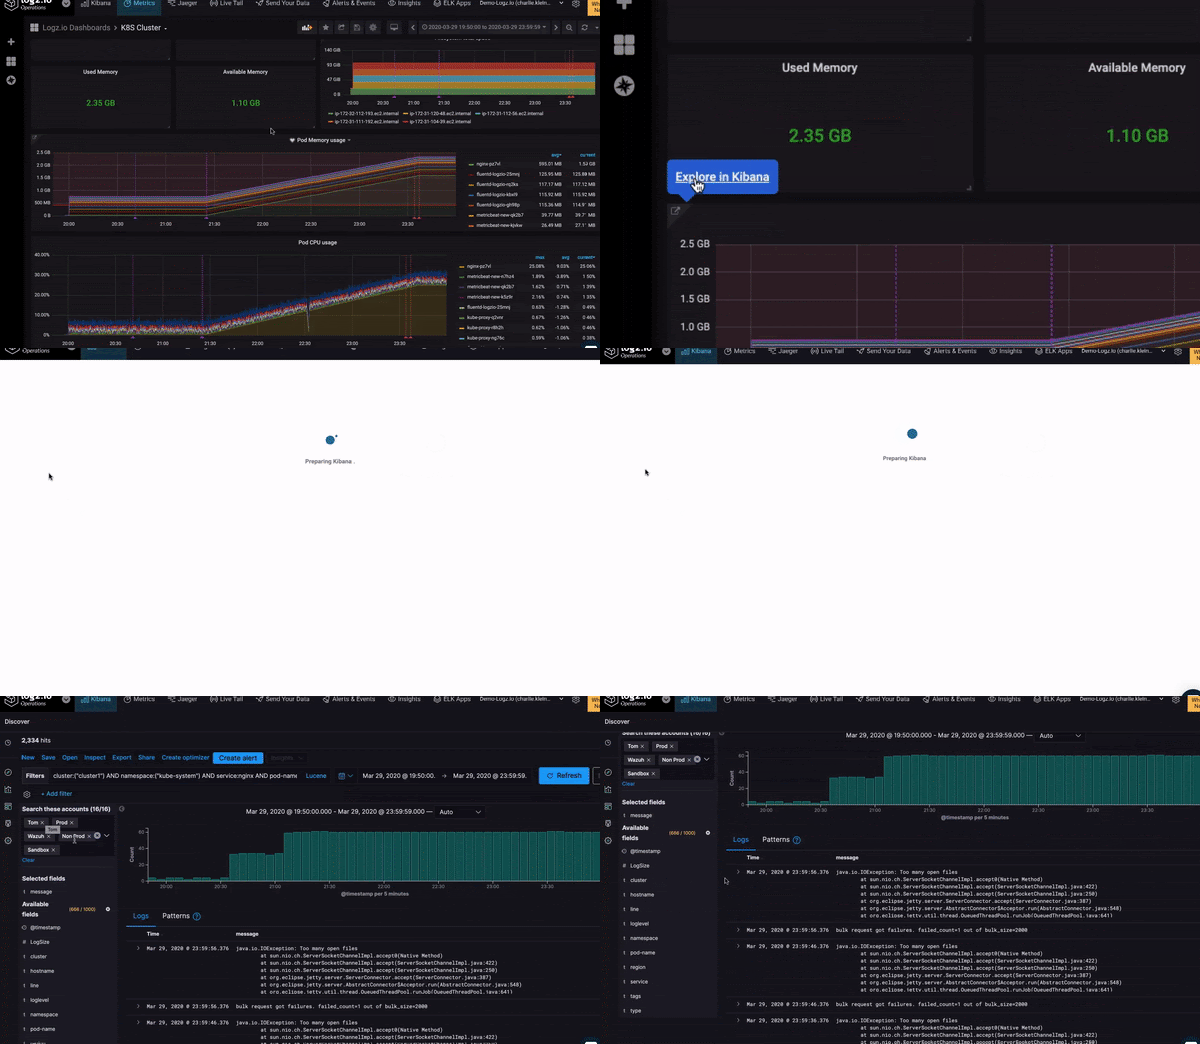
    Logz.io announced today the general availability of a cloud service, based on Prometheus, that can collect and analyze metrics alongside its existing log management service.

    Jonah Kowall, CTO, Logz.io, said the goal for Prometheus-as-a-Service is to provide IT teams with a centralized approach to analyzing data collected from instances of Prometheus running on local servers and clusters. While Prometheus is relatively easy to deploy, it’s not designed to scale horizontally, which means IT teams have to deploy multiple instances of Prometheus on a fleet of clusters and servers. The Logz.io service makes it easier to aggregate and analyze all the data those instances of Prometheus collected, said Kowall. That approach not only offloads the storage of those metrics, Kowall said, it presents an opportunity to correlate that data against logs and traces that Logz.io already collects.

    Logz.io, as part of that effort, is also making it possible to upload a Grafana dashboard, typically employed to visualize Prometheus data as a JSON file, to Logz.io, which will then convert the Grafana dashboards to dashboards based on the Logz.io user interface.

    While Prometheus is closely identified with Kubernetes, IT teams are starting to deploy the open source monitoring tool more widely to collect metrics. A recent Gartner report predicts that, by 2025, half of new cloud-native application monitoring deployments will rely on some form of open-source software to instrument applications. As part of that transition, Prometheus has already emerged as a de facto standard, Kowall noted.

    The primary focus, at least initially, is still on monitoring IT platforms, but as IT teams start to correlate metrics, logs and traces, they begin to benefit from additional context, otherwise known as observability, Kowall said.

    Observability, of course, has always been a core DevOps principle. However, as more applications become instrumented using open source tools and agent software, it’s becoming less costly to achieve. DevOps teams will still need to instrument each application, but the costs associated with collecting metrics and other data continues to decline. Most providers of monitoring tools and observability platforms are moving toward adding support for open source tools and agents to collect data alongside the proprietary tools and agent software they already make available. It will be up to each DevOps teams to decide whether to rely on open source tools or continue to rely on proprietary software that may be able to surface deeper insights or is simply easier to deploy.

    Regardless of the path chosen, the rise of microservices-based applications with numerous dependencies is forcing the observability issue. Microservices-based applications may not crash as frequently as a monolithic application because they are, ideally, designed to degrade gracefully in the absence of a single point of failure. The challenge is that, once they do degrade, it’s difficult to pinpoint the source of the issue; this may result in applications running sub-optimally for an extend period of time.

    The good news is that DevOps teams should now have the tools required to diagnose and resolve those issues long before any end user notices.

  • Why Developers Should Care About Resilience

    Why Developers Should Care About Resilience

    Recently, a friend reminded me of a joke we used to have when we were both developers at a huge software corporation (we won’t mention names, but back when printers were a thing, you probably owned one of theirs). We didn’t develop printers. We developed performance testing and monitoring tools.

    We were the dev team, which was completely separate from the QA team and from the Ops team (yes, I’m that old – we didn’t even call it DevOps back then). Support was part of a completely different organization and “business” was something that happened in an altogether different galaxy. That is, until a customer had an issue.

    When an important customer had an issue, we definitely felt it at R&D. Managers called hourly to check on status, and we would have intense conversations with the support team who would then, in turn, have intense discussions with the customer. If we, the software engineers developing the product, ended up on the same call with both support and the customer, it was a sure sign that things were bad. You knew that millions of dollars were on the line, and, consequently, that pressure was high. But most of all: you knew that we would do anything we could to solve the problem, because we needed those millions of dollars to be paid, so that we could keep getting paid. And so, we kept the coffee flowing.

    This is where the joke part comes in. We used to have a system for managing support tickets, collecting information, tracking time and assigning it to the relevant software or support engineer, so everyone would know who was in charge. Today, you probably use Zendesk, ServiceNow or one of their alternatives. We used a home grown system, of course.

    Our joke was this: the purpose of the system was not to track and measure and propagate the handling of customer issues. The purpose of the system was to indicate someone else is now responsible for solving the problem. Or, if you would rather paraphrase one of my favorite Douglas Adams jokes, the issue is now under a Somebody Else’s Problem field.

    Because solving customer issues is difficult and frustrating, and being pressured by business could ruin a software engineer’s day. This is because when you’re a happy code monkey, and all you want to worry about is writing beautiful code and releasing cool features and drinking some coffee, solving a customer issue gets in your way.

    You end up spending too much time sifting through endless logs, crossing your fingers and trying to reproduce an issue that only happens at 2 a.m. on a Friday, usually when a blue zebra is passing by. Spending your time on a heated support call is less fun than, say, drinking coffee quietly with your friends.

    As R&D managers, we understand that our developers want nothing to do with solving customer issues. We want to make sure they are motivated and happy and efficient, and that they are free to challenge themselves by learning the latest buzz-worthy technologies and thinking up ways to introduce those into our product in a way that will make our customers happy.

    Additionally, as R&D managers, we are far more likely to understand the business impact of having too many support tickets or having support tickets that take too long to resolve. We know that the loss on such cases is twofold:

    1. The customer that faced an issue and is waiting for a solution may become frustrated, and the company may lose their business.
    2. Our engineers are busy solving that customer issue instead of delivering new value to the business.

    Therefore, as R&D managers, it is our responsibility to make sure that our engineers have the tools to handle these issues as efficiently as possible when they come up. It is our responsibility to make sure they are motivated, and that they understand the business impact of solving a customer issue as quickly as possible. And whenever possible, it is our job to make sure that they make our application as reliable and stable as possible to begin with.

    That ensures that we have test coverage, and the right knowledge, practices and tools to ensure that we have as few customer issues as possible to begin with.

    Happily, changes in dev culture usually means that “support” and “business” and even “customers” are not as far away as they used to be. When developing a SaaS platform, your developers often have an almost intimate, real-time ability to track what users are doing and how it impacts their experience. The culture of DevOps has done a lot for breaking the silos that used to separate the dev team from the support team, and to make sure that all members of the team engage and understand how the code they write and the issues they resolve help our customers.

    I hope you already found the way to motivate your team to solve such issues, and that they have enough time to drink coffee. If you and your team are still struggling, we suggest bringing in a live debugging tool that can help them solve customer issues even faster, by making sure they have all the data they need at their fingertips, and that they can instantly reproduce any issue in a live, remote environment. Live debugging tools give your engineers a developer-friendly experience, and also gives them the power to reduce issue resolution time, too. Now, all you need to worry about is that your engineers have enough coffee.