Category: Application Performance Management/Monitoring

  • Grafana Labs Adds On-Premises Observability Platform

    Grafana Labs Adds On-Premises Observability Platform

    Grafana Labs announced today the availability of a unified Grafana Enterprise Stack that enables IT teams to deploy a curated observability platform, based on open source tools such as Prometheus, in their own on-premises IT environment.

    Tom Wilkie, vice president of product for Grafana Labs, said Grafana Enterprise Stack, in addition to providing a version of Prometheus optimized for distributed computing environments, includes curated instances of open source Grafana dashboards, Loki log aggregation tools and the Cortex query engine.

    Grafana Enterprise Stack also includes plugins for visualizing data from other commercial tools in Grafana, such as Splunk, New Relic, MongoDB, ServiceNow, Oracle and Snowflake. In addition, it includes reporting tools and enhanced authentication and security controls.

    Grafana Labs

    Developed under the auspices of the Cloud Native Computing Foundation (CNCF), Prometheus has gained traction as a monitoring platform used primarily in Kubernetes environments. However, Wilkie said it’s only a matter of time before IT organizations expand their use of Prometheus to include a wider range of platforms. The Grafana Enterprise Stack facilitates that transition by making it easier for organizations to deploy a complete observability platform based on open source software, said Wilkie.

    While open source software has a key role to play in enabling observability, most IT organizations today rely on a range of proprietary tools to monitor IT environments. Many of those tools will be replaced, in the months ahead, by observability platforms that provide more context than individual monitoring tools currently do. However, it’s not clear yet if IT teams will prefer open source or proprietary platforms that, in most cases, incorporate open source components.

    As IT environments become more complex, the tools most organizations rely on today don’t surface enough actionable insights. Most IT teams today still waste a fair amount of time navigating amongst multiple tools in an effort to discover the root cause of a problem. It’s not uncommon for IT teams to take days to discover the source of a problem that is then fixed in a few minutes. The expectation is that observability platforms will sharply reduce the amount of time and effort required to investigate, for example, a performance issue.

    Of course, to achieve that goal, applications themselves will need to become more instrumented. A mix of open source and proprietary agent software will make it easier to collect traces, logs and other metrics at a reduced cost. In many cases, IT teams have been reluctant to fully instrument an IT environment, because of both the cost of proprietary agent software and the inherent challenges associated with deploying and managing it across an extended enterprise. However, as the deployment process for agent software becomes more automated, organizations are finding it easier to instrument their applications.

    It may be awhile before IT environments are fully instrumented. However, as it becomes easier to collect traces, logs and metrics, the level of observability that can be achieved across an enterprise will undoubtedly increase. The challenge and the opportunity then becomes employing the greater visibility provided by these platforms to manage the sprawl of applications and platforms across IT more proactively.

  • Survey: Fixing Bugs Stealing Time from Development

    Survey: Fixing Bugs Stealing Time from Development

    A global survey of 950 developers published today finds more than a third (38%) of developers spend up to a quarter of their time fixing software bugs, with slightly more than a quarter (26%) spending up to half their time fixing bugs.

    Conducted by the market research firm Propeller Insights on behalf of Rollbar, a provider of artificial intelligence (AI) tools to detect software errors, the report also notes that 88% of developers find traditional error monitoring tools are not meeting expectations.

    Daniel Day, vice president of marketing at Rollbar, said the survey makes it apparent that continuing to rely on manual processes to surface errors in code is having a major downstream impact on both DevOps teams, in particular, and the business as a whole.

    For example, nearly nine in 10 developers (89%) also noted that undetected errors take a big toll on the business. More than one-fourth (26%) of developers also said that their employers have lost a significant number of users due to errors in software. The same share (26%) said software errors damage their company’s reputation and its ability to attract investments, and nearly a fifth (18%) said that undetected software problems anger their company’s investors.

    Nearly a third (32%) of developers said they spend up to 10 hours a week fixing bugs instead of writing code, while 16% said they spend up to 15 hours a week. Another 6% said they have to dedicate up to 20 hours a week fixing bugs instead of writing code.

    More than half of developers (55%) said that if they didn’t have to spend so much time fixing bugs, they would have the time to build new features and functionality. Many of these errors are not addressed because current tools require them to manually respond to errors (39%); it takes too long to find all of the details they need to fix bugs and errors (36%); focus on system stability and not enough on code health (31%); make it difficult to detect errors (29%); and have an approach to error aggregation that is either too broad or too narrow (23%).

    Nearly two-thirds of developers (62%) said they have found out about errors from users reporting through the application, while a quarter (25%) said that they have heard about errors from users sharing these issues on social media. Another 17% said media coverage clued them in about errors in their software, while more than a fifth (21%) said they heard about them from their CEO.

    Nearly a third of the survey group (31%) said that manually responding to errors makes them feel frustrated, while more than a fifth (22%) said they feel overwhelmed when using manual processes to address errors in software. Nearly as many (17%) said it leads to burnout. More than a tenth (12%) said it elicits feelings of resentment, and 7% said it makes them want to quit their jobs.

    Nearly two-thirds of all developers said they would rather do an unpleasant activity than fix errors, including pay bills (26%), go to the dentist (21%) and spend time with in-laws (20%).

    Rollbar clearly has a vested interest in convincing developers to increase reliance on AI to surface errors in code. The productivity paradox holds that, the more application code developers write, the more time they spend fixing existing code than writing new code. Most developers have a lot better things to do with their time than manually combing through lines of code looking for those errors. In fact, the problem is, many of them simply don’t have the time required to catch all the issues before an application makes it into a production environment.

  • LinearB Aligns with Clubhouse to Advance Project Management

    LinearB Aligns with Clubhouse to Advance Project Management

    LinearB, a provider of an analytics application for software delivery projects, announced today it has allied with Clubhouse, a provider of a project management application that includes built in collaboration tools.

    LinearB’s analytics application uses code, Git logs and releases to automatically construct and visualize detailed timelines without requiring any manual input. That data can now also be automatically fed into the Clubhouse project management application.

    Dan Lines, COO, LinearB, said the goal is to make it possible for any project participant to keep track of updates without spending hours manually compiling and entering data into a project management application.

    In addition, DevOps teams can use both applications to gain visibility into every feature, bug and chore via a live feed of activity generated by branches, pull requests and releases for Clubhouse stories. Along with tools for tracking individual activity and collecting metrics, blockers, delays, high-risk code and branches merged without review for Clubhouse stories are also highlighted. There is also a shadow work detector that detects activity in a Git repository that is not attached to a Clubhouse story.

    Lines said one of the project management challenges organizations face today is the tools they employ only allow them to see segments of a DevOps pipeline. The LinearB analytics application unifies the data and metrics required to make an informed decision, without having to first collect and then normalize data residing in different tools. Instead, all the metrics required to make an informed decision about how best to allocate limited software development resources is automatically collected from the tools the DevOps team employs, Lines said.

    There is no need, then, for project managers to pester members of a DevOps team to enter data in a separate analytics or project management application, Lines added. Given the rate at which application development projects are now updated, much of the data manually entered into a project management application is usually outdated, anyway.

    LinearB employs the application programming interfaces (APIs) exposed by DevOps tools to gather the existing metadata about the status of any given project. LinearB then employs machine learning algorithms to construct and correlate that data to give DevOps leaders more accurate insights into the status of a project, instead of requiring that data to be entered manually.

    In fact, Lines said meetings should be shorter, too, because rather than the need to provide a status update, it will become apparent to everyone what the real status of a project is before a meeting even starts. That means more time can be allocated to determining how best to optimize limited application development resources, Lines said.

    In the wake of the COVID-19 pandemic, organizations have more application development initiatives underway than ever. Many of these projects are core to digital business transformation initiatives which a core group of developers are working on simultaneously. Being able to dynamically reallocate resources to a faster-moving project from one that is stalled is increasingly critical. The challenge has been that the more projects there are, the harder it becomes to collect data that accurately reflects their true status at any given time. The goal should be to eliminate the need to reenter data that, in one form or another, already exists in another tool.

  • ZeroNorth Adds Analytics App to Advance DevSecOps

    ZeroNorth Adds Analytics App to Advance DevSecOps

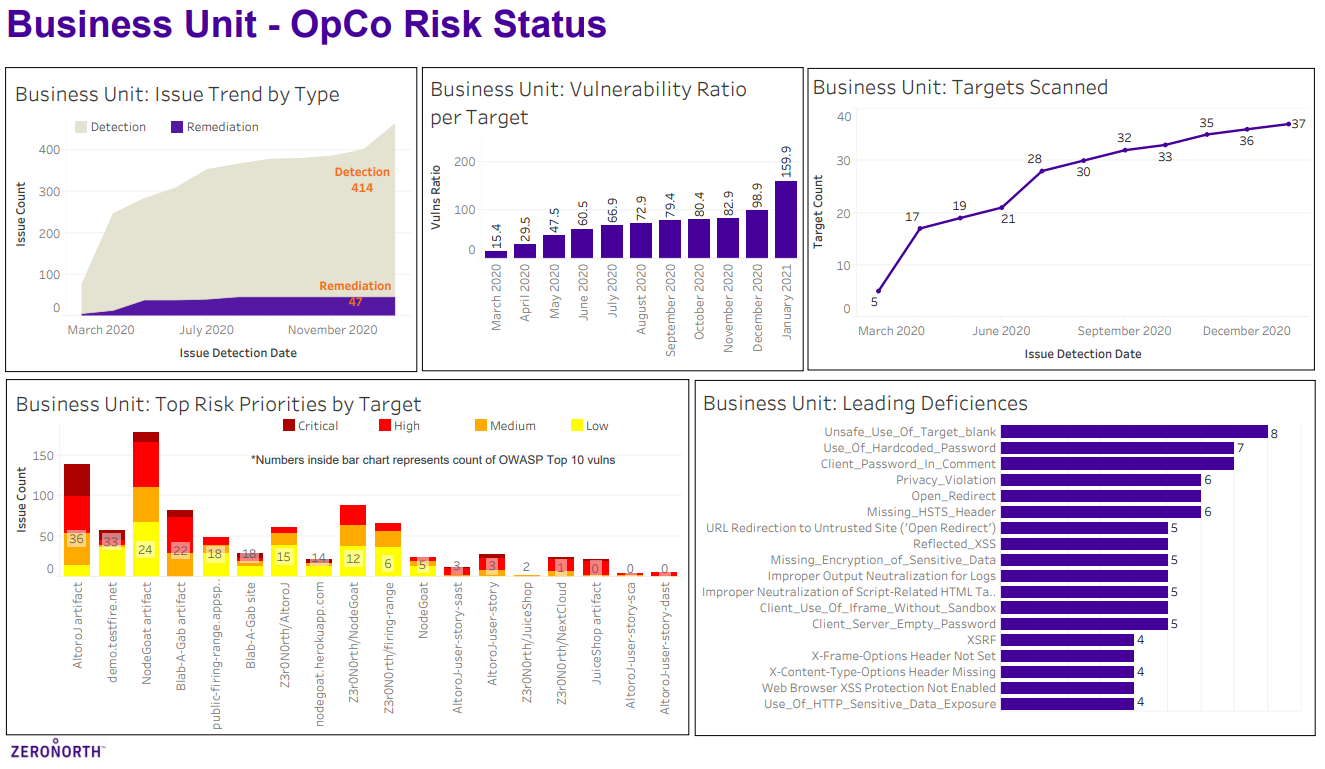
    ZeroNorth today added an Advanced AppSec Risk Analytics module to its platform for orchestrating DevSecOps processes.

    John Worrall, ZeroNorth CEO, said the analytics tool pulls vulnerability data generated by a variety of security tools to provide both DevOps and cybersecurity professionals with a single source of truth for assessing security within an application environment.

    The ZeroNorth platform is designed to enable IT organizations to orchestrate multiple vulnerability scanning tools within the context of a larger DevSecOps workflow, and can apply analytics to a large pool of security data. That data can be viewed in the context of specific groups, such as a business unit or specific application development and deployment team, or within the context of whichever application generates the most revenue for the business, Worral said.

    Additionally, the Advanced AppSec Risk Analytics module will surface types of vulnerabilities detected and the vulnerabilities most encountered, ranked by criticality, along with other trends in types and number of vulnerabilities detected/remediated, such as the number and criticality of vulnerability findings per specific scanner. It also tracks the applications and entities scanned, number of vulnerabilities detected per application/entity and the applications/entities that have the highest risk.

    ZeroNorth

    Armed with that analytics data, Worral said it becomes easier for IT teams to prioritize and focus their efforts, in addition to identifying areas of the business that may need additional cybersecurity resources and training. IT leaders can also get a snapshot view of the top application security risks to better assess the organization’s overall security posture, Worral noted.

    The Advanced AppSec Risk Analytics module will also surface vulnerability remediation bottlenecks spanning multiple applications within the context of a software development life cycle (SDLC), Worral added. Longer term, Worral said the data collected by the ZeroNorth analytics application will also create an opportunity for the company to apply machine learning algorithms to DevSecOps.

    In general, Worral said the only viable path toward achieving DevSecOps is to foster more collaboration between developers and cybersecurity teams. Getting those teams on the same page in terms of the security data that needs to be analyzed is a crucial first step, Worral said.

    It’s still early on in the adoption of DevSecOps best practices within organizations, however, it’s apparent a lack of cohesion between software developers and cybersecurity teams about which vulnerabilities to prioritize is a major source of dysfunction. Cybersecurity teams tend to create long lists of vulnerabilities discovered within applications without providing much context. Developers are then left to weigh, on their own, when to address a vulnerability versus focusing on writing additional code needed to make an application delivery deadline. Developers take potential vulnerabilities seriously, but there are only so many hours in a day to write code.

    Unfairly or not, developers are being held more accountable for application security. The challenge – and the opportunity – is to find a way to make the entire DevSecOps workflow a whole lot less contentious by helping DevOps and DevSecOps teams more aware of which tasks should be prioritized when.

  • Dynatrace Extends Reach of Observability Platform

    Dynatrace Extends Reach of Observability Platform

    Dynatrace this week updated its observability and software intelligence platform as part of an effort to expand its reach across modern enterprise IT environments.

    Announced at the online Dynatrace Perform 2021 conference, the company’s namesake platform can now capture logs from Kubernetes and Red Hat OpenShift as well as Amazon Web Services, Google Cloud Platform and Microsoft Azure cloud platforms.

    In addition, Dynatrace is adding support for open source log data frameworks such as Fluentd and Logstash. Those logs can now be centrally viewed via a Dynatrace Log Viewer that enables IT teams to search, analyze and segment both real-time and historical log data.

    Dynatrace also added a Cloud Automation Module based on Keptn, an open source tool for automating configuration of observability tools, orchestrating code tests and quality checks. Keptn was created by Dynatrace and is being advanced under the auspices of the Cloud Native Computing Foundation (CNCF).

    The company also launched a Software Intelligence Hub to make it easier to access more than 500 pre-configured integrations, as well as access tools for creating integrations without having to write code.

    Dynatrace also announced it has extended a previously launched Application Security Module to now include support for Node.js applications. In addition, the module includes the ability to enforce security policies against applications instrumented with its agent software, and offers extended capabilities to enable the detection of Kubernetes cluster vulnerabilities, as well.

    Finally, Dynatrace has added a Session Replay capability to its Digital Experience Module to enable IT teams to capture a mobile application experience.

    Steve Tack, senior vice president of product management at Dynatrace, said the company is moving quickly to add support for platforms and technologies widely employed within cloud-native applications to provide IT teams with a single platform through which they can manage monolithic and microservices-based applications.

    With the rise of microservices, IT environments are becoming too complex to manage without some type of observability platform. Historically, cost concerns limited IT teams to employing application performance management (APM) platforms, such as Dynatrace, only for their most mission-critical, monolithic applications. It’s now become apparent that observability platforms capable of correlating log and telemetry data captured from applications and infrastructure are required to effectively manage a modern IT environment.

    As part of that effort, Dynatrace is now collecting data from additional sources alongside the agent software it provides. That data is then fed into an observability platform, that Dynatrace has augmented with a Davis AI engine, to identify anomalies and other potential issues by employing machine learning algorithms.

    It’s not clear to what degree IT teams completely trust the recommendations surfaced by any AI engine. However, as platforms such as Dynatrace collect more data from an IT environment, the more accurate AI models tend to become. In fact,  IT teams that don’t have access to AI capabilities might soon be at a distinct disadvantage, compared to other IT teams that do.

    In the meantime, the battle for observability supremacy continues to intensify, as incumbent providers of APM platforms such as Dynatrace look to forestall a host of startup rivals, all promising greater visibility into IT environments at a lower cost. The challenge now is determining what level of visibility is achieved, and at what total cost.

  • New Relic Adds Visualization Tool to Observability Platform

    New Relic Adds Visualization Tool to Observability Platform

    New Relic announced today it has added a visualization tool, dubbed New Relic Explorer, to make it simpler for IT professionals to discover the root cause of issues that adversely affect application performance.

    Buddy Brewer, global vice president and field CTO for the Americas, New Relic, said the goal is to make it simpler for IT professionals to navigate and, ultimately, act on, all the metrics collected by the New Relic One observability platform.

    New Relic Explorer includes a New Relic Lookout capability that enables IT teams to drill down into telemetry data gathered from New Relic One, as well as other third-party sources, and a New Relic Navigator capability for determining the health of relationships between services, said Brewer. These capabilities make it possible to more easily identify correlations, abnormal history and traces that would be, for example, indicative of blind spots or unknown relationships between IT services, Brewer said.

    Just as importantly, IT professionals can more easily discover recent changes to an IT environment, which are most likely the cause of any new issue that is adversely affecting the IT environment, Brewer added.

    New Relic Explorer requires no configuration, and will be included as part of the existing New Relic Full-Stack Observability offering to give IT teams a single unified view of their IT environments, said Brewer.

    As IT environments become more complex, the amount of time spent looking for the root cause of an issue that might only take a few minutes to fix has substantially increased. As a result, organizations are allocating a significant amount of time to convene “war rooms” to identify the source of problems; those problems can now be more readily identified using New Relic Explorer.

    In general, Brewer said, New Relic remains committed to opening up the platform to external telemetry sources, including data collected using open source tools, such as Prometheus and OpenTelemetry agent software, both advanced under the auspices of the Cloud Native Computing Foundation (CNCF).

    New Relic, like providers of similar tools, has recently begun repositioning itself as a provider of an observability platform, rather than of application performance management (APM) tools, that provides insights into both applications and the infrastructure on which they depend. That approach promises to provide IT teams with more context any time an issue arises. As part of that shift, New Relic is making it clear that while it views its agent source as a richer source of telemetry data, its platform can consume relevant data wherever it can be found. New Relic will also remind customers that its agent software, and the other data collection tools it provides, are simpler to install and update.

    The tradeoff, of course, is cost. While open source software itself is free, the total cost of implementing and managing that open source software can be substantial. Regardless of approach, however, the days when IT teams only applied application monitoring tools to their most mission-critical applications because of cost concerns are coming to an end. It has become impossible to manage a modern IT environment made up of both monolithic and microservices-based applications without such capabilities.

  • How the SRE Role Is Evolving

    How the SRE Role Is Evolving

    In recent years, site reliability engineering (SRE) has garnered much interest. In 2019, LinkedIn listed site reliability engineer as the second most promising job in the United States. Now, in 2021, the role continues to grow and evolve within many organizations.

    Initially spearheaded at Google and credited to engineer Ben Treynor, the strategy seeks smarter accountability for application reliability. An SRE team sets service level indicators, makes error budgets for new features and uses tools like application performance monitoring (APM) to visualize performance insights, among other tasks. SREs are quickly becoming a key check to increase business output in response to new digital innovations.

    I recently met with AppDynamics Regional CTO Gregg Ostrowski to discuss the emergence of SRE and how the approach is evolving. In short, it appears SREs will only continue to grow in importance across more companies, adopting new tactics like chaos engineering, and diversifying their teams with new domain knowledge in response to increasing technological complexity.

    What is an SRE?

    Traditionally, organizations employed system administrators, or sysadmins, to maintain operations for large computing systems and services. However, this typically produced a dichotomy: product developers want to push new features, while operations teams (sysadmins) want to make sure the existing service doesn’t break. The split between developers and operations can be unhealthy and cause friction.

    Whereas sysadmin positions are detached from development and involve a lot of manual work, an SRE approach, on the other hand, takes a more engineering-focused approach to automate operations. Google’s SRE book, which has become a bible of sorts, defines the role as “What happens when you ask a software engineer to design an operations team.”

    So, what does an SRE do? Well, at Google, they are in charge of availability, latency, performance, efficiency, change management, monitoring, emergency response and capacity planning for the services they operate. At Google, they spend no more than 50% of their time on traditional “ops,” like tickets, on-call and manual tasks, and are encouraged to use the remaining 50% of their time to develop automation that will replace human operations labor.

    5 Ways the SRE Approach is Evolving

    It’s been a few years since Google introduced the SRE concept, and naturally, unique iterations have popped up within other enterprises. But, on the whole, where is the concept heading? Ostrowski sees SREs evolving in a few key areas: growth and maturity, increased diversification with domain-specific experts and new monitoring tactics.

    1. Increased Adoption

    First, not all companies have embraced an SRE model. A recent study by Blameless found “… 50% of respondents employ an SRE model with dedicated engineers focused on infrastructure and tooling, or an embedded model where full-time SREs are assigned to a service.”

    The SRE model is gaining momentum, but there is still room for greater adoption. There is also room for internal growth. Ostrowski sees a single SRE team as a single point of failure. “It needs to be a whole department,” he said.

    In addition, SREs are gaining a more prominent voice at the table, influencing feature rollout. “With proper and mature SRE involvement, teams can’t willy-nilly deploy,” he said. Ostrowski views these teams as maintaining a critical balance between business risk and introducing new technology.

    2. Larger, Diversified SRE Departments

    Many companies are experiencing rising user demands, and thus must rapidly scale their application networks. Simultaneously, there has been a Cambrian explosion of deployment types — systems could be using any assortment of legacy infrastructure, mainframe, microservices, cloud environments and multiple cloud vendors. “The complexity and topology of the IT space has grown substantially, with many interdependencies,” Ostrowski said.

    Due to increasingly complex technical stacks, SRE must now cover many domains. Thus, SRE departments will likely require a more diversified team of domain experts. Ostrowski likens SREs to “Navy SEALs of the IT team.” For example, assigning them with experience navigating the nuances behind Google Cloud Platform (GCP) or Microsoft Azure could maintain service reliability in respective clouds.

    Individuals’ personality matters for suitability to SRE, too, said Ostrowski. The role requires a specific type of innovator who considers the repercussions of code, and loves improving processes and performances.

    3. New Testing Tactics Will Emerge

    Ostrowski also foresees SRE departments introducing new monitoring and testing approaches to maintain reliability. One of these is chaos engineering, which champions the idea of intentionally breaking application systems. Different strategies will undoubtedly emerge to help drive user experience (UX) and ensure that performance is always top of mind.

    4. Businesses Rely on SREs to Mitigate Risk

    All things will inevitably fail, at some point. SREs accept failure and learn to manage it, designing repeatable operational mitigation structures. “As companies become reliant on the consumerization of IT, business is dependent on SREs to drive business,” said Ostrowski. This reliance will likely increase as businesses tap SREs to maintain stability.

    Whether it’s reducing mean time to repair (MTTR), programming service level indicators to monitor website load time, or forecasting error budgets for new feature introductions, SREs will be increasingly relied upon to maintain business stability and high performance.

    “The SRE mindset is about coming to terms with a blameless environment,” said Ostrowski. They can help “balance a risk between the business and application team,” described Ostrowski.

    5. SREs Steer UX

    In this digital-only environment, “The application has become the business,” described Ostrowski. If the application is core to the business, monitoring the user journey is necessary to improve it. Ostrowski believes SREs oversee a unique territory that could produce valuable business insights too.

    In addition to monitoring uptime to ensure URL response times meet SLAs, SREs could track UX-related insights, such as conversion rates or cart abandonment percentages. Tracking such analytics and setting standards baselines could help pinpoint problems affecting UX. It could also assist product development in designing better-performing software.

    Final Thoughts

    “Anything that you do more than twice has to be automated.”
    -Adam Stone, CEO, D-Tools

    Traditional operations teams are typically detached from product development and are culturally very different. However, within an SRE approach, operations instead aim to run systems that automate work typically performed manually by sysadmins.

    In this brief introduction, we barely scratched the surface of the topic. And of course, each company is unique in its approach to hybridizing product development and operations. DevOps tenants are closely aligned with SRE — often they are intermixed or one and the same.

    Ultimately, truly reaping business value from this approach will depend on breaking down silos and opening conversations — or at least automated notifications — between disparate units. Only then can operations and development coexist in the most productive way.

  • CNCF Graduates Open Policy Agent Project to Manage Compliance as Code

    CNCF Graduates Open Policy Agent Project to Manage Compliance as Code

    The Cloud Native Computing Foundation (CNCF) announced this week that the Open Policy Agent (OPA) project, which many IT teams are employing to manage compliance as code, has officially graduated.

    Torin Sandall, co-founder of the OPA project and vice president of open source at Styra, whose compliance management platform is based on OPA, said formal recognition of OPA alongside other CNCF projects, such as Kubernetes, should help further adoption of the open source project that first took shape in 2016.

    Now being advanced under the auspices of the CNCF, the open source agent created by the OPA project is increasingly being incorporated into a wider range of compliance and security platforms. At the same time, more developers are starting to manage compliance as code across a wider range of applications. The ultimate goal is to make it easier to meet compliance requirements using a declarative framework so that responsibility for implementing compliance policies shifts further left toward developers.

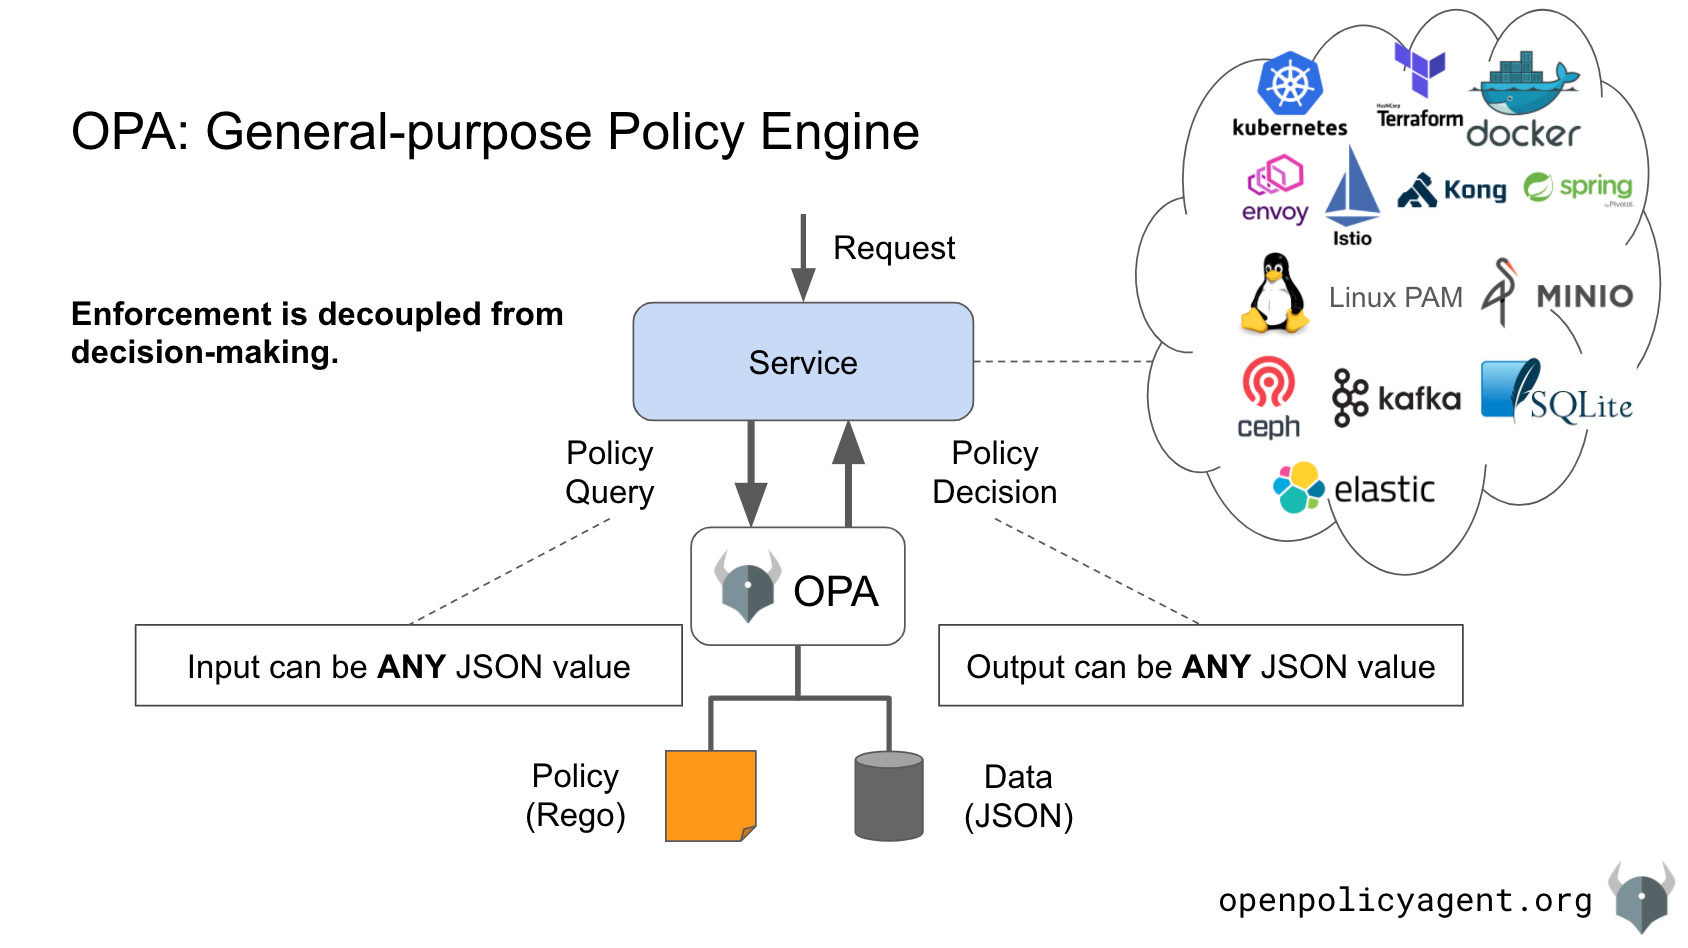
    OPA uses a general purpose engine for enforcing policies that uses a set of rules that developers embed within applications using the Rego language. OPA has gained traction among cloud native application developers because it provides a means to enforce policies across a wide range of microservices.

    Sandall said going forward, the primary focus of the OPA project should be to develop and share as many integrations as possible. There are many instances where a use case for OPA has been created, but development teams simply don’t know that use case exists. As a result, many IT teams are attempting to employ compliance as code to address an issue that others have already solved, Sandall said.

    During its time as an incubation project managed by the CNCF, the security special interest group (SIG) within the CNCF conducted two external OPA security audits. The OPA project has also defined a security vulnerability disclosure process and a security response team.

    It’s not clear whether chief compliance officers within enterprise IT organizations have developed an appreciation for OPA. In theory, many compliance issues could be avoided if organizations mandated using OPA – or another approach to managing compliance as code – within their applications. Those compliance issues, of course, are multiplying as the number of compliance mandates expand globally. The challenge is that most compliance teams don’t have much visibility into the application development process.

    In the meantime, as DevSecOps processes continue to mature, it seems almost inevitable they would expand to include compliance mandates, most of which only exist to ensure some base level of security is present. Of course, developers may not want to be responsible for compliance mandates. However, the sooner compliance issues are addressed in the development process, the less likely they are to become DevOps’ problem when deployed in a production environment.

  • Lightstep Delivers Next Generation Observability Platform

    Lightstep Delivers Next Generation Observability Platform

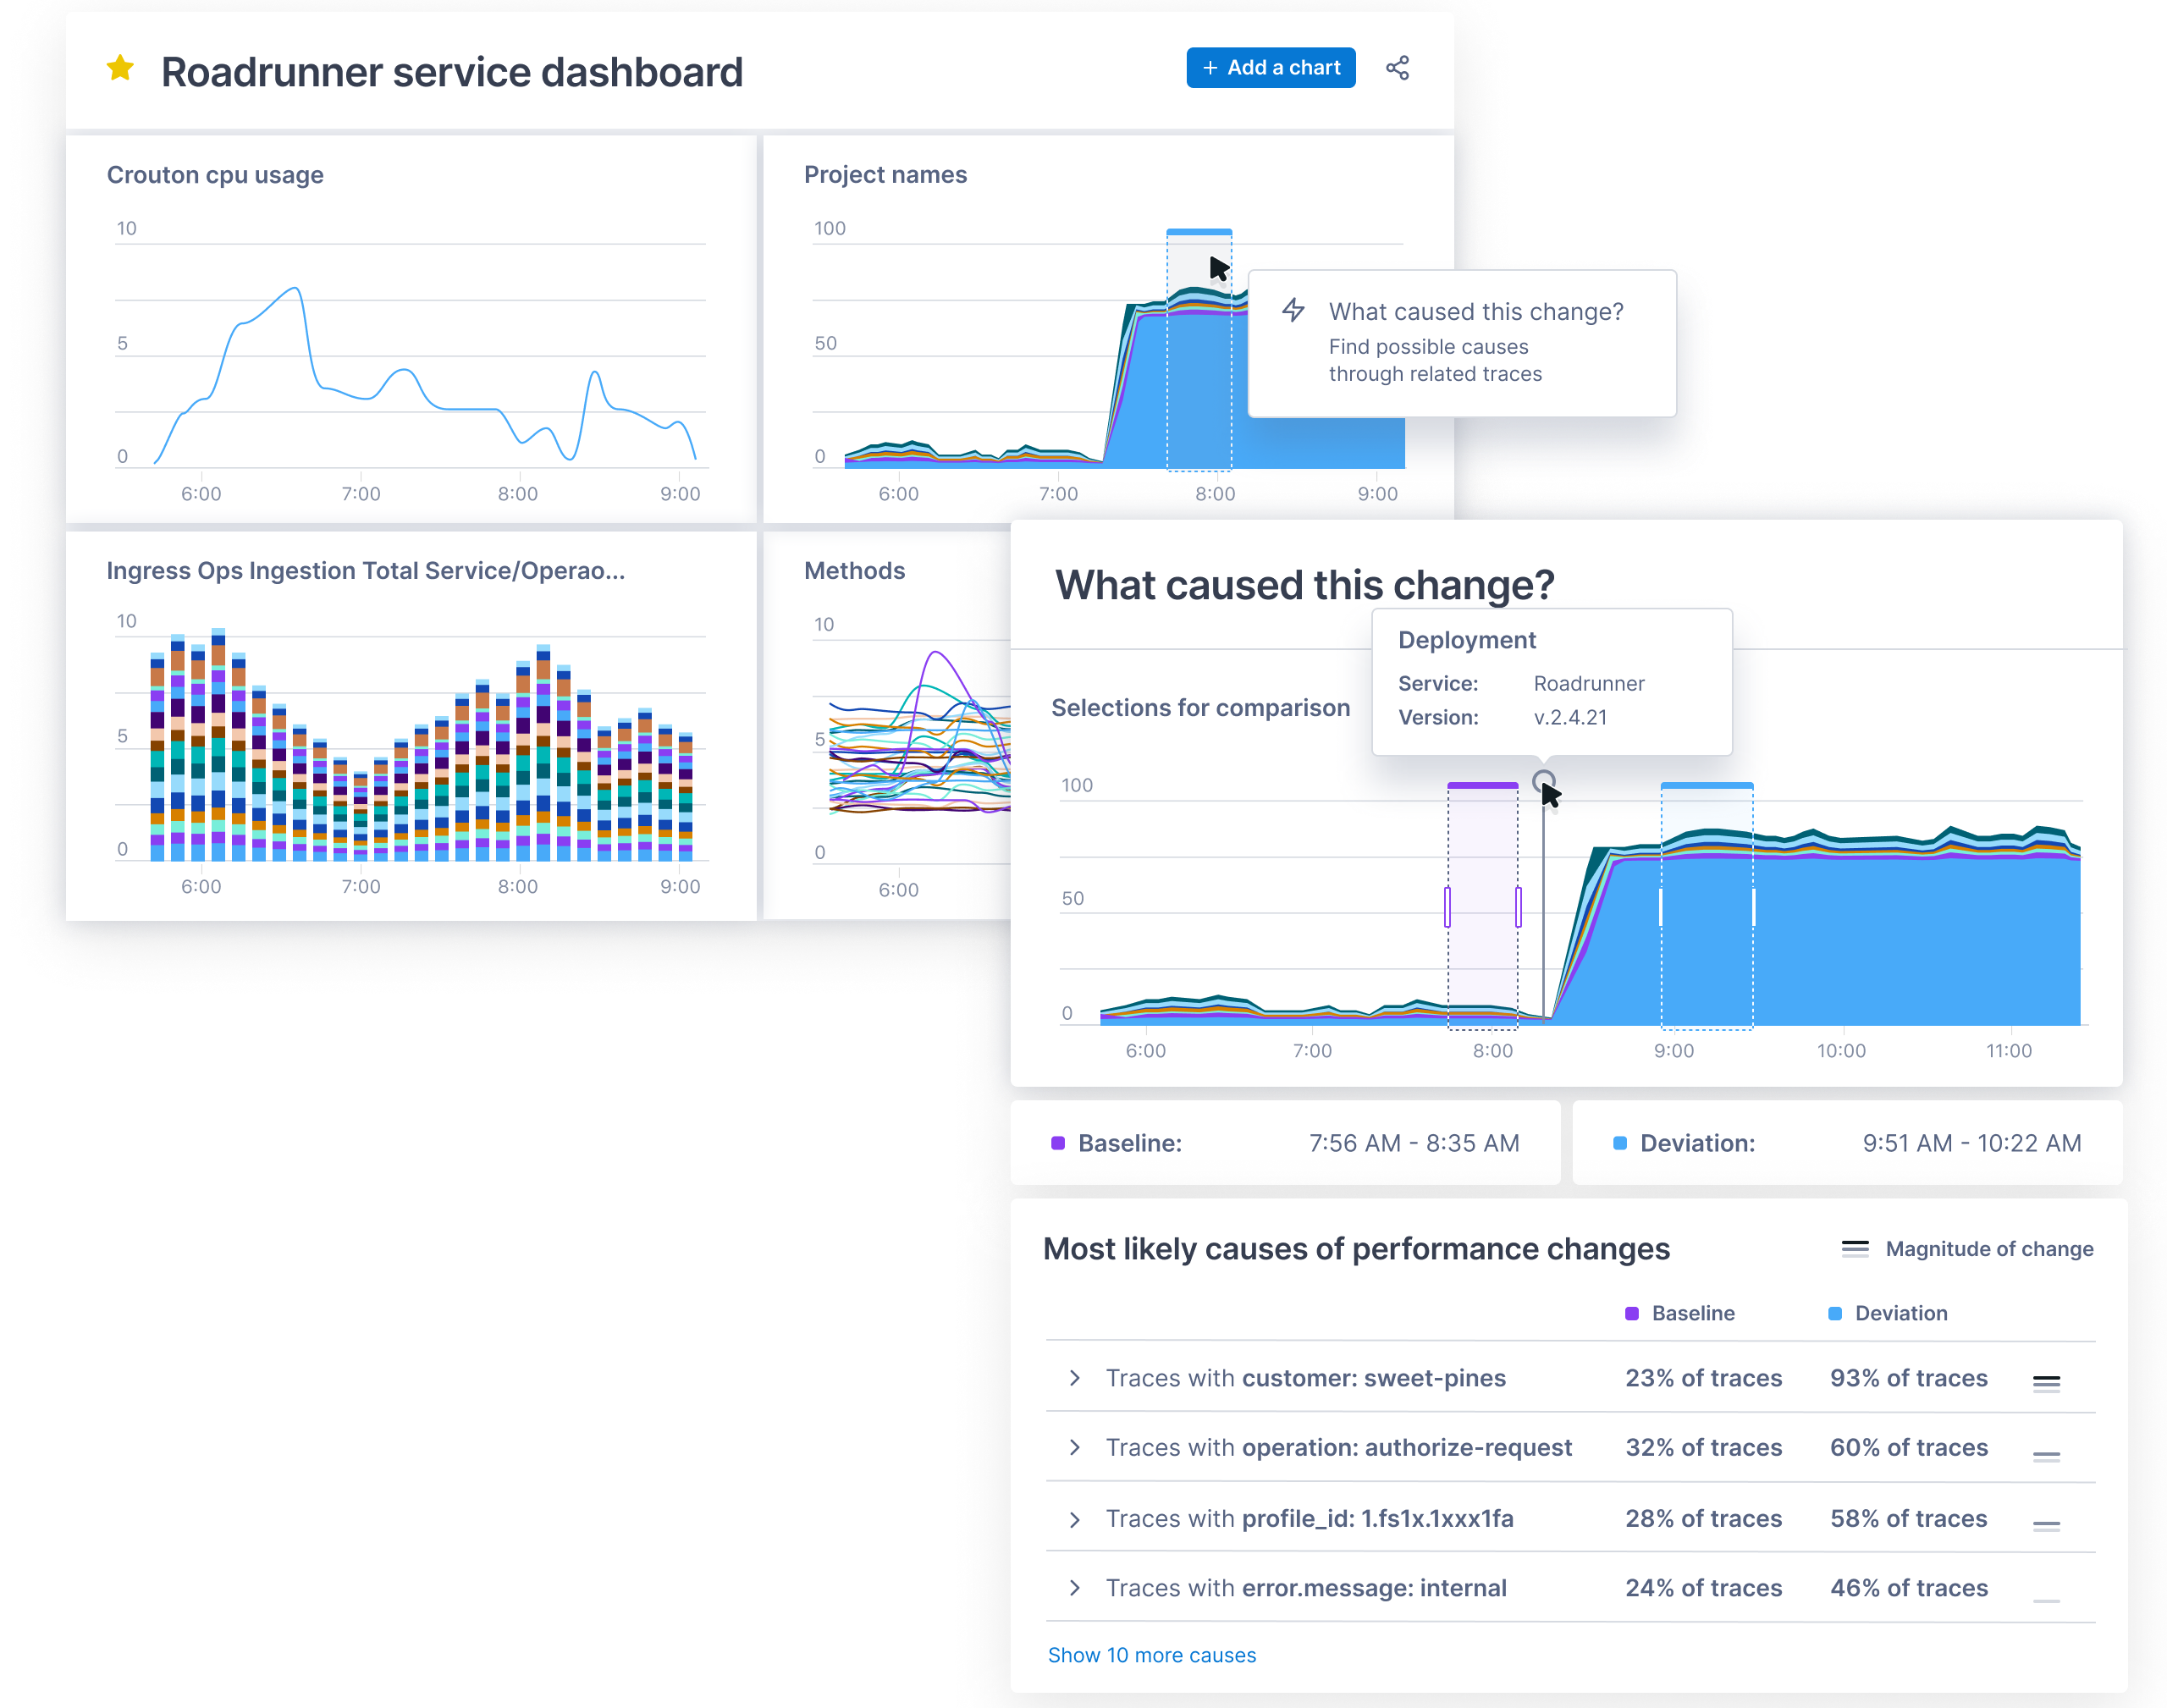
    Lightstep this week announced general availability of a Change Intelligence observability platform based on a time-series database that is capable of processing a trillion events each day.

    Ben Sigelman, Lightstep’s CEO, said as IT environments become more complex, thanks to the rise of microservices and cloud-native computing platforms, existing monitoring and observability tools will not be able to keep pace with the rate of change in what have become highly dynamic IT environments.

    While AIOps promises to address that complexity by employing machine learning algorithms to analyze IT environments and surface recommendations, Sigelman said there will always be the need for observability platforms that enable IT teams to discover the root cause of an issue in a way that surfaces the insights needed to fix the problem in real-time.

    The Lightstep database was built by the same team that created Monarch, the globally-distributed in-memory time series database system that Google employs to monitor its applications and systems. Lightstep’s database makes it possible to collect metrics, in the form of distributed traces, at a level of scale that allows IT teams to analyze events across a distributed IT environment made up of both monolithic and microservices-based applications, said Sigelman.

    Lightstep is the latest entrant in an already crowded field of observability platforms, all seeking to consolidate the wide range of monitoring tools IT teams have used for decades.

    The challenge IT teams face is that each of those monitoring tools is focused on a narrow range of platforms. IT teams often lack context when an issue arises, and wind up trying to correlate reports from multiple monitoring tools in the hopes of discovering the root cause of an issue. Observability platform providers are making the case for a single platform that correlates application and infrastructure events in a way that makes it easier for IT to fix issues faster.

    Observability, of course, has been a core tenet of DevOps for years. The tools for achieving that goal, however, have been cumbersome to implement and maintain using legacy application performance management (APM) platforms. Most of those platform providers, have rolled out what are positioned as next-generation observability platforms. Now, IT organizations will need to decide if they want to maintain investments in existing platforms versus moving to one of the raft of upstarts looking to dethrone APM incumbents.

    The startups are counting on a massive expansion in demand for observability platforms. IT organizations have tended to limit their usage of APM platforms to mission-critical applications due to cost and the challenges associated with maintaining the agent software needed to collect metrics from each application. Modern observability platforms have automated much of the metrics collection process, while open source software promises to make metrics collection more affordable..

    The challenge, of course, is that many organizations are already struggling to manage complex IT environments, and can’t necessarily wait for that open source software to mature.

  • AppDynamics Partners With Cisco to Secure Application Runtimes

    AppDynamics Partners With Cisco to Secure Application Runtimes

    AppDynamics today announced its agent software, which it provides as part of its observability platform, now has the ability to enforce application security policies.

    Developed in collaboration with the security business unit of parent company Cisco, the Cisco Secure Application offering, available from AppDynamics, can detect attacks, identify deviations in application behavior and block attacks automatically.

    Gregg Ostrowski, a regional CTO for AppDynamics, said the goal is to make it simpler for IT teams that employ AppDynamics for monitoring and observing their IT environments to also embrace DevSecOps best practices. In effect, IT teams can now piggyback security for application runtimes on their existing investment in AppDynamics, Ostrowski said.

    The AppDynamics approach provides the added benefit of easy integration with the Cisco security tools to improve collaboration between DevOps and cybersecurity teams, Ostrowski said. Security details correlated with the application topology make it easier to share context in a way that identifies the actual business relevance of any security event, he added.

    As organizations accelerate digital business transformation initiatives, Ostrowski said the need to embrace DevSecOps best practices is becoming more urgent. The level of risk attached to these types of projects is significantly higher than with previous generations of applications, Ostrowski said.

    While most organizations appreciate the need for greater application security, there’s a debate about how best to achieve that goal. There’s general agreement that developers need to be more involved. However, shifting responsibility for application security to the proverbial left often comes at the expense of developer productivity. AppDynamics is making a case for enabling IT teams, that may already rely on its application performance management (APM) platform, to enforce policies defined by the cybersecurity team.

    Of course, there’s still a need to provide developers with the tools required to write more secure code in the first place. The debate is over how involved in the cybersecurity management process developers need to be after applications are deployed in a production environment.

    Arguably, the goal should be to enable both teams to accomplish their respective tasks in a way that doesn’t require a constant stream of meetings and updates. In the event a vulnerability is discovered, it’s critical for security teams to determine the threat level that vulnerability represents. Otherwise, remediation of that vulnerability will be just one more item in a long list of patches that developers are already working on.

    Regardless of approach, there are now myriad ways to improve overall application security. In effect, the same defense-in-depth approach that IT organizations have relied on to secure network perimeters can now be applied to application security as applications are both constructed and deployed. The most significant challenge is not so much finding the tools required to improve application security, as defining the processes through which best practices can be consistently applied.