Category: Application Performance Management/Monitoring

  • SolarWinds Extends APM Reach to Infrastructure

    SolarWinds Extends APM Reach to Infrastructure

    SolarWinds has updated its application performance management (APM) platform to provide more visibility into the IT infrastructure on which applications depend.

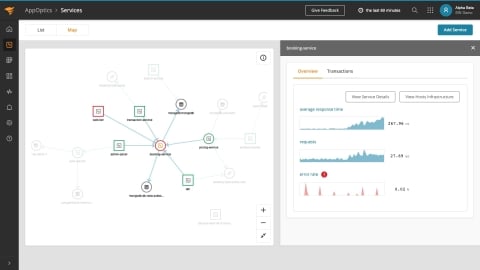
    Jim Hansen, vice president of products for application management at SolarWinds, said the AppOptics service map within SolarWinds APM Suite now enables DevOps teams to visualize dynamic relationships between services and their dependencies. IT teams can view metrics such as average latency, requests per minute, error rate and CPU usage as time series data within a service trace topology.

    DevOps teams can view which services and dependencies are causing resource constraints, surface unknown dependencies and misconfigurations in services and determine how business transactions are flowing across application services, said Hansen. The goal is to make it easier to conduct root cause analysis at a time when the dependencies between software and infrastructure have never been greater or complex.

    Hansen noted that in the wake of the economic downturn brought on by the COVID-19 pandemic there is a lot more interest in reducing the total cost of IT. In many cases, IT teams today are relying on separate tools to monitor applications and IT infrastructure, which often not only results in higher costs but also fails to provide enough context, he said.

    At the same time, responsibilities within IT teams are converging. According to a recent survey of 227 IT professionals in North America conducted by SolarWinds, 54% of respondents said they are spending more time managing applications and services than infrastructure and hardware. The survey also notes there are more IT teams than ever using log analytics (58%) and tracing (24%).

    SolarWinds has also added a web transaction recorder to its Pingdom monitoring tool to capture how an end user interacts with a web application without requiring developers to write and deploy scripts. The recorder captures each step made during a transaction and automatically translates the information into a script that can automatically play back, said Hansen.

    Finally. SolarWinds has enhanced its Loggly tool, adding the ability to automate indexing and parsing to deliver time to value faster, he said.

    Hansen said SolarWinds via its software-as-a-service (SaaS) platform, is trying to make APM simultaneously more affordable and accessible. The challenge is making it possible for IT teams to apply APM services more broadly even when consumption of those services scales up and down in ways that are not always predictable, noted Hansen.

    There are no shortages of options when it comes to APM platforms these days, and most are accessed via SaaS platforms. SolarWinds has been making the case for an APM service that costs substantially less than rivals while providing most of the functionality required by the average IT team. Many teams have limited their adoption of APM platforms to only their most mission-critical because of the cost involved. As APM services become more affordable, there should be a corresponding increase in reliance on APM services at a time when IT is becoming more complex to manage daily.

  • 5 Business Insights to Gain From APM

    5 Business Insights to Gain From APM

    My son is a commercial on-demand cargo pilot, and it’s his job to move around auto parts when they’re needed in the supply chain. During a recent auto strike, he ended up flying a few fenders to a factory for something around $20,000. The profit margin on those fenders was blown to bits, but it would have been far more expensive to interrupt the supply chain — auto assembly lines burn millions per hour.

    That kind of individual, transactional economics is insane, of course — no actual fender really costs so much. My point is inefficiencies occur when there’s a hiccup somewhere. They can happen at any point — including when the custom applications that work with suppliers aren’t functioning correctly. The result? The item isn’t ordered, or delivered, on time. And there’s a substantial financial impact downstream.

    That’s why slow is the new down. The stakes are high. Here’s five reasons why you need a comprehensive performance management strategy to track and measure all digital touchpoints in your business and mitigate the impact to both your business and the user.

    Timing Is Everything

    Not too long ago, business ran on an analog model. Customers went to the retailer or contacted them in some way and placed an order. It was the same in B2B interactions; parts were ordered and, once in stock, they were delivered.

    The old system worked fine, but compared with the way things are today, that analog model was inefficient. It required more warehousing. Delivery took more time. Overhead was higher. Nothing was “Just in time.” You could call it, “Just you wait.”

    Now we’re interconnected, often by custom apps and websites (custom, because each company is different, with different needs that can’t be fulfilled by some “one-size-fits-all” app or site). It works well when it’s working well. But when there’s even a blip, there’s disaster. 

    Our modern, digitally interconnected system is kept running smoothly by monitoring. Everything about the app and the site is monitored and measured, to a microscopic degree. How is the mobile app performing? How long did the customer stay on a page? How quickly did the B2B app answer a parts order? You can find that out — and fix the problem before it grows.

    This is called application performance monitoring (APM). The digital world is full of acronyms, but “APM” is a vital one to know because measurement is now table stakes for any digital business, whether it’s retail, financial or B2B.

    Customers Are Fast to Leave When You Are Slow

    For execs, it’s job number one to protect and increase market share. Salesforce said 52% of holiday shopping occurs on a mobile device. Last year, Google changed its algorithm to make site speed a ranking factor in mobile search. In short: Go slow, and you won’t get found. You won’t make the sale. You lose market share.

    If your customers do manage to find you: A recent study found 95% of consumers in the U.S. and U.K. will jump off an e-commerce or brand site if they’re having a frustrating time. Therefore, you need to know where and when they jump. You can find out with APM.

    If your customers are loyal, 60% will still leave you to find that product somewhere else. Customers will simply leave any digital touchpoint that doesn’t keep up. How fast is slow? Google said a mobile site should load within three seconds. Take longer than five seconds, and the probability of bounce increases by 90%.

    Customers are fast to leave when you are slow. APM gives you continuous visibility into how your application is performing and helps answer the lingering question, “Is my app good?”

    Faster Isn’t Necessarily Better

    When cloud first debuted, business leaders loved it. They were able to disconnect from messy interactions with on-premises equipment and the tech pros who maintained it. It was elastic, scalable and agile; they could expediently deploy more resources if something slowed down in the cloud.

    At least that was the plan, but the trouble is it didn’t automatically guarantee a better customer experience. It also didn’t make those auto parts arrive on time. Don’t get me wrong, Cargo Dogs love it when you urgently need them to deliver parts. But flying fenders around at the last minute is not a sign things are going well at the part vendor or at the plant.

    You still need proactive visibility. With continuous monitoring, you can understand the performance of the application and the infrastructure it runs on.

    You can stop reacting and start delivering. APM tells you where you’re getting value and where you aren’t. It knows when you’re spending too much on a feature and not getting much ROI. The secret isn’t spending more money than the other guys. It’s spending it more wisely than they do.

    I’m not going to claim APM is a digital shaman. But it does give you a perspective of the cost of running your applications and the performance of running those applications — and it does this proactively.

    An example: Earlier in my career, I worked with a business leader who had the application business for a large financial services company. This leader was tasked with ensuring digital interactions were operating in a high-performance fashion. Before he implemented APM tools, he ran with the most expensive systems and infrastructure — both on-premises and in the cloud — on the presumption that massively over-provisioning infrastructure was the safe thing to do.

    But users complained his pricey infrastructure was slow or unavailable. His IT staff would look at all their technology metrics — not in the context of application performance, just pure technology metrics — and say nothing was wrong; the infrastructure itself was performing flawlessly. Finally, he brought in APM and instrumented it on a key application and immediately got proactive visibility. He was able to fix the problems with his applications — without buying still more infrastructure.

    The Importance of Visibility

    Visibility means fewer problems that lead to slowness or outages. But if you do have interruptions, end-to-end visibility shows you the linkage between the application and the infrastructure. Your technology teams can rapidly do root-cause analysis and fix the problem much faster because they’re no longer guessing at where the issues might be.

    It means IT isn’t wasting time pointing fingers. It is working off a consistent and standard set of information. Additionally, for traditional IT organizations, APM gives next-level visibility into infrastructure, whether it’s on-premises, cloud, hybrid, etc. It gives stakeholders a view into the metrics that matter.

    The Right Metrics — Even During App Development 

    There are many reasons why applications can’t perform well. They could have other applications contending for resources. And here’s something else: that custom application could be poorly written.

    APM is a great help in the development stage of applications because it allows people writing the applications to understand how their application code is performing immediately. That way, they can optimize their code before it goes live.

    That app can be written in any number of languages, and it might be public cloud, hybrid cloud, or private, on-premises. APM instruments these apps and allows you to see right down to the line of code how those apps are performing. The likelihood of deploying poorly performing code into production thus minimized greatly.

    Conclusion

    APM allows companies to roll out better performing applications more quickly with a high degree of assurance that they’re not going to be slow in production. Without APM, you have an unknown level of risk associated with availability and performance of your applications, their transactions and your infrastructure. If you’re not monitoring it and measuring it, you can’t manage it in a low-risk fashion — which is ultimately why APM matters and should be adopted as broadly as possible across your application and infrastructure environment.

  • The Top 5 Challenges to Overcome with Heroku Logging

    The Top 5 Challenges to Overcome with Heroku Logging

    Heroku can be a very powerful tool for monitoring the massive amount of data generated by your applications, systems, APIs and add-ons.

    One thing you may have discovered with Heroku logging is that making sense of data within your log files can be time-consuming. When you’re running large numbers of applications which process tons of data each day, the sheer volume of data that appears in the logs can seem overwhelming.

    Managing Massive Log Output 

    Due to the sheer amount of data that is gathered, it’s important to find ways of making the process a little bit easier, limit information to what is useful and organize what you have into digestible pieces.

    Parsing with Drains

    Using Logplex and log drains can help you filter out large chunks of your logs. Syslog drains will help you move any system messages to another server for archiving purposes.  HTTPS drains can help you better take control of your system messaging for sending it to third-party apps for analysis. 

    By assigning clear indicators that identify the application, system or API that creates a log, these can be streamed into channels that can be better understood in relation to their given purposes. 

    Log Retention Period

    While we may think that more information is always good, there is a limit to the amount that we can process. Some log data becomes meaningless or redundant after a certain length of time. It is wise to set realistic log retention periods on data based on business needs.

    Limit Verbosity

    Don’t log everything. Turning on debugging is appropriate during development and if there is a specific problem that needs investigating, but in most cases, these shouldn’t be stored. 

    Complexity in Stream Patterns

    The challenge with large amounts of data is that there may be subtle differences between successful activity and erratic behavior. The details may be small, and essentially invisible to the naked eye unless examined carefully. 

    Use Regex for Identifying Patterns

    Through the use of log analytics tools, you can set these to pick up specified regex patterns to subtle changes or variations in your logs that can provide meaningful insights. 

    Different Log Data Needs

    You may have people with different needs who wish to make use of the information you gain in your Heroku logs. While you have data that is of interest to developers and QA engineers, there are other tech-savvy users who may wish to gain business intelligence (BI) from the massive output of data, to be able to identify key performance indicators (KPI).

    Analytics Tools

    Using intelligent add-on analytics applications can help by filtering and sorting information into usable chunks that can be understood by users in different roles. By accurately filtering, you can provide intelligent real-time alerts for a specific application or system behavior to those who may wish to make use of it. 

    Application Issue Forecasting

    One of the best potential uses of your detailed Heroku logs involves the opportunities to spot patterns of problems that have occurred in the past and use them to predict problems that may occur in the future.

    As an expert, you may be able to spot patterns in your logs, however, even the smartest and most attentive engineers will not be able to manually define every scenario worth detecting.

    Occasionally patterns will occur that are only detectable through the rote process of comparing and contrasting working behavior with non-working behavior. Often, the subtleties are too small for a human to be able to notice the difference.

    Machine Learning Assistance

    Naturally, utilizing ML-powered techniques can help catch the unknowns. By investing in ML, using some of the better libraries or choosing a Heroku logging add-on with these capabilities, you can monitor your applications and infrastructure with less effort. 

    Securing Sensitive Data

    With the rapid pace of CI/CD, a large amount of activity regularly flows through your pipelines from development into production. Throughout this process, it’s possible for sensitive data to start appearing in logs. While your teams may be diligent about keeping control over OAuth credentials, security keys, authentication tokens and more, nobody is perfect. Sensitive security credentials can accidentally make their way onto production servers. Sensitive customer data can also accidentally find its way into public logs if mistakes are made.

    Credential Detection and Security Alerts

    Logs can serve as a saving point for the identification of sensitive information. Using a parsing engine, these can be immediately redacted for compliant log management. By monitoring your log files for any patterns which could include secret keys or other potential security breaches, you’ll be able to continue ingesting critical log data without increasing business risk.

    Heroku Private Spaces

    With Heroku Enterprise, you can make use of Heroku Private Spaces which are an isolated network of private apps and data services, which will help you keep sensitive data separate from public interference. If you are handling a large amount of sensitive customer data, ensuring that any information gets filtered into these places will help you remain compliant with GDPR and other privacy-related regulations.   

    Conclusion

    Heroku can be a fantastic solution for monitoring the activity which goes on in your cloud clusters.  However, unless you have solid analytical tools in place, you may find yourself spending a lot of time wondering how to make use of this sea of data that has been collected. Consider using an add-on as an analytic layer to help spot patterns, organize data better and create smart alerts to make sure your operations continue to run smoothly.

  • 5 Reasons Why Your App Needs an Error Monitoring System

    5 Reasons Why Your App Needs an Error Monitoring System

    All software applications have errors. Bugs are simply part of software development. That’s why engineering organizations need to know exactly what errors are occurring so decisions can be made around which bugs to fix.

    The fastest way to identify and fix application errors is to implement error monitoring software. However, not all solutions are created equal, and the best error monitoring systems do more than error alerting. They provide insights into the stability of the software, give developers metrics for addressing technical debt and enable better decision making around building features versus fixing bugs.

    The result? Happier developers who build better apps that match customer expectations.

    Here are five specific reasons why engineering organizations should adopt an error monitoring system.

    Error Monitoring Improves Application Health

    At its core, an error monitoring system addresses the challenge to find, fix and prioritize software bugs. However, what makes an error monitoring solution stand out is stability scores, which make it easier to maintain a healthy app.

    • Calculated with real-time error rates and session data, stability scores reflect the percentage of successful user interactions per release. 
    • They tell the real story about the impact of errors and technical debt and provide a single, unifying metric that speaks directly to the overall application health.
    • Stability scores can be used across teams to set stability targets (critical stability and target stability), which in turn can determine whether the app is healthy enough for building new features, or if it’s time to fix bugs.

    An Error Monitoring Solution Increases Team Productivity

    With a lack of detailed information about the source and factors contributing to a bug or crash, developers must conduct research to pinpoint errors, which is a time-intensive process.

    Without Error Monitoring With Error Monitoring
    Sixty percent of developer time wasted investigating and fixing errors, often in code they didn’t write. Forty percent increase in developer productivity with the exact location and source of the error provided by error monitoring solution.

    From detection to resolution, error monitoring with stability scores determines whether debugging needs to be part of the workload and which errors should be addressed first. In addition, the best error monitoring tools help prioritize business-critical and revenue-impacting errors to ensure alignment from top to bottom within an organization.

    Understanding Your Application Errors Can Reduce Costs and Increase Revenue

    With an error monitoring service that catches errors quickly, engineers save time, avoid critical errors and deliver crash-free applications that users want to spend money on. New features can also be rolled out on time with fewer errors, which makes developers and users happy. 

    • On average, companies lose $1,500 per engineer each month over debugging.
    • Knight Capital Group lost $440 million in a mere 30 minutes due to a software bug.

    Technical issues are the number one reason apps get deleted. Thankfully, companies that deliver smooth app experiences benefit from loyal users who trust and spend money on their brand.

    Error Monitoring Retains Development Talent and Boosts Morale

    Technical debt is hard on engineers, both from a productivity and emotional perspective. Without a common language to explain its impact to other teams, developers often become frustrated at bearing the burden of technical debt, which can cause disengagement and encourage developers to leave.

    Error monitoring management and stability scores bring complete visibility and cross-team agreement around software stability and prioritization of errors. Stability scores provide:

    • A common vernacular for discussion between engineering, product, QA and release teams about when it’s time to fix bugs versus build new features.
    • A metrics-driven reflection of the impact of technical debt on the product and clear demonstration about when it’s time to address it.
    • A singular goal for application stability, which turns development and product teams into allies and increases morale across the organization.

    Error Handling Impacts User Satisfaction and Usage, and Safeguards App Store Ratings

    Apps play an important role in our personal and professional lives. Widespread app adoption and daily usage point to why application errors are becoming unacceptable to users, who aren’t shy about speaking up when errors do occur. 

    • Ninety- six percent of mobile app users write bad reviews for sub-par apps.
    • Forty-two percent of 0-star app ratings in the Google Play Store mention app stability and bugs.

    The best way to ensure users have a positive customer experience is to use error monitoring to catch errors in real-time so you can respond immediately. Error monitoring provides a hope for avoiding poor app store ratings and for keeping customers satisfied.

  • Micro Focus Updates LoadRunner Testing Tools

    Micro Focus Updates LoadRunner Testing Tools

    Micro Focus has revamped its venerable line of LoadRunner testing tools as part of an effort to both unify code bases and provide tighter integration with third-party application performance management (APM) tools from AppDynamics, a unit of Cisco Systems.

    Vicky Giavelli, director of product management for performance engineering at Micro Focus, said Micro Focus in now in the first stages of unifying the code base of instances of LoadRunner that run on-premises and the cloud to enable DevOps teams to more flexibly test applications regardless of where they are deployed.

    DevOps teams can already share licenses across LoadRunner products and rapidly scale up or down based on seasonal or ad hoc demands, she noted.

    As testing continues to shift left, Giavelli said, Micro Focus continues to invest in aligning the LoadRunner family of application testing tools with multiple DevOps platforms. LoadRunner tools currently support more than 50 application protocols and technologies and more than 52 scripting technologies in addition to providing integrations with open source continuous integration/continuous delivery (CI/CD) tools and data visualization platforms such as Grafana and InfluxDB.

    The alliance with AppDynamics extends that strategy by making it easier for DevOps teams that employ LoadRunner to consume and share data with users of one of the most widely employed APM platforms, she noted.

    Giavelli said Micro Focus continues to enhance the user experience of a testing platform that has been widely employed now for a quarter-century. While competition has increased considerably during that time, the LoadRunner family of tools has maintained its base among application testers, she said, while extending its appeal to developers, who increasingly are taking responsibility for testing as part of an integrated set of DevOps processes.

    Of course, it’s still not clear how far left toward developers application testing might shift. While the consensus might be that more testing on the part of developers is good, application testers may provide a more unbiased opinion about how well an application accomplishes the ultimate business goal.

    Regardless of the role of testing within the organization, the one thing that everyone agrees on is it should be easier to generate meaningful tests that reflect real-world use. No matter who does the testing, the goal is to not have to roll back an application once it is deployed in a production environment. As applications become more complex, Micro Focus continues to invest in machine learning algorithms and other forms to advanced analytics to identify potential issues sooner than later, noted Giavelli.

    It’s too early to say how the battle between application testing vendors will play out in the months ahead. The one thing that is certain is that in the wake of the COVID-19 pandemic, application testing has never been more critical. More organizations than ever are building digital business applications to make it easier to engage with their customers, at a time when many of them might not be returning to an office anytime soon. The issue, of course, is that not many of their end users will be especially tolerant of issues such as a mobile computing application that doesn’t live up to expectations the first time it’s deployed.

  • Grafana Labs Update Aims to Simplify Observability

    Grafana Labs Update Aims to Simplify Observability

    Grafana Labs today released an update to the open source Grafana project that adds a viewer that simplifies tracking the path of a single request through a distributed system.

    Version 7.0 also adds a plug-in for Amazon CloudWatch Logs along with support for Apache Arrow, a unified data and plugin framework that promises to make it easier to build plug-ins for the analytics and monitoring tools that are widely employed in DevOps environments to provide observability.

    The latest release also adds a range of automatic rendering options for a variety of formats, including tables and non-time-series charts alongside panel plugins for maps, pie charts and gauges.

    Ryan McKinley, vice president of applications for Grafana Labs, said Grafana has gained traction in DevOps environments in part because it makes it easier to query and analyze multiple types of data without having to pull it all into a central repository. All queries are launched against data wherever it resides, he said, noting by chaining a set of simple point-and-click transformations, users will be able to join, filter, rename and calculate all in the same platform.

    That approach makes it easier for DevOps teams to set up observability platforms using any mix of tools and services without much help from internal IT operations teams. That approach is now also starting to gain traction outside of DevOps environments as business analysts look for easier ways to also analyze data from different classes of applications, McKinley added.

    While observability has always been considered a core tenet of DevOps, achieving it has been challenging for most organizations. Simply setting up all the underlying platforms required has proven too challenging for many IT teams. Grafana has emerged as a tool that enables DevOps teams to visualize relevant data within the context of a custom-built observability platform.

    It’s not clear to what degree Grafana might emerge as a de facto standard. However, during an economic downturn, it’s not uncommon for IT organizations to rely more on open source tools to reduce costs. Rather than having to lay off an analyst or developer, many organizations will first look to reduce their reliance on commercial software licenses. Many of those same organizations have been wrestling for years with a fragmented approach to analytics software that often can yield conflicting insights.

    McKinley said one of the benefits of Grafana is that it reduces the cost of developing different models that enable organizations to explore different potential scenarios. Too often organizations are wedded to specific models that might not reliably reflect a new business trend simply because the cost of creating a new model is too high or takes too much time.

    Whatever the analytics path forward, the one thing that is clear is that as IT continues to become more complex thanks in part to the rise of microservices, DevOps teams will no longer be able to function without some form of observability platform being readily accessible. The only real question now is how best to go about building and maintaining that observability platform.

  • F5 Networks Surfaces Application Insights

    F5 Networks Surfaces Application Insights

    F5 Networks, at its Agility 2020 online event today, unfurled Beacon, a software-as-a-service (SaaS) platform that enables IT teams to better monitor and troubleshoot applications using telemetry data collected from networking equipment from both F5 and third-party sources.

    In addition, the company announced an update to NGINX Controller that enhances application analytics along with improvements to the declarative application programming interfaces (APIs) that NGINX Controller provides.

    Finally, F5 Networks unveiled an update to BIG-IQ, a set of tools for managing application services delivered via its network operating system. Version 7.1 of BIG-IQ adds visibility into legacy application services, streamlines management workflows and adds security management functionality.

    Hitesh Patel, senior director of product management for automation, orchestration and ecosystems at F5 Networks, said all three offerings are part of an ongoing effort to make it easier for IT organizations to meld network operations (NetOps) and best DevOps practices. Beacon, for example, ingests telemetry data streams from multiple sources to provide visibility and surface actionable insights via an application-centric view of the IT environment, he said, adding that approach makes it easier for NetOps and DevOps teams to collaborate.

    A companion Beacon Insights tool can be employed to detect anomalies and run analytics to determine the root cause of an issue, he said.

    Patel noted as IT environments become more complex, the need to eliminate silos that make managing IT holistically has become more pressing. For example, modern applications based on microservices are especially difficult to manage across an increasingly distributed computing environment.

    Less clear currently is how much or even whether DevOps and NetOps teams will merge. Network resources increasingly are being exposed via APIs that developers can programmatically invoke to provision resources. However, many IT teams are trying to control how much network bandwidth is allocated to any given application. As a result, many NetOps teams are setting up portals through which DevOps teams are given access to a maximum amount of bandwidth for specific sets of applications.

    On the plus side, Patel noted that as applications become more instrumented, thanks in part to the rise of DevOps, it’s becoming easier to apply analytics. That capability makes it easier for developers and NetOps teams to troubleshoot issues using a common set of metrics and dashboards that can feed data back to a continuous integration/continuous delivery (CI/CD) platform, he said.

    It may be a while before each IT organization finds the optimal level of convergence between their respective DevOps and NetOps teams. However, as applications become more distributed in the age of the cloud, networking will have a greater impact on application performance. The trouble is, most DevOps teams aren’t sure whether application performance issues are the result of the code written by developers or the latency being introduced by the network. Whatever the root cause, many IT teams are spending an inordinate amount of time trying to determine the root cause of application performance issues.

  • Report: More Appreciate the Value of Observability

    Report: More Appreciate the Value of Observability

    Observability may be a core tenet of any best DevOps practice, but the number of organizations that actually engage in it is still not nearly as high as it should.

    A survey of 400 software engineers published this week by Honeycomb, a provider of an observability platform, finds nearly half said they are not currently practicing observability. However, the number of organizations that expect to embrace it is growing. The Honeycomb survey finds 75% of those respondents who haven’t implemented an observability plan to do so at an advanced level within the next two years.

    Conducted by ClearPath Strategies, the survey also finds that about a third of respondents are still evolving their observability capabilities. Only 10% of survey respondents exhibited what the survey describes as highly advanced capabilities.

    Liz Fong-Jones, principal developer advocate for Honeycomb, there is some correlation between the number of developers an organization employs and their reliance on observability. Among organizations that have advanced observability capabilities, 42% have more than 100 developers.

    In general, Fong-Jones said interest in observability is on the rise because it is becoming much easier to instrument applications. The emergence of open source agent software has made it much easier for observability platforms to collect relevant metrics that go way beyond simply monitoring an IT environment by sampling application traffic and analyzing logs, she noted. Observability platforms, in contrast, make use of technologies such as dynamic tracing to provide deeper insights into the root cause of an application issue.

    That approach also ties more closely to a specific user benefit versus simply collecting metrics that don’t surface any actionable intelligence, she added.

    Fong-Jones noted that observability platforms are now also playing a key role in eliminating technical debt. As organizations embrace microservices, for example, it’s becoming more challenging to identify bottlenecks and potentially redundant microservices. Observability platforms make it easier for DevOps teams to uncover these issues at a time when applications are becoming more complex, she said.

    There’s no doubt reliance of observability platforms will continue to substantially increase as organizations dive deeper into best DevOps practices. Most applications deployed by most enterprise IT organizations are not that deeply instrumented. As instrumentation becomes more pervasive, IT organizations will be able to drive more value from observability platforms. That could be crucial because it’s not uncommon for IT teams to spend weeks trying to find the source of an issue that might only take a few minutes to fix.

    Observability may not always be top of mind for IT teams but within the context of a best DevOps practice, it’s crucial. Many organizations are clearly racing to deploy applications without being able to observe how application code is behaving. In the absence of observability, it’s a foregone conclusion that tensions between developers and IT operations teams will rise. The challenge and the opportunity are to get everyone involved in IT on the same page in a way that ensures everyone involved is talking about the same thing at the same time.

  • New Relic Moves to Democratize Distributed Tracing

    New Relic Moves to Democratize Distributed Tracing

    New Relic has launched a service that leverages cloud resources to make analytics based on distributed tracing more accessible to DevOps teams.

    Andrew Tunall, general manager for New Relic serverless and emerging cloud services, said the New Relic Edge with Infinite Tracing service democratizes access to distributed tracing analytics by providing access via a software-as-a-service (SaaS) application that is managed entirely by New Relic. Rather than having to set up a platform to analyze distributed traces, Tunall said the New Relic Edge with Infinite Tracing service provides access to observability analytics for up to eight days.

    The service observes all application traces across distributed systems in a way that makes it easier to identify actionable issues, said Tunall. The amount of telemetry that’s emitted across a distributed system can easily involve tens of millions or even hundreds of millions of spans per minute. By keeping distributed tracing data on the public cloud, New Relic is also minimizing the amount of egress data from the cloud, which he noted serves to significantly reduce potential cloud computing costs given the fees cloud service providers charge for moving data off their platforms.

    Tunall said it’s become more feasible to employ distributed tracing rather than relying on sampling because modern applications are more highly instrumented. DevOps teams have realized access to telemetry data is at the core of any effort to enable observability within the context of best DevOps practices. The challenge has been that setting up the tools to achieve that observability goal has required the expertise of the equivalent of a site reliability engineer.

    The New Relic Edge with Infinite Tracing service, in contrast, provides easier access to observability tools based on distributed tracing to any member of the DevOps team, he said. That approach means for the first time in many cases, developers and members of the IT operations team will have access to a common set of tools for at least discovering the root cause of an application issue. In fact, the existence of such tools might go a long way toward fostering increased adoption of best DevOps practices.

    It’s not quite clear to what degree the rise of distributed tracing will impact the use of sampling to monitor IT platforms. In most cases, sampling is relied on to identify a potential issue, while distributed tracing provides the means to drill down to the point where the root cause of any issue is readily identifiable. However, as open source agents for capturing application metrics become more widely available and the cost of distributed tracing continues to decline, reliance on traditional sampling techniques might decline. At this stage, however, many organizations have not fully appreciated the difference between being able to completely observe an application and simply monitoring it, so it may be a while before distributed tracing is applied pervasively.

    In the meantime, at a time when applications are becoming more complex, the tools needed to manage them are, fortunately, becoming more accessible.

  • Overcoming Hybrid and Multi-Cloud Management Challenges with APM

    Overcoming Hybrid and Multi-Cloud Management Challenges with APM

    When companies move toward hybrid and multi-cloud, both leadership and IT can struggle to adapt their organizational structures and processes to a new, more complex way of doing things.

    With the classic form of DevOps, for example, operational monitoring and management procedures are radically new and different: from a management perspective, it almost appears as a free-for-all, making assessment and accountability to the business difficult to achieve on a regular, ongoing basis.

    The older system was straightforward: on-premises monitoring and management teams were organized around a technology stack, with associated monitoring and management tooling. The network, server and storage teams each had distinct processes. Different problems were escalated and triaged (Level One, Level Two, Level Three). It was formulaic—perhaps even annoying to some tech pros—but it worked.

    DevOps is different. Applications are changed, tested and deployed in production continuously, often on an hourly basis (or more frequently). It’s revolutionary because it delivers maximum business market agility, embraces technical and business evolution, and is never-ending. It radically redefines the concepts and approaches we associate with application and infrastructure support and triage processes.

    But there’s good news: Application performance solutions and workarounds are coalescing. Here’s a few ways we’re seeing teams evolve to overcome the challenge of hybrid and multi-cloud application and infrastructure management.

    Try a Monitoring Engineer

    Right now, we’re all experimenting—we’re in a digital Wild West. In that spirit, forward-looking outfits are working with the concept of a monitoring engineer (sometimes monitoring support), someone who owns the monitoring of everything important in the context of an application or a line of business.

    “Monitoring engineer” as a job title can mean many things. If you Google it you’ll find open positions for many kinds of these engineers. But for our purposes, it’s a stand-in for a new concept, a new way of thinking. To be clear, this isn’t a network monitoring engineer, or any other kind of job with the title of engineer. It’s a new way to better and more proactively align IT with the business goals of the company paying the bills.

    Traditionally, metrics have been aligned to the application or applications being built out—not the business itself. More importantly, these metrics aligned around answering questions like, “Is this specific element of infrastructure or application available and performing?” Especially at the infrastructure level, performance was defined typically as a technology resource utilization metric (i.e., how efficiently are technology resources being consumed). This new concept of monitoring engineer is designed to allow management to quickly get the answers it needs in a consolidated and focused fashion—to move, in effect, from resource-centric monitoring to service and application-centric monitoring.

    Application performance monitoring (APM) has evolved thanks to measurement focused on application availability and performance rather than infrastructure. APM requires a certain amount of applications knowledge. The monitoring engineer needs to know enough about the application environment, how the application is configured and how it’s deployed operationally but doesn’t have to be the expert in the application code itself.

    Importantly, a successful monitoring engineer requires time and focus—and management needs to set up a structure to support it. Any competent system administrator or network engineer who’s worked in a complex private cloud or on-prem hybrid environment would have the skills to do this. But these engineers need time and the ability to focus on their job, while adding APM skills to their repertoire.

    Creating Metrics That Matter

    Along with the dedicated monitoring engineer who’s minding the technology store for management, processes and languages must be standardized.

    Think back to when virtualization swept the tech pro world, some 10 or 15 years ago. We had to change and adjust. We have to do it again.

    We should start by standardizing the application languages tech pros use. How we choose languages should always be business-driven: Different languages are good at different things, which should be the deciding factor. The number of languages should also be limited, so management can be more straightforward. Similarly, standardization should be the default wherever possible to approaches considered for automated deployment and dynamic configuration management of both applications and infrastructure resources.

    Keeping things as simple as possible doesn’t mean not learning new things, however. Management will need to cultivate a culture of curiosity. Tech pros must learn new ways of working—if they don’t, the transfer to hybrid and multi-cloud will be a guaranteed slog, or worse.

    If the tech pros stay curious, they’ll stay ahead. The APM market is growing at a considerable rate, and the people with the curiosity to get involved in it are the ones who will succeed.

    APM gives tech pros a powerful tool they can easily add to their skillset by which they can then generate the data and the metrics in the language of the business. When metrics are business focused, they matter.

    The measurements the business (and customers) care about are fundamentally limited to four key metrics, in two classes:

    • Application performance—how much business work is being accomplished over time, along with the response-time experience of users.
    • Availability management—whether all resources associated with the entire technology stack are continuously up and available to service the applications, along with any and all associated errors.

    Taking this approach to measurement is about meeting the company needs in business terms, not IT. This approach is critical for ensuring excellent customer experience or an ability to immediately and cost-effectively respond to peaks in business demand. This approach answers the questions: What are users experiencing? How are specific pages and transactions performing? APM can also discover what infrastructure components are needed to support those applications delivering successful service.

    Answers like these can’t be discovered with infrastructure monitoring alone, nor with infrastructure-centric monitoring of application performance that infers performance from technology resource utilization rates. Nor can they be answered with network monitoring or storage monitoring. Only APM provides the answers the business needs. It’s the glue to bind together the different silos.

    Measurement Matters Most on a Thin Margin

    We’re in a new environment. In many ways, it’s the Wild West and there are many ways to win and lose. Few things seem absolutely right, except this: Tech pros need to be completely aligned with the businesses they work for.

    In the past, a strategy such as APM was perhaps better aligned with industry verticals. Companies operating with thin business margins were reluctant to measure. Now, it’s the opposite. Companies such as those in the e-commerce, B2B, B to high volume and B2C spaces continue to operate on thin margins and are now in a virtuous spiral. Their success depends on efficiency—and efficiency is key to making them win in the increasingly competitive marketplace.

    To achieve this level of success, companies must measure and assess where they’ve been and where they’re going. They need to do more than just keep up with the competition, they need to accept innovative processes such as DevOps, while continuously measuring their progress.

    Ultimately, speaking in the language of business can take many IT professionals outside their comfort zones. But APM gives the wary tech pros a powerful tool for generating the kinds of data and metrics management needs. APM grounds the business, but also makes sense of the new hybrid and multi-cloud environment. It’s a chance for management and IT to bridge the gap between us and them. It’s the best way to manage the changes to come.