Category: Application Performance Management/Monitoring

  • SolarWinds Strengthens AppOptics APM Platform

    SolarWinds today updated its AppOptics application performance management (APM) platform by adding both service- and trace-level root cause analysis capabilities.

    Jim Hansen, vice president of products, application management for SolarWinds, said the goal is to provide most of the same capabilities any IT organization would find in an APM platform that would cost 10 times more than AppOptics.

    That’s critical at a time when thanks to the rise of microservices-based applications based on containers more IT organizations are discovering they need to apply APM platforms more broadly, added Hansen. Previously, IT teams tended to reserve usage of APM platforms to their most mission-critical applications because of the costs involved. However, as SolarWinds moves to drive the cost of accessing an APM platform delivered via a software-as-a-service (SaaS) application, Hansen noted APM platforms are becoming more affordable.

    The service-level root cause analysis module is also designed to more accessible to the average IT administrator by reducing the number of steps and clicks required to identify the specific performance problem or issue. A complementary AppOptics trace-level root cause analysis then makes it possible to drill down into application metrics all the way down to specific lines of code and transactions. The goal is to make APM platforms more accessible to IT generalists, said Hansen.

    Those service- and trace-level root analysis features are available both in the core platform as well as a free AppOptics Dev Edition tool that SolarWinds makes available for developers.

    While AppOptics is the core APM platform provided by SolarWinds, the company also makes available a Loggly log management platform and Pingdom performance monitoring tools for websites. Collectively, those platforms make it easier to manage IT environments that are becoming increasingly complex to manage, said Hansen.

    In general, Hansen said IT organizations are starting to converge application and infrastructure management, especially if they have embraced best DevOps processes. In some cases, one member of a DevOps team is managing both, while other organizations are having teams of IT professionals collaborate around the same APM platform.

    At the same time, Hansen noted IT organizations want to be able to employ the same APM platform to manage both monolithic and microservices-based applications versus having to acquire separate APM platforms for both types of applications.

    It’s too early to say to what degree SolarWinds might be able to usurp rival providers of APM platforms that have been available for more than two decades. However, Hansen noted that in terms of market penetration, fewer than 10% of IT organizations have standardized on an APM platform.

    As organizations transition to microservices-based applications, APM platforms become a necessity. The overall IT environment is simply becoming too complex to manually monitor and manage. At the same time, businesses are starting to have a greater appreciation for how dependent digital processes are on software. The issue now isn’t so much whether those organizations need an APM platform as much as it is figuring out which APM platform can they afford.

    — Mike Vizard

  • Cloud Confessions: Full Stack APM Is a Necessity

    Cloud Confessions: Full Stack APM Is a Necessity

    IT environments have become more dynamic and complex, which has created the need for robust monitoring tools. As a result, companies are increasingly adopting more than one platform, catapulting us into the multi-cloud era. Technology professionals are also embracing and acknowledging the need for comprehensive, full-stack application monitoring and management, bringing application performance management (APM) into the mainstream.

    The recent SolarWinds survey Cloud Confessions 2020 reveals even though APM has become mainstream (with a majority of tech pros using APM tools regularly), there’s still work to be done to move beyond troubleshooting. This finding is consistent with last year’s study, in which nearly half of the respondents said troubleshooting was a top-three task they managed daily.

    Tech pros have an opportunity to fully leverage the benefits of APM across the entire application stack, not just for troubleshooting. They should enable tech pros at any stage in their APM journey to realize the value and richness of end-to-end optimization with APM.

    In 2020, implementing solutions to achieve integrated application performance and availability management for any type of organization will become increasingly important.

    The Cloud Confessions survey showcases how application owners, developers and support teams currently use APM tools. It also shows areas where tech pros feel they need more education and support to confidently utilize APM solutions.

    Cloud Confessions Key Findings

    This survey explores how extensively technology professionals are using APM tools, whether on-premises or for SaaS-based application management and how they monitor these environments. It also showcases areas where tech pros feel confident in their APM tools and strategies, as well as challenges and avenues for building confidence.

    The key findings show:

    1. Tech pros are using APM tools, employing a nearly even mix of SaaS and on-premises to support the three architectures most often found in modern environments. Despite this, confusion around which tools are ideal for specific IT environments is consistent across application owners, developers and support team roles.

    • Nearly nine in 10 tech professionals are using APM tools in their environments.
      • 59% are using APM for monolithic (traditional on-prem) app development architectures.
      • 40% are using APM for N-tier service-oriented architectures.
      • 39% are using APM for microservices.
    • The top three most commonly deployed tools in support of APM strategies are:
      • Database monitoring (64%).
      • Application monitoring (63%).
      • Infrastructure monitoring (61%).
    • Two-fifths of tech pros face challenges due to lack of awareness of what APM solutions are currently offered and confusion over which currently offered APM solutions are best for their needs (respectively).

    2. Overall, tech pros are confident in their ability to manage and monitor applications on-prem, in hybrid environments and in the cloud; this confidence mostly sits within their ability to troubleshoot.

    • Over eight in 10 (84%) respondents are confident in their ability to successfully manage application and infrastructure performance.
    • Two-fifths (40%) of tech pros surveyed are most confident troubleshooting application issues and monitoring application availability and performance (respectively) given their existing skillset, followed by one-third (32%) of tech pros confident in collaborating with team members.
      • Troubleshooting and monitoring as the top two areas where tech pros have the most confidence is consistent with last year’s findings—in 2019, troubleshooting app issues was the number one activity tech pros spent their time on, with 48% of respondents choosing this as a top three task.

    3. The largest challenges tech pros face when monitoring and managing application and infrastructure performance relate to an existing knowledge and skills gap. As a result, tech pros have continued to deal with the troubles of troubleshooting, despite nearly all using some type of APM tool in the last 12 months.

    • When ranking the challenges, tech pros said:
      • Lack of training for personnel was the top challenge (57%), followed by lack of awareness of what APM solutions are currently offered (44%) and confusion over which currently-offered APM solutions are best for our needs (42%).
      • All other challenges were at, or under, the 30% rate.
    • Nearly eight in 10 (78%) tech pros report spending less than 10% of their time proactively optimizing their environments (vs. reactively maintaining).
      • In 2019, 77% of respondents reported spending the same amount of time on proactive optimization.

    4. Tech pros value the business insights delivered from APM tools, but greater skills development is needed in establishing KPIs and communicating IT performance to the business.

    • The top three business insights tech pros gain from APM tools include:
      • Ability to prevent applications outages (73%).
      • Ability to prevent app slowdown related to performance and/or capacity (63%).
      • Ability to improve user/customer experience (62%).
    • Tech pros are collecting these business metrics, but there’s a need to bridge the gap between business metrics collected and tech pros’ confidence in their ability to communicate performance to the business.
      • 34% of tech pros feel they need to improve their current skillset/ability to track impact across key business metrics to more confidently manage their organization’s IT environment, followed by 30% of tech pros who feel they need to improve their current skillset/ability to troubleshoot application issues, improve the performance of application code (29%) and manage/ensure/improve end-user performance (29%) (respectively).

    The key findings uncover the importance of knowing which combination of APM elements are right for your environment. Today’s environments are highly complex and distributed, involving microservices, N-tier, monolithic and commercial off-the-shelf (COTS) applications. This means the potential benefits of APM are even greater in modern contexts, as long as tech pros take time to educate themselves on the right tools for their environments.

    While APM tool usage is widespread, it’s not nearly as effective as it could be—an important distinction to business leaders in charge of digital transformation efforts. When we understand the APM world beyond troubleshooting, the possibilities for application performance optimization open up across the stack and across previously siloed teams.

    APM, when used to its potential, can be the great unifier of tech pro teams all working toward the goal of having highly available, well-performing applications and it can change the way modern businesses operate in the age of performance.

    — David Wagner

  • New Relic Adds Support for W3C Trace Context Spec

    New Relic Adds Support for W3C Trace Context Spec

    New Relic has begun adding support for the W3C Trace Context standard within the agent software it uses to collect metrics for its application performance management (APM) platform.

    W3C Trace Context is a specification that defines the format for propagating distributed tracing context between services. Distributed tracing makes it simpler for DevOps teams to track events across multiple services. Each step of a trace is correlated through an ID that is passed between services, with the specification defining a standard for the context propagation headers.

    The W3C Distributed Tracing working group moved the Trace Context specification to the point where it could be consumed by platform vendors late last year. TraceContext has since been adopted by the OpenTelemetry project, an open source observability framework being developed under the auspices of the Cloud Native Computing Foundation (CNCF), along with providers of APM platforms such as New Relic, LightStep and Dynatrace. Vic Soares, director of product management for New Relic, said many of the individuals working on the TraceContext and OpenTelemetry projects come from the same organizations.

    The first phase of the Trace Context project has focused on HTTP. The members of the project are also working toward defining trace context propagation for other formats, starting with AMQP and MQTT for IoT. The project team is also working on providing context propagation from clients and web browsers.

    That approach solves an issue that arises when using proprietary formats: As trace context headers move across boundaries such as proxies, service meshes and messaging systems, proprietary headers tend to be dropped, which often winds up breaking traces, said Soares.

    Soares said DevOps teams will need to upgrade the agent software they have in place to take advantage of Trace Context to provide more context across distributed services. Distributed tracing, however, will not replace sampling. Rather, distributed tracing provides a mechanism for identifying the root cause of issues that may first be uncovered using sampling techniques.

    New Relic APM agents for Java 5.1.0 and higher, Python 5.5 and higher, Go 3.1.0 and higher and the New Relic open source Elixir agent now support the standard. Support for Trace Context support in other New Relic agents, as well as the New Relic Browser agent, are expected to be available shortly. New Relic APM agents that support W3C Trace Context can accept and emit both the W3C Trace Context header format and the New Relic header format. The new agents are also backward-compatible to enable trace context and will be propagated between services with older and newer releases of New Relic agents. IT organizations can also opt to disable the New Relic proprietary trace format once they’ve upgraded all agents to a W3C-compliant version.

    Given the complexity of microservices-based applications, many organizations that deploy these applications will be among the first DevOps teams to take advantage of distributed tracing to not just troubleshoot applications but also proactively manage their application environments. Going forward, a lot more of the DevOps focus needs to be on identifying potential issues long before they can become a bigger problem.

    — Mike Vizard

  • Dynatrace Extends AI Reach of APM Platform

    Dynatrace Extends AI Reach of APM Platform

    Dynatrace, at its Perform 2020 conference today, extended the reach of the Davis artificial intelligence (AI) engine it makes available via its application performance management (APM) platform to include deeper ties with mobile applications along with an ability to track key performance indicators (KPIs) such as revenue trends and customer churn.

    In addition, Dynatrace has enabled one-click integration with web analytics tools such as Adobe Analytics.

    Those capabilities are in addition to deeper integration between the Davis AI engine and Kubernetes that was announced earlier this week at the conference.

    Mike Maciag, chief marketing officer for Dynatrace, said usage of APM platforms is expanding beyond IT teams to include business users at a time when organizations are building and deploying more digital business applications. Most of those emerging applications revolve around mobile computing devices so Dynatrace is also extending the reach of the Davis AI engine to provide digital experience management capabilities, including advanced analytics and segmentation of mobile app user sessions, auto-instrumentation for additional mobile platforms such as React Native and tvOS and insights into third-party mobile applications components, he said.

    Specifically, Dynatrace multi-dimensional analytics now include crash reporting workflow and granular segmentation capabilities spanning health, performance and usage metrics across all app components and user actions. That capability will eliminate an APM blind spot most organizations have today, said Maciag.

    With more than 200 billion mobile applications having been deployed at a cost of $120 billion in 2019, Maciag said it’s apparent the scope of the challenge requires additional help from an AI engine.

    Coupled with an ability to now track how application performance is impacting KPIs, Maciag said there is now an opportunity to unlock a gold mine of business data that is locked up in observability platforms using modules such as the Dynatrace Digital Business Analytics.

    To further enable that capability, the Davis AI engine within that module provides automatic, real-time alerts on anomalies that might impact the business now using a wider array of data sources.

    It’s not clear to what degree business users might rely on APM platforms to surface events that could impact business outcomes. Most business users rely on either business intelligence (BI) applications or traditional spreadsheets to manage the business. However, as more processes become digitized using software APM platforms can surface events long before they are ever reflected in a BI application or spreadsheet. In fact, chances are good that business leaders are more likely to be able to affect the ultimate outcome sooner should they choose to analyze events in real-time via an APM platform.

    In the meantime, as application environments become more complex, reliance on APM platforms continues to grow. Once used mainly to keep track of only the most mission-critical monolithic applications in the enterprise, organizations are now tasking DevOps teams to manage entire business processes end to end basis. The challenge, of course, is most of those business processes consist of a wide variety of front and back-office applications that more often than not were built using entirely different frameworks.

    — Mike Vizard

  • Survey Finds Much Room for APM Improvement

    Survey Finds Much Room for APM Improvement

    A survey of 317 application owners, developers and support team professionals in the U.S. and Canada published by SolarWinds finds that while reliance on application performance management (APM) tools is widespread, most IT teams are still relying on these tools to react to events rather than to proactively improve application experience and performance.

    The survey finds 9 out of 10 IT professionals are making use of APM tools that are either deployed on-premises or accessed via a software-as-a-service (SaaS) platform. Nearly 8 in 10 respondents spend less than 10% of their time proactively optimizing their environments, according to the results.

    In fact, the biggest APM challenges identified by survey respondents were lack of training for personnel (57%), followed by a lack of awareness of what APM solutions are currently offered (44%) and confusion over which APM solution best fits their needs (42%).

    Jim Hansen, vice president of products for application management for SolarWinds, said some of those challenges stem from the fact that there are too many APM tools to deploy and master. Survey respondents are employing a mix of database monitoring (64%), application monitoring (63%) and infrastructure monitoring (61%).

    IT management is further being complicated by the adoption of a wide variety of application architectures. According to the survey results, organizations are applying APM tools to manage monolithic (traditional on-prem) app development architectures (59%), N-tier service-oriented architectures (40%) and microservices-based applications (39%).

    Hansen said as organizations increasingly move away from monolithic applications, the need for a more proactive approach to APM across the full stack will become more apparent. The level of dependencies between microservices especially will drive organizations toward APM platforms capable of correlating events across both applications and the underlying infrastructure on which they depend, he noted.

    Less clear is to what degree IT teams are comfortable using the analytics surfaced by APM tools to automate the remediation of any given issue. According to the survey results 84% of respondents are confident in their ability to successfully manage application and infrastructure performance, with 40% reporting they are most comfortable from a confidence perspective to use APM tools to troubleshoot application performance issues. The top three insights survey respondents said they gain from APM tools are the ability to prevent application outages (73%), the ability to prevent app slowdown related to performance and/or capacity (63%) and the ability to improve user/customer experience (62%).

    In terms of areas for improvement, survey respondents identified improving their current skillset/ability to track impact across key business metrics (31%), followed closely by the need to improve their current skillset/ability to troubleshoot application issues (30%). The ability to improve the performance of application code and manage/ensure/improve end-user performance tied at 29%, respectively.

    Of course, troubleshooting an existing issue is one thing. Proactively using APM tools to prevent issues from occurring represents a more advanced approach to managing IT in keeping with best DevOps practices. It will be interesting to see how much the adoption of N-tier and microservices applications will foster further adoption of best DevOps practices.

    Most organizations today have embraced DevOps practices to varying degrees. However, as IT becomes more complex to manage in the age of the hybrid cloud it’s now only a matter of time before legacy approaches to managing IT as simply no longer practical to employ.

    — Mike Vizard

  • LightStep Adds Regression Monitoring to APM Platform

    LightStep Adds Regression Monitoring to APM Platform

    LightStep this week announced it has added a Service Health for Deployments module to its namesake observability platform designed from the ground up for microservices and serverless computing frameworks.

    Talia Moyal, senior product manager for LightStep, said Service Health for Deployments will make it possible for DevOps teams to monitor performance regressions both during and after an application is deployed.

    DevOps teams can also take advantage of aggregate trace analysis functionality such as latency histogram comparisons, operations diagrams and an automated correlation engine for performing rapid root cause analysis to understand why a regression is occurring.

    Finally, a built-in instrumentation scoring capability enables DevOps teams to compare performance before, during, and after a deployment; compare latency across instances to estimate the size and scope of a regression; correlate tags that have the biggest impact on latency; and map critical path latency for each operation or service.

    As organizations embrace microservices and serverless computing frameworks, the overall IT environment becomes more complex to manage. As an application performance management (APM) platform, LightStep makes use of OpenTelemetry software to gather metrics that are then fed into a statistical engine to detect anomalies, which the APM can then record and replay. By employing OpenTelemetry, LightStep is able to employ distributed tracing to surface more context than traditional APM tools, said Moyal.

    Given the costs involved in employing APM platforms, most IT organizations historically have limited their use to their most critical monolithic applications. However, the dependencies that exist between microservices and serverless computing frameworks that make up a modern cloud-native application are now requiring IT organizations to apply APM platforms more broadly. In fact, observability is a core principle of best DevOps practices that many organizations are embracing more widely as they build and deploy cloud-native applications. Many of those applications will run just fine when initially deployed, but over time performance can degrade for a whole host of reasons that span everything from increased storage access latency to too many calls being made to the same application programming interface (API).

    Of course, there is no shortage of options when it comes to APM platforms. LightStep is making a case for OpenTelemetry because it provides a single set of open source APIs, libraries, agents and collector services to capture distributed traces and metrics. That approach makes it easier for developers to instrument their applications in a way that allows platforms such as LightStep to surface more insights into application performance. LightStep claims it has already employed that approach to analyze more than 1.4 trillion traces. OpenTelemetry is currently being developed under the auspices of the Cloud Native Computing Foundation (CNCF).

    It’s too early to say to what degree traces will supplant traditional sampling methods to analyze application performance. The one thing that is certain is as developers are held more accountable for application lifecycle management, many of them are demanding access to more sophisticated APM tools to provide the visibility they require to resolve application performance issues faster.

    — Mike Vizard

  • Red Hat Bolsters RHEL 8 Monitoring

    Red Hat Bolsters RHEL 8 Monitoring

    Red Hat is looking to expand the number of organizations embracing best DevOps practices by expanding the monitoring capabilities included in Red Hat Enterprise Linux (RHEL).

    The beta release this week of RHEL 8.2 includes an update to Performance Co-Pilot (PCP), a system performance toolkit that now includes collection agents for Microsoft SQL Server 2019 databases.

    Scott McBrien, a principal product manager for Red Hat, said by extending the scope of the performance toolkit, Red Hat is looking to make it easier for IT generalists and developers to collaborate across silos to better maintain application performance levels. Support for Microsoft SQL Server 2019 is an outgrowth of the alliance Red Hat formed with Microsoft way back in 2015. However, McBrien said IT organizations should expect Red Hat to continue to expand the reach of PCP.

    RHEL 8.2 Beta also simplifies the process of invoking the Red Hat Insights analytics service during the installation process and provides tighter integration with the extended Berkeley Packet Filter (eBPF) to better analyze network traffic.

    Finally, the latest version of RHEL extends an Applications Stream capability to segregate runtimes and languages to additional programming environments and provides a tool to test in-place upgrades to RHEL 8 from RHEL 6/7.

    McBrien said Red Hat is trying to keep to a six-month upgrade cycle of RHEL to provide IT organizations with a more predictable timetable. Of course, most of Red Hat customers are still running RHEL 6/7 releases. However, as the rate at which applications are built, deployed and updated continues to accelerate in the age of DevOps, the more pressure there will be on IT teams to maintain application performance levels across an increasingly extended enterprise. Inevitably, IT generalists will need access to a broader range of observability tools at all layers of the stack to keep pace.

    Adoption of DevOps practices across the enterprise remains uneven at best. However, as more IT generalists are exposed to richer monitoring tools at the operating system level, the easier it becomes to augment or supplant legacy ITIL-based approaches to managing IT. In fact, as tools at the disposal of IT generalists become more sophisticated, the need to rely on various classes of IT specialists declines. Most IT organizations are especially keen to achieve that goal because labor stubbornly remains the single biggest cost of IT.

    It remains to be seen to what degree the management of IT will be transformed in the months and years ahead. The one thing that is certain is IT will become more complex as new architectures based on microservices and serverless computing frameworks get adopted. Each additional layer of abstraction may make it easier for developers to build applications, but from the perspective of the IT operations teams, they tend to increase dependencies between systems that are already fairly fragile. The challenge now is to identify where bottlenecks exist between all those systems before a degradation in application performance becomes a full-blown catastrophic event.

    — Mike Vizard

  • IBM Open Sources SysFlow Monitoring Platform

    IBM Open Sources SysFlow Monitoring Platform

    IBM has announced that its SysFlow monitoring platform is now available as an open source project.

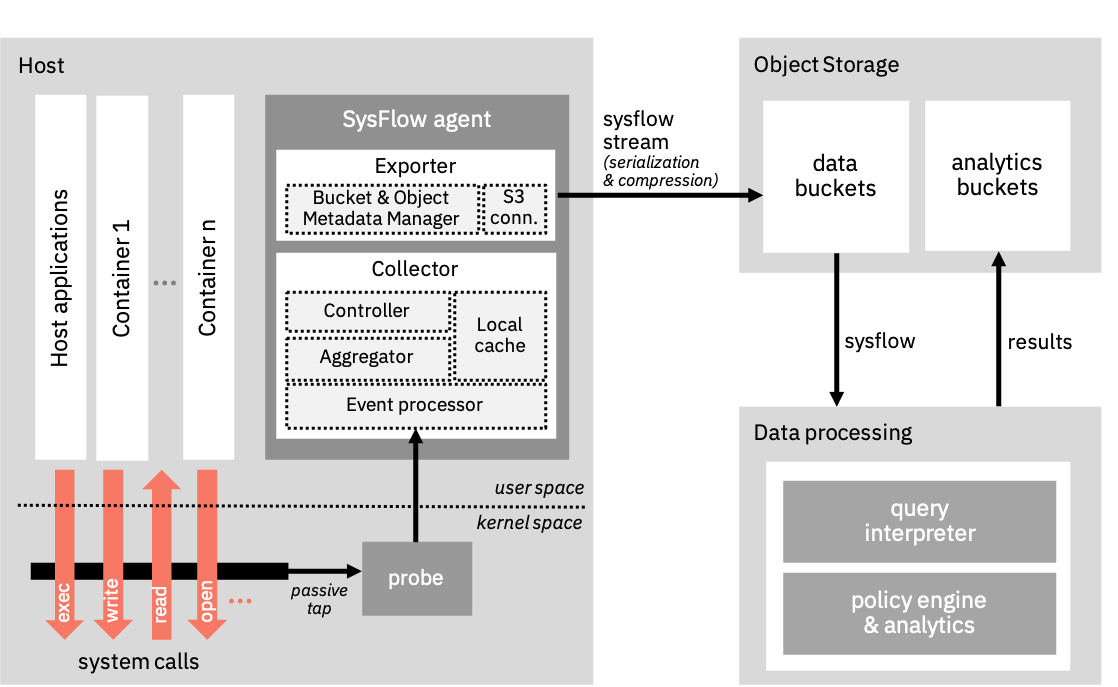
    Fred Araujo, a research scientist in the Cognitive Cybersecurity Intelligence Group at IBM Research, said IBM developed lightweight SysFlow agent software and monitoring tools as a way to provide more context around the telemetry data being collected while simultaneously reducing the amount of data that needs to be stored.

    SysFlow encodes a representation of system activities into a compact format that records how applications interact with their environment, Araujo said, noting that level of context provides deeper visibility in everything from container workloads to cybersecurity forensics. However, unlike existing monitoring platforms, SysFlow doesn’t require IT organizations to collect a massive amount of data to achieve that goal—it is intended to provide for a superset of the NetFlow framework used to analyze network traffic patterns to capture system events, he said.

    Araujo noted IBM doesn’t envision SysFlow eliminating the need for legacy log analytics platforms, as they provide a way to analyze log data. However, SysFlow does enable IT organizations to apply analytics via a graph-like visualization to surface patterns that goes beyond a comparative simple rules-based approach, said Araujo. For example, SysFlow’s approach will make it easier to uncover the relationship between various events that make up a cybersecurity attack and subsequently to identify what countermeasures to employ to create the appropriate kill chain response. It also should substantially reduce the amount of fatigue cybersecurity teams experience from chasing down false-positive alerts, he said.

    SysFlow is designed from the ground up to integrate with both open source frameworks such as Apache Spark and commercial analytics platforms via an open serialization format and associated libraries. IT organizations also can leverage a set of reusable components and APIs to make it easier to deploy telemetry probes. IT organizations also can take advantage of an extensible policy engine that can ingest customizable security policies described in a declarative input language, which then can be checked against records captured by SysFlow.

    Araujo said IBM developed SysFlow to address the challenges associated with managing application workloads in public clouds, but the framework can be applied to any on-premises IT environment to create a single pane of glass through which multiple platforms can be monitored.

    Regardless of the platform on which a workload is deployed, Araujo said as more responsibility for managing and securing applications shifts left toward developers in the age of DevOps, those teams need access to more sophisticated tools that are readily available and simple to deploy. There are several open source initiatives underway to provide that visibility, and one day many of them might coalesce into a single initiative.

    In the meantime, as the dependencies between applications and IT infrastructure continue to increase, it’s clear IT monitoring as a core part of any set of best DevOps practices is now an absolute requirement to achieve and maintain observability.

    — Mike Vizard

  • Four Ways to Modernize Processes and Measure Performance With APM

    Four Ways to Modernize Processes and Measure Performance With APM

    Change is everywhere and the stakes are high. For 2019, businesses are on track to spend over a trillion dollars on digital modernization, according to a recent study from IDC.

    A crucial part of modernization is the growing number of IT organizations using the latest in dynamic, cloud-scale technologies to develop applications. As a result, technology professionals in the businesses you serve must now work with a much more complex and dynamically changing tech stack.

    When building and maintaining an app, it’s becoming even more common to have hundreds (or thousands) of pieces of code in containers being continually reconfigured and brought in and out of production. And many of these operations take place in customer-facing applications.

    The stakes are high, because if something goes wrong operations could halt. It’s therefore vital to understand the underlying technologies throughout an organization’s IT environment to better equip customers with the tools needed to be successful. Application performance management (APM) tools that simplify stack management, whether it’s on-premises, hybrid or fully cloud-native, provide a level of visibility needed for modern businesses—and they work across multiple cloud environments, such as AWS or Azure.

    As a channel partner, you need to be prepared to help your businesses and their customers through this modernization process. 

    Try the following to help your customers modernize business processes.

    Help Them Realize Software Is Now Business-Critical

    As IT departments move from on-prem infrastructure and a mix of commercial off-the-shelf (COTS) and monolithic custom applications to increasingly adopted cloud-based Kubernetes microservices applications, they’re accelerating the adoption of software at the core of all their business processes. The result? Business is increasingly dynamic and responsive—new applications are built and delivered to market faster than ever. But companies are also at risk now when things don’t go well—that strategic app could degrade or fail.

    All the tech layers underpinning these applications are also becoming more sophisticated, dynamic and interwoven—and making it still harder to administer as they continuously change at an even faster rate.

    Focus Your Customers on Core Competency

    There are plenty of open-source tools out there for your customers to use to build their own monitoring. The biggest obstacle for businesses rolling out their own apps while using an open-source tool is core competency. 

    If, for example, your customer is a wholesale plumbing supply company, is their competency sourcing plumbing supplies or knowing how to write instrumentation code for all their plumbing supply chain applications? Help them focus on what they’re good at and give them tools to manage the rest.

    Perhaps you have a large financial services customer who is spending tens of millions, across multiple years, on a team of outsourced experts to write precisely the code required. This is an extremely time-consuming and costly effort, but financial institutions do this because their needs are highly specific and mission-critical, and the cost of not doing it is even higher. 

    If you look at real-time high-frequency trading environments—where billions of dollars are moved in matters of tenths of a second—you come to understand the stakes justifying these herculean efforts. All of which supports the need for APM tools to help empower the tech pros in-house who monitor and manage these high-speed trading environments.

    At the other end of the spectrum are the small tech companies with a new idea they’re out to promote. But when it comes to most companies, their core competency is often not monitoring and managing their infrastructure and applications. It’s understanding the market requirements for their custom apps and getting those apps to market quickly. At the same time, organizations of all shapes and sizes are still confronting the reality that to successfully deliver modern applications we must shift from pure infrastructure performance metrics to the KPIs that best demonstrate end-user experience.

    Ultimately, many of the organizations described above have either focused on IT as a core competency or, in the absence of dedicated tech teams (at SMBs, in particular), they have outsourced management of their complex, dynamic tech stack and custom application builds. In both instances, APM tools are a necessity and it’s prime time for the channel to deliver those services.

    Be the Most Viable Modernization Partner

    By understanding the needs of modern organizations as they grapple with their complex tech stacks, you can ensure you have the right set of tools for your customers. 

    Provide full-stack capabilities for today’s businesses to manage their applications and keep operations running smoothly. Cater to unique business problems and equip your customers with APM tools based on their needs—advanced logging, trace metrics, performance optimization and full-stack visibility across applications and the compute infrastructure on-premises, hybrid and cloud. Help them check all their functional boxes.  

    Measure Performance with Full-Stack APM

    In all cases, your customers should be measuring performance. Because every company uses a mixture of digital technologies, arming them with full-stack APM will help gain visibility into performance throughout the business. With APM, businesses can see if their system is degrading—and fix it before disaster strikes. That’s the business value for APM—it gives visibility into the complexity underpinning today’s application environments. Full-stack APM provides this visibility, whether the apps are cloud-based, on-premises or hybrid.

    But here’s the reality—not all APM tools are the same. Traditional APM solutions weren’t built for the environment IT departments now have, with the addition of containers and microservices-based applications to their existing monolithic and n-tier/SOA applications. Those solutions were made to manage hundreds or thousands of objects with slower rates of change, not the tens of thousands, or even hundreds of thousands to millions of objects IT works with today.

    Also, note the ephemeralness of container-based microservice applications able to live and die in a matter of seconds or less. There’s no time to automatically install a traditional agent, let alone do so manually. The container’s life span is shorter than the time it would take to do such instrumentation. Direct them instead toward a full-stack APM solution with complete coverage of all application architectures: monolithic, n-tier/SOA and microservices based. With anything less, they’re running at a higher risk of brand damage and revenue impact.

    By being the experts on APM, providing full-stack visibility and measuring performance, your customers will find modernization success.

    — David Wagner
  • GitLab Open Sources Monitoring Tools

    GitLab Open Sources Monitoring Tools

    GitLab has decided to make its monitoring and observability tools available as part of its core open source platform to help reduce the total cost of DevOps. Previously, the tools were available as part of the commercial tools in GitLab’s DevOps platform.

    Kenny Johnston, director of product/Ops products for GitLab, said that as responsibility for observability shifts left, it is clear developers are now exercising more influence over which monitoring tools are employed. As developers begin to employ monitoring tools early in the application development process, most of them prefer open source tools because it’s unclear whether the application being developed will ever make it into a production environment, he said.

    However, if the application does make it into a production environment, it can be challenging for developers to make a case for standardizing on whatever monitoring tools they’re using in place of an existing commercial offering employed by an IT operations team. In addition to reducing costs, the GitLab approach could serve to eliminate any potential friction in the DevOps environment, as applications move from development into production environments.

    GitLab’s move to make its monitoring tools available as open source software comes at a time when more telemetry applications being employed to collect data are also based on open source software. In addition, developers of modern cloud-native applications based on containers are taking advantage of open source Prometheus monitoring software developed under the auspices of the Cloud Native Computing Foundation (CNCF) to monitor their applications. GitLab already provides integration with Prometheus.

    GitLab is also making it clear it expects its monitoring tools to benefit from the contributions of a larger pool of developers. Specifically, GitLab is calling for help in the areas of ongoing integrations with Prometheus along with improved logging, tracing and alerting capabilities.

    It’s not at all clear just yet to what degree DevOps teams will prefer to rely on open source versus commercial monitoring tools. While open source tools have some obvious advantages in terms of cost, many organizations have already standardized on commercial monitoring tools for a wide variety of existing applications. Open source tools often are more difficult to deploy and don’t tend to provide as much observability depth for IT operations teams. In addition, most of the providers of commercial monitoring tools are integrating their offerings with both open source telemetry software and Prometheus to bridge any divide that might occur between when an application is developed and deployed in a production environment.

    The one thing that is clear is a lot more individuals within the IT environments will be accessing these tools now that developers increasingly are being held accountable for the performance of their applications in production environments. In addition, modern applications require monitoring tools to make sense of all the dependencies that existing between microservices. Previously, IT operations teams tended to limit usage of monitoring tools based on commercial software to their most critical applications because of the costs involved. With the rise of open source monitoring tools, the opportunity to apply monitoring more broadly becomes more economically feasible.

    Regardless of the path forward chosen, the more visibility into IT environments provided, the easier it becomes to embrace best DevOps practices.

    — Mike Vizard