Category: Application Performance Management/Monitoring

  • ZenHub Brings More Science to Sprint Planning

    ZenHub Brings More Science to Sprint Planning

    ZenHub today revealed it has added a Planning Poker capability to its platform for managing software development projects that is designed to make it possible to prioritize sprints based on feedback collected from members of the application development team.

    That capability extends a sprint planning capability the company added this year to a project management application designed specifically for software development teams that employ the GitHub software repository. That sprint planning tool also automates routine tasks, such as automatically carrying over unfinished work to the next sprint.

    Aaron Upright, head of strategic accounts for ZenHub, said collectively, those capabilities will make it possible for development teams to prioritize their efforts in a way that is less biased using points that weight the opinions of team members based on how accurately they have made previous forecasts. For example, Planning Poker will assign a different weight to a developer that is consistently either overly optimistic or pessimistic about the length of time required to complete previous projects.

    Planning Poker is built right into GitHub, which Upright noted allows developers to make estimates without having to exit an environment where they already spend a good portion of their day.

    Thanks mainly to both an increase in and acceleration of the digital business transformation initiatives organizations have launched, DevOps teams are under increased time constraints.

    Many organizations’ entire business strategies now revolve around the rate at which software development projects can be completed. Many elements of those projects can’t go forward until a specific component upon which it depends is completed. Investors are holding business leaders more accountable for software delivery timetables that have direct implications on revenue generation.

    Not surprisingly, the type of end users that are now accessing project management applications to keep tabs on development progress has increased. Everyone from the sales team to the board of directors now wants more visibility into the rate at which software development projects are being completed. The challenge DevOps teams face is software development is an inexact science. Developers, based on individual personalities, exacting standards and willingness to work extra hours, are going to have widely divergent opinions on how long it may take to complete any given sprint.

    Nevertheless, Planning Poker presents organizations with an opportunity to rely on a more scientific approach than traditional guesswork, said Upright. The simple fact of the matter is that all estimates are wrong. The goal is to narrow the margin of error, he added.

    Regardless of how application development projects are managed, the relationship between DevOps teams and the rest of the organization has fundamentally changed. The entirety of some organizations is wholly dependent on the speed at which high-quality software is developed. In many cases, expectations are not realistically aligned with available development resources. A project management application that is widely employed across an organization should make that apparent to all interested stakeholders, which, in theory, at least, should result in either the hiring of additional developers or reassessment of the business strategy before the existing development team simply decides to abandon ship altogether.

  • Nobl9 Makes SLO Specification Open Source

    Nobl9 Makes SLO Specification Open Source

    During an online SLOconf event today, Nobl9 revealed that the platform it created to enable IT teams to achieve service level objectives (SLOs) is now available under an open source Apache license.

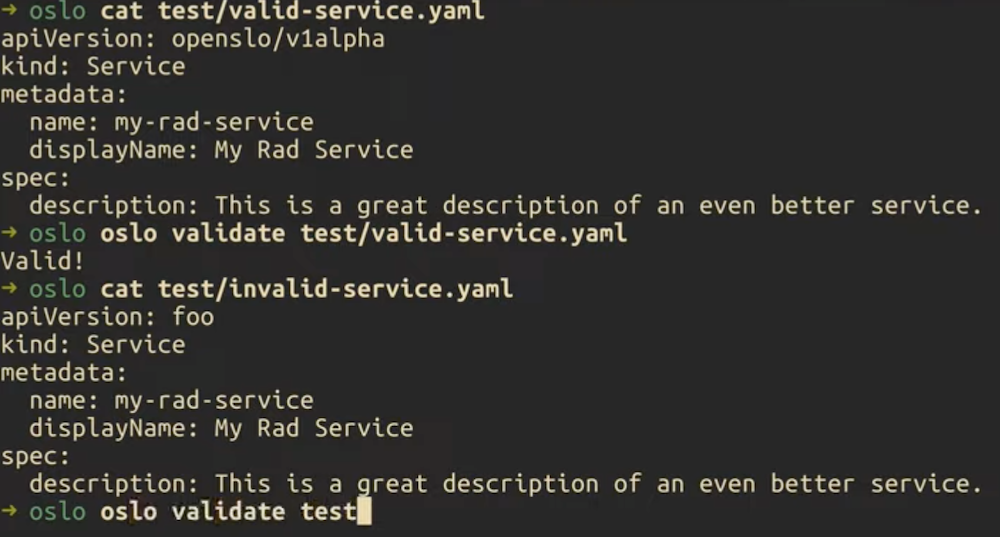
    Brian Singer, chief product officer for Nobl9, said the goal is to make a YAML specification format for defining SLOs that includes a parser and basic validation and testing capabilities more accessible via an OpenSLO project. Achieving that goal is critical at a time when organizations are deploying microservices-based applications that have dependencies that often adversely impact performance and availability.

    While the concept of an SLO and/or a service level agreement (SLA) has been around for a long time, IT teams that have embraced DevOps best practices by hiring site reliability engineers (SREs) are programmatically attempting to assure that SLOs are attained and, just as importantly, maintained, said Singer. Most SLAs have, historically, not been well-enforced. OpenSLO makes it possible to achieve that goal by embedding SLO objectives within a YAML file that become part of a Git-based workflow, he noted.

    SLOs

    Niall Richard Murphy, author of the book, Site Reliability Engineering, has signed on to be a core OpenSLO contributor working alongside committers from GitLab, Dynatrace and Nobl9. The ultimate goal is to make it simpler to share and migrate portable SLO specifications across multiple application development projects by constructing them using an object model, said Singer.

    Nobl9, meanwhile, will continue to operate a software-as-a-service (SaaS) platform for managing SLOs based on OpenSLO. Singer noted there will be an increased need for OpenSLO as it becomes more widely employed. The Nobl9 SLO platform is compatible with monitoring platforms such as Datadog, New Relic and Prometheus, and uses data collected from monitoring and observability platforms to calculate acceptable rates of error per service. It can be configured to trigger alerts and even workflows in anticipation of outages.

    Accessible via a CLI/GUI/API, the platform also enables DevOps teams to create business rules and define “facets” of users based on the application experiences required. DevOps teams can identify users who are being serviced poorly in addition to tracking groups of users. They also can associate contractual obligations to an SLO for a critical business period.

    The platform also makes it easier to determine how to make systems more reliable or lower reliability goals to reduce costs when possible. IT organizations will also spend much less time determining the root cause of any issue using a combination of real-time and historical data that is more accessible. Today, it’s not uncommon for IT teams to spend weeks looking for the source of an application degradation issue, only to discover the problem can be fixed in a matter of minutes.

    It’s still early days as far as adoption of SLO-as-code is concerned, but the days when SLAs or SLOs were, at best, aspirational statements of intent are coming to an end. The expectation is SLOs will soon be maintained via YAML files embedded within application code and distributed across a rapidly expanding enterprise with more interdependencies than any IT team can manually track.

  • Perforce Acquires 21 Labs to Advance Mobile App Testing

    Perforce Acquires 21 Labs to Advance Mobile App Testing

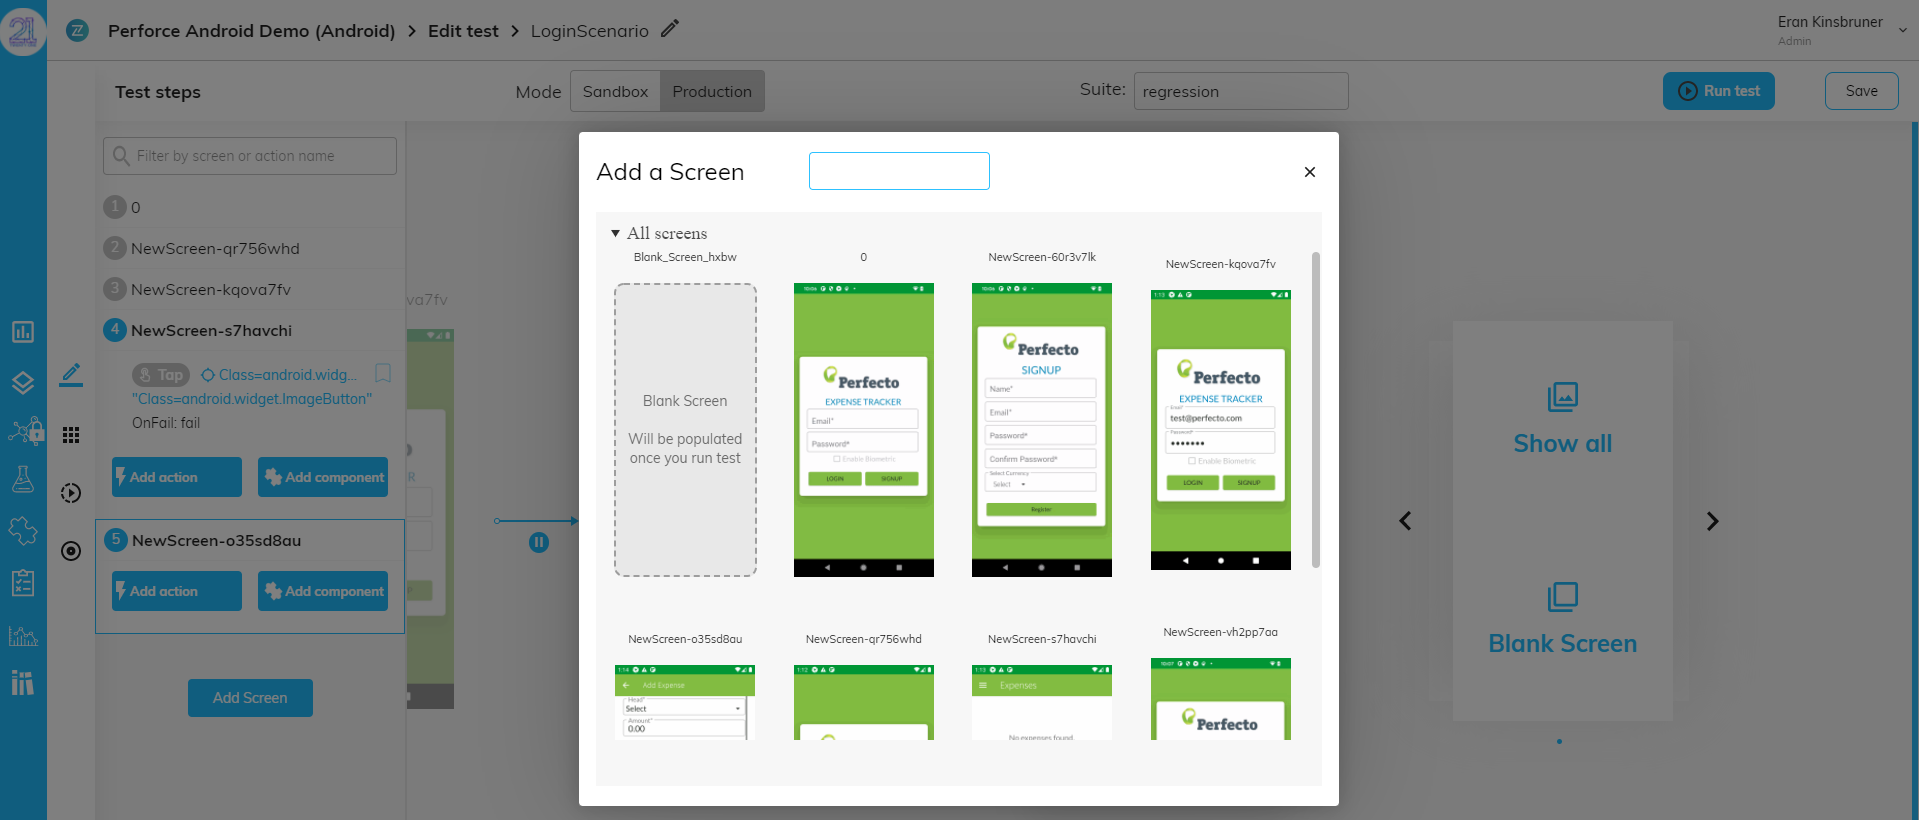
    Perforce Software announced today is has acquired 21 Labs, a provider of a suite of tools that leverages artificial intelligence (AI) to provide a no-code approach to testing mobile applications. Terms of the deal were not disclosed.

    Tim Russell, chief product officer for Perforce Software, said the 21 Labs tools complement a set of similar AI-based tools for testing web applications that the company makes available via its Perfecto portfolio. The company also makes available Virtual Devices, a service that makes it feasible to test mobile computing devices at scale using Apple iOS and Google Android emulation software. Perforce acquired Perfecto in 2018.

    21 Labs developed a test automation platform that uses algorithms to observe interactions within a mobile application that are then used to generate tests. That approach sharply reduces the need for a developer or professional application developer to employ scripts to generate those tests, said Russell.

    The next step will be to integrate 21 Labs with the test recommendation engine that Perforce already makes available via its Perfecto testing platform, added Russell.

    Perforce

    As the rate at which applications are developed accelerates, Russell noted, application testing has become a major bottleneck. The shift toward scriptless approaches to application testing will make it possible for organizations to quickly vet applications to ensure quality without having to slow down the rate at which they are being deployed. That’s especially critical at a time when mobile applications are often at the core of any digital business transformation initiative.

    It’s not clear to what degree application testing will be automated, but it’s apparent that as AI becomes more advanced, the need for many of the routine tests conducted by professional developers today will be eliminated. In theory, that should afford professional developers more time to conduct complex tests, while more routine tests are automatically run as an extension of a DevOps workflow.

    Application testing, of course, has always been the first thing to suffer whenever developers are pressed for time to make a delivery deadline. However, the sooner any issue is discovered, the less expensive it generally is to fix. At the same time, end users are not generally patient when it comes to mobile applications that don’t work as advertised. External-facing mobile applications, especially, need to provide a compelling experience the first time they are fired up. At the same time, internal digital business processes that are accessed by end users and business partners now need to be accessible from anywhere.

    Arguably, it’s harder to provide a great application experience on mobile computing devices than it is on a desktop platform, which means there should be even more testing of mobile applications before they are deployed in a production environment. The days when developers experimented on end users by rolling out minimally viable applications are coming to an end, as end user expectations continue to rise. DevOps teams that don’t adjust to that new reality may soon discover just how critical testing has become to their own job security.

  • Cloud Governance Can Trim Cloud Costs

    Cloud Governance Can Trim Cloud Costs

    The abrupt need to transition to remote work last year caused many companies to migrate to the cloud or accelerate an in-process migration. Cloud has become an essential part of company operations and budgets. Last year, worldwide end user spending on public cloud services was $257.5 billion, making up 9.1% of total global enterprise IT spending, and it’s forecasted to increase to 14.2% by 2024, according to Gartner.

    Upfront Cloud Costs

    The allure of cloud for organizations is its potential to save money, increase agility and offer easier scalability. However, these promises don’t materialize without proper management. Organizations will likely see an initial rise in costs with cloud adoption. Organizations spend, on average, 12% more running a workload in IaaS (infrastructure-as-a-service) compared to when it happens in their own data center. These cost increases occur when work is lifted and shifted without modification.

    Like any change, there will be upfront costs involved with the process of migrating to the cloud that need to be considered. With careful planning, organizations can avoid surprises. Items that need to be factored in when budgeting include the cost of cloud infrastructure, labor costs associated with migrating applications to the cloud, and the monthly bill from cloud providers. Many cloud providers provide cost calculators to help organizations determine what to expect when migrating to the cloud.

    Managing Cost

    A factor that is key to managing cloud costs is planning for the monthly cloud bill. Without proper monitoring, this is where overspend can occur—57% of IT leaders have exceeded their cloud budgets at some point, according to a 2018 Softchoice survey. One of the issues is the lack of visibility that leaders have into their cloud costs. A lag in your cloud billing data makes it difficult to make accurate decisions, which can be the case with spend reports from cloud providers that are 12 to 24 hours old.

    A lack of timely visibility into current costs and the inability to forecast future costs leads to cost overruns and blown budgets, which is why having a product that provides the most up-to-date information and monitors your budget is important. There is no use in budgeting if it’s not being monitored. Let me repeat: an unmonitored budget is useless.

    Timely visibility and monitoring your budget fall under financial control of your cloud—one of the three pillars of cloud governance. Cloud governance includes the development and implementation of budget controls, as well as controls to manage access and ensure ongoing compliance.. A cloud management product can help with this by not only keeping your budget under control and alerting you before you go over that budget, but also by finding saving opportunities through ongoing optimization.

    Using these tools means you can automatically find out about ways to save your organization money.

    The other two pillars of cloud governance, managing access and ensuring compliance, also impact your overall cost in the cloud. A robust governance and management solution establishes proactive protocols that can automate tasks such as account setup and ensuring compliance with your security standards. Automating controls will save your organization time and money. Monitoring and ensuring that your cloud is secure will help you avoid costly security breaches. When adopting the cloud, a plan for implementing cloud governance should be at the forefront to help you realize the cost savings of cloud.

    Despite the initial costs of scaling to the cloud, in the long term, cloud adoption does result in cost savings. Once organizations move away from managing on-premises data centers and implement cloud governance in their cloud environment, that’s when opportunities for innovation can happen due to time and money being saved. For example, when Riso, a printer and digital copier manufacturer, migrated to AWS, the company cut its total IT operational costs by 55%. Avery Dennison, a manufacturing company that specializes in labeling, saw an annual run rate savings of $5 million due to investing in cloud-first initiatives. These are just some examples of how the cloud has helped companies optimize their costs. It can be possible for your organization to reap similar benefits with proper planning and the implementation of cloud governance.

  • Why QA and Monitoring Need to Merge

    Why QA and Monitoring Need to Merge

    Customer expectations for speed and reliability have upended the software development life cycle. Whereas developers used to develop a product and send it to quality assurance engineers for testing before widespread release, customers now demand new versions and features on a quicker timeline. In an era with little available time to run QA in the traditional development process, what’s the alternative?

    Fortunately, modern automated infrastructure provides a solution. Infrastructure-as-code (IaC) toolchains that deliver continuous observability with AIOps let SRE teams overlook the entire process, from the first piece of code through the software product’s public release.

    This merger of the traditional roles of QA and monitoring is enabling quicker speeds within the delivery cycle, a development that improves the customer experience but also ignites business innovation.

    The Benefits of Speed in the SDLC

    Observability delivers the data necessary to eliminate traditional QA, but teams still need help. With intelligent observability — where you apply AI to the data — teams can better focus their efforts and analyze information much more quickly.

    Finding and fixing software issues after deployment unnecessarily stresses SRE teams. But through observability with AIOps, DevOps practitioners and SREs monitor from early development through daily performance. QA is omnipresent. Teams can identify root causes of issues instantly, and AI surfaces the most actionable steps to quickly resolve impacts on the infrastructure.

    The DevOps team used to leave QA engineers with the tedious and time-consuming task of pinpointing issues amid a sea of data, creating a bottleneck within the development process. The continuous learning and intelligent collaboration approach, on the other hand, merges traditional QA and monitoring and yields a CI/CD pipeline that actually works.

    Integrating observability with AI into the development cycle allows teams to spot change almost instantly. If the platform starts acting oddly after its release, SREs and DevOps practitioners can jump in immediately without the need to wait for a QA team. If the issue is where a change in performance is expected, AI and machine learning often still can reduce what’s needed from your teams. If, for instance, you’re monitoring with an adaptive thresholding algorithm, you can let the algorithm retrain and learn the new behavior instead of relying on the DevOps team to communicate the expected change in performance to the QA team.

    As QA shifts left – as evidenced by the growth of software development engineers in test (SDET) – it’s natural that monitoring and assurance capabilities should shift left, too.

    A Principled Approach to QA

    The merger of quality assurance and monitoring throughout the software development cycle follows the three guiding principles behind DevOps practices.

    • Flow/system thinking. The approach eliminates workflow silos and instead creates a holistic view of the development process. The continuous oversight negates typical quality hazards, such as the handoff that can occur despite a known issue or the optimization for local efficiency only.
    • Amplifying feedback loops. A merging of QA and monitoring eliminates the need to loop feedback through multiple teams with various processes because teams are given consistent feedback throughout software development and delivery.
    • A culture of continual experimentation and learning. DevOps teams, no longer in a position to just pass software down the line to QA, will build constant improvement into their processes as they learn from bugs along the way. This also provides more opportunity to take risks and experiment. The approach is a more holistic product cycle versus quick development.

    Improving the Q in QA

    Removing QA as a singular step in the software development process initially may seem like removing quality assurance itself. But QA is actually heightened by integrating observability with AIOps into the development cycle.

    Observability with AIOps allows teams to see into systems as they are being built but also allows them to gain actionable insights to resolve issues on the overall structure. Actionable insights empower the merging of traditional QA and monitoring to drive a whole new speed of delivery, which yields better customer experiences and gives businesses the ability to quickly launch competitive, innovative services.

  • Empowering BizDevOps Teams With SLOs

    Empowering BizDevOps Teams With SLOs

    When BizDevOps teams are drowning in logs and false alerts and are spending more time on manual processes than on building and deploying new applications and features, the work suffers, morale suffers and the organization as a whole suffers. Releasing better and more secure software, faster and with real business impacts starts with a robust BizDevOps practice. A crucial step IT leaders can take to align the developer, operations and business teams is to create a shared language of service-level objectives (SLOs).

    SLOs are metrics for validating that software is meeting its technical and business objectives. Defining and implementing SLOs help align developer, operations and business teams, not only ensuring everyone is moving toward the same goals, but also providing a way to reliably measure how BizDevOps teams are progressing toward these goals.

    Here are three of the most impactful ways SLOs can empower your BizDevOps teams.

    1. Establish a Common Language Across the Delivery Cycle

    The best SLO gives you precise and actionable insight into your system. Take performance and resiliency engineering, for example. By defining SLOs for performance and error rates, teams can use common measurements to track progress toward meeting their quality criteria to ensure they are staying within their error budget.

    In this way, teams can use SLOs as a common language across the delivery cycle – something everyone from developers to operations to business teams can rally around, ensuring everyone is working toward the same outcomes. This aligns teams into a coordinated BizDevOps practice, where all sides have better insight into how each piece of the business feeds into the others. If an incident occurs, operations can use an AI-based observability platform to observe its trends and impacts across different product or service releases and automatically feed that information back to the developers, who can modify their builds accordingly. When everyone is using the same SLOs to speak the same language, BizDevOps teams can coordinate and communicate more easily and effectively.

    2. Creating a Culture of DevOps Resiliency by Shifting SLOs Left

    BizDevOps isn’t just a technical practice defined by tools and platforms. It’s also a culture change and a shift in mindset. SLOs can play a major part in this change. Shifting SLOs left into the delivery pipeline means giving developers feedback about the outcome of their work and real-time visibility into their business KPIs using consistent SLO measurements – ideally, on every code commit. This consistency gives them answers at their fingertips to make data-backed decisions that consistently deliver better business outcomes. Using SLOs for developer feedback is a fundamental building block of DevOps, but it’s also key to creating a culture and mindset of resiliency within BizDevOps.

    A resilient BizDevOps culture is more than just making changes to your technology stack; it’s about changing the mindsets of individual engineers and developers. Resiliency means strength and reliability; the trust that when something goes down, it’ll go right back up. It’s about building the processes and systems that guarantee flexibility for anything from managing crisis events to delivering service continuity. Shifting SLOs left helps facilitate this culture change by giving developers greater exposure to the impact their work has when it’s in production and when it’s deployed. It makes everyone feel they’re in the same boat, and recognizes developers, operations and the business teams as one cohesive unit.

    3. Integrating SLOs Into Remediation

    BizDevOps teams can use SLOs to enhance remediation and incident response efforts. With everyone working with the same metrics, BizDevOps knows with certainty when something is broken, can identify root causes more quickly and can develop agreed-upon incident responses to accelerate time to resolution. BizDevOps teams can then feed this incident response knowledge back into quality gates earlier in the development cycle to avoid future problems. This develops SLOs that have been “battle tested” and can be easily automated to make quality gate testing better on the development side, and incident response better and faster for the operations side.

    SLOs bridge the gaps between BizDevOps

    SLOs already serve a useful role in production, but they also can influence the ability to create a robust, resilient BizDevOps practice. Shifting SLOs closer to developers and using them as a shared language across the delivery cycle provides space for greater experimentation, more innovation and a culture of resiliency. SLOs can also be defined along business-relevant metrics, such as conversion rates, user experience or feature adoption. As a result, SLOs empower BizDevOps teams to respond more quickly to issues and deliver better digital experiences and business outcomes.

    SLOs aren’t just performance metrics – they’re a powerful tool for bridging the divides between the developer, operations, and business teams. SLOs can help cultivate a BizDevOps culture that delivers innovative, secure software faster and with tangible business value.

  • What Data Catalogs Don’t Reveal

    What Data Catalogs Don’t Reveal

    In today’s data intensive world, data catalogs, as the name implies, are simply catalogs of information (some human-entered and some extracted from metadata in systems). The importance of data in the enterprise has grown, and analytics plays an increasingly important role in generating value. So, while it’s important to collect and store and organize all this data, data catalogs are missing a major piece of the puzzle – they fail to draw accurate relationships between data assets and how they relate to (or are calculated from) each other.

    It is like having a catalog that contains a description of all the electronics components in the world, but without an understanding of how to assemble those components into a clock, a radio or even a computer. Or how to diagnose what needs replacing when the device stops working.

    Data catalogs cannot answer a whole host of questions along the lines of, “What are the consequences if I make a change to this dataset?” Even if the information in the data catalog is religiously updated, if a change was, in fact, made, users impacted by that change, whether directly and indirectly, have no way of knowing that a change was made. As a result, risk of unidentified issues is high.

    The table below summarizes the strengths and weaknesses of traditional data catalog products.

    Issue

    Data Catalog Strengths

    Data Catalog Weaknesses

    Data Discovery

    • Collect metadata information from a wide variety of systems
    • Give users flexibility to manually update information
    • Simplify searching for data assets across a wide variety of systems
    • Make it easy to identify the subject matter expert (SME) related to a dataset
    • Rely on manually maintained documentation
    • Do not automatically relate data sets to each other
    • Do not understand how data assets are calculated from each other
    • Fail to identify who uses a particular dataset (and how they use it)

    Data Governance

    • Provide a robust framework for managing the availability, usability, integrity and security of the data
    • Rely on manually maintained user-defined rules for dictating data access
    • Cannot automatically propagate access rules from one dataset to antecedent datasets

    Infosec Compliance

    • Make it easy for users to label personally identifiable information (PII) and other infosec risk data sets
    • Do not automatically infer the implications of data processing on the movement of PII inside the enterprise

    Data Quality

    • Data catalogs do not actually inspect data – so they do not assist with data quality issues
    • Complete failure to identify issues and communicate who those issues impact downstream from a data quality issue


    Data Discovery

    Data catalog solutions provide powerful frameworks for collecting metadata and facilitating documentation of datasets. The collection and aggregation of metadata is automated, and data engineers/analysts are, hopefully (but rarely), compliant in documenting their work so others can leverage it.

    Unfortunately, data catalogs fail to identify how datasets and processing rely on each other. There is no way to reliably identify which users access and rely on particular datasets, both directly and indirectly.

    Tasked with this objective, a data engineer can manually answer these questions by searching and analyzing the relevant data processing code. This approach uses expensive data engineering resources, takes time and results in reduced analyst and data engineering productivity.

    Data Governance

    When new data sets are created, the authors must tag the data to control data governance. Not only does this rely on compliance from the author, but the rules must be propagated to determine who can use the newly processed data. How should the rules be propagated? This is a complex issue. For example, the city in an address may be restricted, but aggregates across that city may not be. Defining these rules, in and of themselves, is complex — applying them is even more complex.

    Reliance on data engineers and analysts to comply with data governance documentation and systems for enforcement is error-prone and expensive. Sensitive datasets are at high risk of being exposed.

    Infosec Compliance

    Current solutions to information security compliance rely on:

    • Users manually documenting if their data processing activities use (or produce) infosec-sensitive data.
    • Automated identification of infosec-sensitive data by inspecting the actual data and using algorithms to identify how the data needs to be secured.

    Data catalogs are used to facilitate user documentation of data processing activities to comply with infosec compliance requirements. This process relies on humans manually maintaining documentation and systems (and performing actual data inspection.) These processes present significant security risks in and of themselves, because both data inspection – which itself presents a risk – and skilled manual work is required.

    Data Quality

    Data engineering already has processes to identify when there is an issue landing data in a table. Automated systems are available that inspect data values and make intelligent decisions (some even based on machine learning) about whether or not the data is acceptable. These systems exist outside of traditional data catalogs.

    The question is, who will that problem impact? You must identify who are the immediate users of the data. You must also identify the indirect users of the poor-quality data.

    The current approach to this problem is to have skilled data engineers review all data processing code and manually identify users to warn – this is both expensive and time consuming. Beyond this, the risk is that a user is not identified; what if the error impacts a report that lands on the CFO’s desk and they are not warned?

    Data catalog solutions are good at solving the problem for which they were initially designed – finding datasets that are of interest to data engineers and data analysts.

    The risk in DevOps is that data catalogs are relied upon for data discovery, data governance, infosec compliance and data quality issues that they fail to address in today’s complex data processing environments.

  • Consider Telemetry When Rearchitecting Applications

    Consider Telemetry When Rearchitecting Applications

    Australia and New Zealand have seen a big move to the public cloud, and “… when I talk to customers, I see huge interest in rearchitecting applications rather than doing a lift-and-shift right into public cloud,” said Scott van Kalken, F5 ANZ solution architect for DevOps and modern applications.

    That migration to the public cloud has led to massive interest in telemetry. When you go from a monolithic application to a distributed app, there may be 100 or even 1,000 APIs involved. Without telemetry, you don’t know what’s going on with those APIs. But the telemetry needs to be consistent.

    F5’s 2021 State of Application Strategy report found 75% of respondents considered telemetry, especially about application security and delivery, important for meeting business outcomes, and 95% of respondents said they are missing insights from their existing monitoring and analytics solutions.

    Van Kalken recounted a conversation with a practitioner as an example. This practitioner gets yelled at when problems arise with partner APIs used by the application he manages. So, even though these APIs are not technically his responsibility, he needs visibility into their status. Only by combining internal telemetry with telemetry from these partner APIs can he make sense of what’s happening within the application ecosystem.

    And it’s not just a question of whether an API is available or not. Problems can arise when it is responding slowly. “‘Is that normal? Is that normal for this time of day?’ I’ve got to have some sort of telemetry data available to me to make decisions,” van Kalken said.

    Enabling Security Automation with Telemetry

    An aspect that’s particularly interesting to him is the ability to automate or otherwise take action based on security telemetry data.

    A simple example is a security event that reveals some kind of systems abuse. Automation can add a firewall rule to block the associated traffic.

    As organizations increasingly adopt event-driven architectures, events and responses occur at the application, network, infrastructure and other levels. “The minute that you automate those event-driven architectures with security, it opens up a world of possibilities.”

    It’s not just about automating security. Imagine an API gateway that serves a variety of APIs to customers. Telemetry might reveal that two of the APIs are starting to slow down; in which case, “I might kick off a workflow that just deploys more of them so that we can handle the load. But if you don’t have that telemetry, you can’t do that,” he said.

    In practice, this involves telemetry, analytics and automation.

    “When we show [customers] how you can make use of the analytics in a really easy way, their eyes light up,” van Kalken said.

    Multi-Cloud Migration

    A further consideration is that rearchitecting applications isn’t just about splitting monoliths into smaller pieces and redeploying them as microservices. There’s also a desire to run them across multiple public clouds to reduce risk, and also to deploy applications at the edge where they are closer to their users.

    The 2021 State of Application Strategy reported that just over three-quarters of respondents are already using or have plans to use the edge to capture benefits related to application deployment, performance and data availability.

    “This is really important, because as an application developer, I want to deploy my application once and I want to say, ‘I want this distributed to all of these places around the globe’,” van Kalken said.

    But if the application is deployed in, say, five locations, then from a telemetry perspective, it is five applications, not one.

    “I’ve got five sets of telemetry, because I’ve effectively got five different applications deployed out there. It’s the same app, but it’s in five locations, and the consumers are different in every location; the way that they interact is different and the telemetry that I’m getting is going to be different,” he said. “So, I need to actually suck up all of that telemetry, and make it meaningful in some way,” he explained.

    Telemetry Enables Clearer Vision

    “A distributed cloud architecture is right for these modern applications. We recently bought a company called Volterra, and this is one of the areas that they play in — distributed applications, and specifically, abstracting multi-cloud and multi-cluster Kubernetes application deployments,” he said. This area of focus will be critical in the future, van Kalken said.

    He predicts that as organizations move to 5G, applications will become increasingly distributed. If that does happen, it will be extremely important to receive telemetry from all components of the application so it can be analyzed and used to support intelligent decisions, as part of the distributed application deployment.

  • OpsRamp Extends AIOps Reach to Embrace Prometheus

    OpsRamp Extends AIOps Reach to Embrace Prometheus

    OpsRamp today announced it has added the ability to ingest data captured via the open source Prometheus monitoring software into its namesake IT operations platform infused with machine learning algorithms.

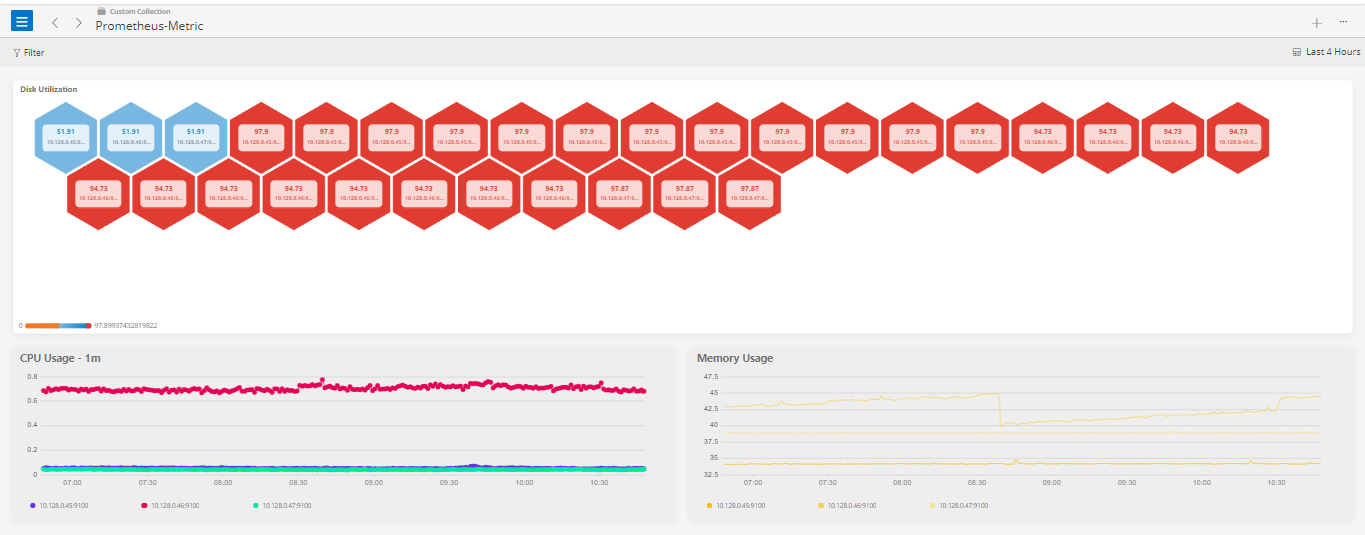
    In addition, the company is adding support for customizable dashboards using the Prometheus Query Language to create visualizations of hybrid infrastructure performance. Also, a set of available tools makes it easier for IT teams to discover when workloads have been added to a cloud. These capabilities became available with the Spring 2021 Release of OpsRamp’s IT operations platform infused with artificial intelligence (AIOps).

    Finally, OpsRamp has also created an alert definition model that streamlines the alerts generated by the AIOps platform and its integrations for the Microsoft Azure cloud and the Cisco HyperFlex platform deployed in on-premises IT environments.

    Deepak Jannu, senior director of product marketing for OpsRamp, said that as IT becomes more complex to manage, many IT teams are starting to realize that managing these environments without help from an AIOps platform won’t be possible. As such, much of the fear and loathing that was initially associated with AIOps is giving way to acceptance as IT teams start to realize these platforms augment their capabilities versus replace them, added Jannu.

    Much of the complexity is being driven by the rise of cloud-native, microservices-based applications that tend to have lots of dependencies. OpsRamp has primarily been encountering Prometheus in these environments. However, Prometheus can also collect data from legacy applications, as well, so over time, the expectation is the open source monitoring tool will be employed more widely.

    As AIOps platforms become more widely employed, there is no doubt job roles within IT organizations will change. As lower-level tasks become automated, IT teams should have more time to spend resolving complex issues once the AIOps platform has identified a baseline for how applications should optimally behave. In many cases, the need for personnel to perform rote tasks that no one in IT wants to actually do will be eliminated altogether.

    DevOps teams that are committed to automating IT tasks will naturally be among the first to employ an AIOps platform to augment the capabilities of site reliability engineers (SREs) that are often challenging to hire and retain.

    In general, Jannu noted that the observability that many IT organizations now demand can’t be achieved by simply collecting more metrics. IT organizations will need to invest in an AIOps platform capable of making sense of all the instrumentation data being collected. The challenge now will be defining the right division of labor between man and machine in an IT environment, Jannu added.

    At this juncture, AIOps, to one degree or another, is inevitable. In many cases, machine learning algorithms are already being employed to optimize applications or a specific class of hardware. The decision IT teams will ultimately need to make is determining whether to replace their existing IT operations platform or wait for the provider of their existing platform to get around to adding AI capabilities.

  • ServiceNow Acquires Lightstep to Gain Observability Platform

    ServiceNow Acquires Lightstep to Gain Observability Platform

    ServiceNow today announced it has acquired Lightstep as part of an effort to add an observability platform to its IT operations portfolio. Terms of the deal, expected to close this quarter, were not disclosed.

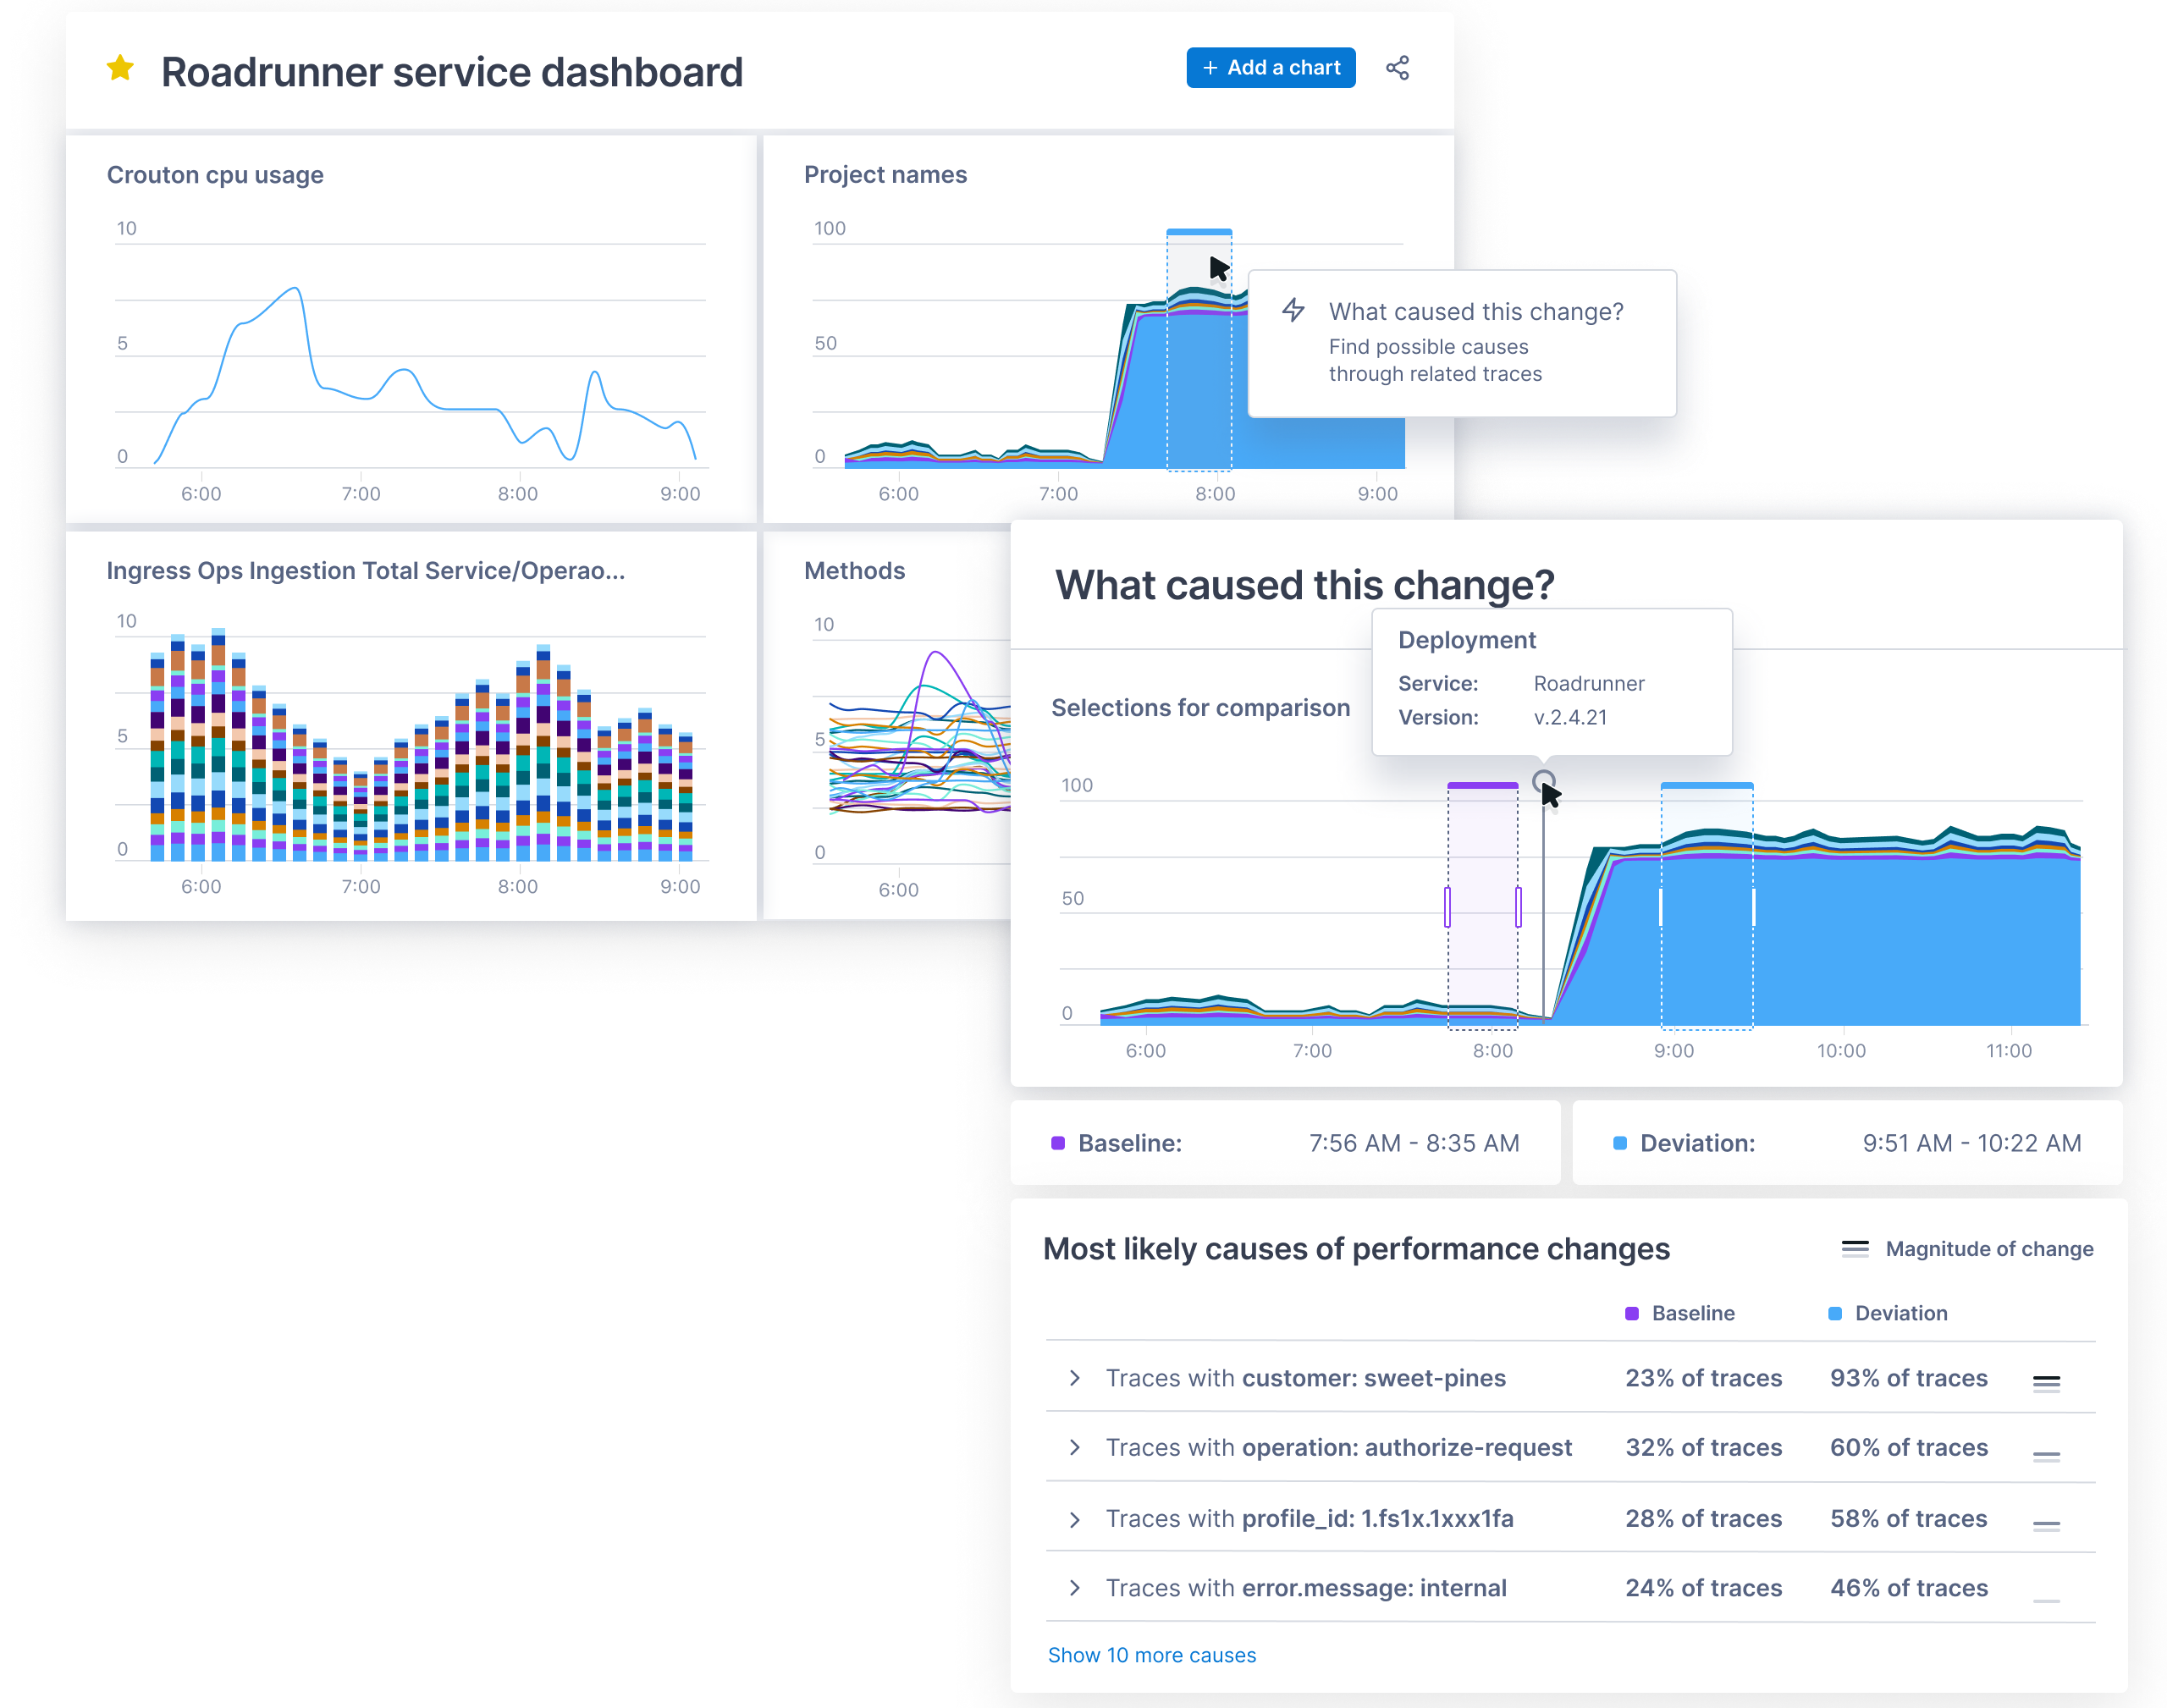
    The Change Intelligence observability platform from Lightstep is based on a time-series database that is capable of processing a trillion events each day. It was built by the same team that created Monarch, the globally distributed in-memory time series database system that Google employs to monitor its applications and systems. Lightstep team members also co-created both the OpenTracing and OpenTelemetry open source projects for collecting traces, metrics and logs.

    Pablo Stern, senior vice president and general manager for IT workflow products at ServiceNow, said ServiceNow will employ Lightstep to enable IT organizations to observe both monolithic and microservices-based applications as IT operations and DevOps teams continue to collaborate more closely with one another. The goal is to provide a single pane of glass through which IT teams can observe their entire IT environment via the Now platform that ServiceNow makes available via a software-as-service (SaaS) delivery model.

    That approach will enable DevOps teams to programmatically manage IT environments alongside IT administrators employing graphical tools, noted Stern.

    Lightstep CEO Ben Sigelman added that, in time, the number of users of that observability will only increase as more application stakeholders start to track software development projects that are at the heart of various digital business transformation initiatives.

    ServiceNow

    Thanks mainly to the rise of microservices that are now being deployed across highly distributed computing environments, it’s become more difficult to discover the root cause of an IT issue. Microservices-based applications have lots of dependencies that, while serving to make the overall application more resilient, conspire to make it difficult to determine which specific microservices might be adversely impacting the performance of an application.

    The time-series database that lies underneath the Change Intelligence observability platform makes it feasible to go beyond logs and metrics to process distributed traces that provide more insight into application behavior. Ultimately, the goal is to enable organizations to innovate faster with a higher degree of confidence in the IT environment, said Sigelman.

    As far as the march to observability in the enterprise is concerned, it’s still early days. While observability may be a core tenet of any DevOps practice, most IT organizations rely on myriad tools that surface data the teams then attempt to correlate. Whenever there is a major issue, those IT teams typically convene in a “war room” to compare reports generated by the various IT monitoring tools employed. Observability platforms that collect and process distributed traces used to instrument an application using a consistent set of specifications, frameworks and libraries. The OpenTracing and OpenTelemetry tools are significant because they provide an open source approach to instrumenting applications that reduces the total cost of observability. In comparison, many legacy application performance management (APM) platforms employ proprietary agents to instrument applications.

    Naturally, each IT organizations will be moving down the path toward an observability platform that provides greater application context. At this point, however, it’s not clear to what degree observability platforms will need to be installed before making the transition to microservices versus being a capability that only gets appreciated once the trouble with microservices finally becomes apparent.