Tag: tools

  • Why the DevOps Trinity is Key for Digital Transformation

    Why the DevOps Trinity is Key for Digital Transformation

    As digital technology continues to disrupt and transform businesses across industries and around the world, the ability to deliver high-quality software rapidly will make the difference between survival and extinction for many companies. DevOps seeks to change the dynamics in which operations and development teams interact. Ultimately, successful adoption of DevOps and the process of continuous delivery are likely to determine whether an organization thrives or fails in the digital age.

    To build a sustainable DevOps culture and achieve true DevOps success, organizations need to consider the DevOps Trinity—people, processes and tools—and understand how to connect all three:

    People and Culture

    The core tenet of DevOps is a culture of collaboration and shared goals, which eliminates finger-pointing and promotes teamwork, with everyone working together in support of the same outcome—reliable software quickly delivered to production. In essence, the goal is to enable the different stakeholders in the software development and delivery process to reach the mutual understanding and empathy needed to drive alignment on shared goals. To achieve this change, teams need to have trust, honesty and responsibility.

    Process and Practices

    DevOps aims to achieve predictable, efficient, secure and sustainable operational processes. Using a DevOps approach, simple processes become increasingly programmable and dynamic. Automation supports this objective by using technology to streamline the steps within the process.

    Tools and Technologies

    Some categories are more essential in a DevOps toolchain than others, especially continuous integration (build) and infrastructure as code (configure) tools. The common elements of the toolchain include applications for coding, building, testing, packaging, releasing, configuring and monitoring. Often, rather than a single tool, there are sets of tools (or toolchains) of multiple tools, that make up the process.

    A sustainable DevOps organization cannot be achieved without all three components of the DevOps Trinity.

    For those looking to learn more about people, processes and technology needed for successful DevOps implementation, join us in San Francisco Sept. 16-19 for DevOps World | Jenkins World. With this year’s conference theme “TRANSFORM,” attendees will learn how organizations are transforming software delivery, adopting DevOps and returning business value to their organization from DevOps initiatives.

    Don’t miss Viktor at DevOps World | Jenkins World! Be sure to register today for 20 percent off your registration using the special devopsy.kinsta.cloud code just for our readers: JWDEVOPSCUST

    — Viktor Farcic

  • Choosing the Right Monitoring Tools for a Full-Stack Solution

    Choosing the Right Monitoring Tools for a Full-Stack Solution

    According to the marketsandmarkets report on APM tools, the monitoring tools market is expected to grow to $4.98 billion by 2019, at a CAGR of 12.86 percent and the DevOps market would attain market size of $8,763.8 million by 2023, growing at a CAGR of 18 percent during 2017 -2023 (source: markets business insider), with more focus on monitoring and performance management, delivery and operations management, lifecycle management, analytics and other solutions.

    Selection Criteria for Full Stack Monitoring Tools

    With the amount of DevOps tools and new tools coming up in the market, it is highly essential to choose the right tool for the right need before investing in it and expecting the desired outcomes. One has to make several considerations and analysis in choosing the right tool for the need. The monitoring tool you select should be capable of doing full stack end-to-end monitoring and should enable faster troubleshooting and quick remediation.

    Following are some of the key criteria that can be used as factors for the monitoring tools analysis.

    Monitoring Features

    The mix of platforms, operating systems, devices and applications can be extremely diverse in the enterprise, which needs monitoring of infrastructure, platforms, cloud environments, application performance, network monitoring, orchestrations, containers, databases, end user monitoring, covering heterogeneous workloads and its performance. Check out what features are supported in the monitoring tools which suits the need.

    Infrastructure Monitoring

    The infrastructure monitoring tools should measure response time, availability, uptime, CPU usage, memory usage, disk usage, process level usage and load of the servers, components, storage, databases, virtual systems, network switches, security, user permissions, performance and throughput on the application and web servers, DB level queries and DB transactions, latency, transfer rate, connection time of databases, and provide time series data of the measurements, aggregation of data with process level drill down and history of trends. Tools that can do infrastructure monitoring should be able to provide most of the above mentioned measurements.

    Network Monitoring

    Network monitoring tools should provide performance metrics such as bandwidth, latency, responsiveness, different port level metrics, network packets flow, CPU usage of hosts and provide custom metrics and aggregation of these metrics. Network monitoring tools need a comprehensive platform that works across varied network topology (heterogeneous networks (wired/wireless), cloud-based networks and software defined networks). Choose the tools that are capable of auto discovery of nodes, devices, routers, firewall rules, ports and protocols, automatic rules, thresholds and alerts, and which are application-aware, that can detect the applications, services in the network with network path, network flow analysis and provide graphs/tables about network status to determine if the performance problem arises from network or application itself, and can generate network topology map.

    Containers Monitoring

    Monitoring containers/micro services include capturing container level states on CPU usage, memory, network, disk usage, processes running inside the containers, as well as usage of containers hosts, container level logs, containers running/stopped, orchestration level metrics on pods states, cluster stats, container networks, application endpoints at container level, pod level, and system level, performance metrics at container levels as well as services running in it, etc. Containers run in clusters and monitoring ephemeral container workloads are necessary in production; choose tools that provide the above capabilities for container monitoring beyond the out-of-box monitoring data provided by the container orchestrators.

    Application Performance Monitoring

    Application performance monitoring is a key component in full-stack monitoring, where logs are collected and centralized with profiling and tracing available on the application and its dependencies, provides measurements on performance such as end user response time, availability, throughput, error rate, page loads, slow pages, error occurrences, any third-party JavaScript slowness, browser speed, track SLAs, page bloats, distribution of customer base across geographical areas, checks for end user transactions and simulate end user actions with synthetic transactions and provide detailed drill down and correlation data from end user experience, providing full visibility across the application stack. Choose APM tools that cover the profiling, tracing, end user experience monitoring, log monitoring and log analytics, providing data correlation with drill-down capability on transactions and full-stack visibility, at a minimum.

    Cloud Monitoring

    Cloud providers offer monitoring capabilities for the workloads running in their cloud environment providing log trails, performance metrics, network level metrics, in-depth visibility of application components, measurements on microservices, PaaS services, and also offers storage and analysis on instrumentation data. The tools choice can depend on the support for interoperability and integration to multiple cloud providers, exchange of data between different databases/storages, perform transformation/enrichment of data and that which provides visualization of data with correlation and business insights from end user experience perspective with drill down approach and performs auto-remediation, auto-discovery, baseline and predict metrics.

    Deployment Model and Pricing

    Monitoring tools are available in on-premises, SAAS cloud-based deployment models, open source/commercial versions and, depending on the complexity in configuring the tools, maintenance and the support needed, appropriate deployment model and pricing/licensing needs, an appropriate tool can be chosen; however there seems to be increasing trend in the usage of SaaS-based monitoring tools.

    Agent-based/Agentless Approach of Monitoring

    Monitoring tools collect the data from the servers and applications using agent-based/agentless, push- or pull-based approach. The collectors can act as metrics/log shippers, which push the data to the centralized server for storage and processing. Agent-based approach may involve deploying the monitoring agents in the machines considered for monitoring and this can be deployed to the target machines, through configuration management tools/infra automation scripts such as Chef, Puppet or Ansible.  Tools may support auto discovery of machines, which can register itself as the client machine for monitoring. Agent-based monitoring can help monitoring the fellow agents as well. Choose the tool that suits the needs and the effort needed in maintaining the agent-based monitoring tools.

    Alerting

    Notifications set up on the predefined thresholds and rules are a must-have for monitoring tools. Tool should provide capability to send mails and web hooks, integrate to collaboration/ChatOps tools such as Slack or Hipchat and provide the ability to define custom thresholds and run batch alerts at intervals.

    Dashboards 

    Monitoring data and metrics can be used for decision-making and stakeholders’ buy-in, for which centralized end-to-end dashboards on metrics of different sources and components are needed. Many commercial tools provide aggregated as well as detailed correlation information and segregated data of applications under monitoring. The tools must provide out-of-the-box dashboard capability and capable to add/update new dashboards views and create graphs, create custom queries depending on the need.

    Customizability

    Many monitoring tools may provide the features for monitoring different workloads, but determining whether the tools provide customizations on defining custom metrics, custom dashboards, custom checks and plugins, community support on extending the tools features, customizable workflows, customizing thresholds and rules and the ability to write customized queries can influence your choice of tools for monitoring.

    Extensibility

    Despite performing monitoring, things may break; hence, monitoring tools should have extensibility to the collaboration tools which can alert through the proper channel to the team to act upon. Integration with ticket-based controls and incident management workflows, auto-ticketing mechanisms, auto-remediation tools and REST API support are some of the key items to look for when evaluating the monitoring tools.

    Production Grade

    Determine how the monitoring tools can perform in the given load and the support for production cluster setup. The tool should be capable of responding within the defined seconds, for the defined set of servers and time interval and store time series data collected from different sources (servers, devices, applications, etc.) and check whether the monitoring tool can scale up depending on the load. Scalability, performance can largely influence the decision of selecting the monitoring tools.

    Analytics – AIOps

    Commercial monitoring tools provide capability of running machine learning techniques, which can perform anomaly detection in the data, help predict the capacity and demand and maintain inventory based on the metrics. Depending on the advanced use cases the business demands, choose the tools which can provide these capabilities that can accelerate the IT operations maturity level.

    Ticketing and Incident Remediation

    Despite deep monitoring, defects may leak and SRE teams may have to triage and resolve the issues. Autoticketing and autoremediation workflows can be defined in the ITSM tools, which can integrate with the monitoring tools and trigger the remediation workflows based on the alerts defined and notify the SRE teams through different channels. Choose monitoring tools that can be easily integrated with the ITSM tools and provides out-of-box or options to develop custom workflows without much complexity, to achieve use cases such as auto-ticketing based on threshold alerts in monitoring and autoremediation.

    Conclusion

    When choosing the full-stack monitoring tools, choose the tools that offer monitoring capabilities for varied workloads including containers, IoT and comprehensive platform with user interface and integrated dashboards, along with integration and interoperability between the IT operations tools, ITSM tools and AIOps tools, which provide event correlation and analytics Choosing the tools that are right-sized and address the skillset, technology needs, pricing and deployment models, with a focus on must-have features, will enable SRE teams to triage and remediate the issues faster.

    — Lavanya Subbarayalu
  • Living in a DevOps World, Part 2

    Living in a DevOps World, Part 2

    Part one of this article focused on some of the more behind-the-scenes benefits of an Agile DevOps approach. In part two the focus turns to some of the other traditional problems that a well-executed DevOps approach can address, and how doing so can benefit an organization in more ways than just a technical perspective.

    By way of quick review, DevOps was born out of the Lean and Agile software development methodologies when it became clear that, while those methodologies did indeed speed up the development process, a bottleneck still occurred when push came to shove and new code had to be moved to quality assurance and production environments.

    DevOps was created to more seamlessly connect the development and operations processes, making code migration, testing and promotion to production a more efficient process. To accomplish this, the DevOps approach had to find solutions for some of the issues that caused operational delays, and create new ways to organize, implement and continuously optimize the operations process.

    Overproduction/Overprocessing

    For those who have been in development and/or operations for any length of time, it quickly becomes clear that there is a multitude of operational safety checks that serve to protect a production environment. While that is vitally important, it was also clear that there had grown an “over” problem around many operational procedures, and in many cases that manifested itself in the development process. That includes overproduction, when making or requesting more than was needed from requirements and/or operations perspective to clear arbitrary operations process hurdles.

    Alternatively, overprocessing, when development and operations resources do more work (as opposed to just enough, as Lean and Agile would suggest) than required to smooth the transition of code and functions from development to operations. This created waste regarding time, resources and budgets that were not proportional to the benefits derived from following the operations process.

    Motion and Transportation

    Similarly, DevOps also sought to solve the operational problems of both motion and transportation. That is, the amount of excess work required to deliver new code to meet the operational requirements for code migration. The friction caused by such requirements slowed the motion and momentum of the development process. The same is true of transportation, or the difficulty in moving code between environments such as testing, quality assurance and production.

    In both cases, development and project momentum was sacrificed for what often turned out to be a series of artificial hurdles that had long since become less effective or even obsolete parts of the operations process.

    Correction and Inventory

    In most instances, all of the above resulted in the final maladies of the pre-DevOps development and operational ways. The first was the number of in-flight corrections required when timelines were squeezed, and the rush was on to get to production. Unfortunately, this went hand in hand with the ultimate problem of good code being sacrificed for expedient delivery, often resulting in inadequate functionality, system outages and, in the end, lost market opportunity and revenue.

    3 Keys to DevOps Success

    Any successful DevOps implementation must address three critical factors in this order: culture, organization and tools.

    Culture

    It’s critically important to connect an organization’s values to the DevOps process. Valuing quality, timeliness and organizational alignment of goals and objectives is the first step toward DevOps success. Such cultural values translate directly into a DevOps organization.

    Providing empowerment and accountability to DevOps team members helps to build ownership among the team, and trust from their customers in the rest of the organization. It also helps to provide a physical environment that fosters collaboration, teamwork and continued learning. Co-working spaces and collaboration tools such as Slack are a good start. Attending external conferences to broaden perspectives and to bring new ideas back to the team is often beneficial. From there, brown bag lunch sessions where ideas and experiences can be shared, frequent post-mortems on implementations to hone best practices, and even internal mini-conferences where several departments come together for a day to discuss DevOps practices are all effective ways to build a strong DevOps culture.

    Organization

    Any good DevOps organization is two-sided; that is it has to work from the top down and from the bottom up at the same time.

    The top-down part is in the ability to “see the system” from a macro level, allowing for process understanding and insights from a business workflow perspective. This helps to identify the pain points and bottlenecks in the current process that can be optimized through the DevOps process.

    Once that’s accomplished, the bottom-up work begins. Identifying things such as inconsistencies in code deployment environments that cause delivery issues, elimination of manual and custom built deployment processes and quarantining inefficient and poorly written code until it can be redone or eliminated are all part of optimizing the time, quality, resources and success factors for deploying production systems on schedule. It’s also important here to continually audit the current processes with an eye toward eliminating the processes that are no longer required or useful but have been kept in place out of the fear of  “breaking something we don’t understand.” If nobody understands it, then it shouldn’t be in production software.

    Automation Tools

    The final factor for DevOps success is to have the right toolset.

    Communication: Any DevOps team requires the ability to quickly and directly communicate with other team members sans meetings. For this purpose, tools such Slack (real-time chat), Skype (video chat), and Confluence (for storing persistent information) are pretty good options.

    Planning, Monitoring & Consistency: For the team’s planning needs, a tool such as Trello that can provide Kanban board functionality is worth a look. For issue tracking and monitoring of any system’s overall health, tools such as Jira and NewRelic respectively provide some good functionality. Likewise, consistency is vital in a DevOps world, and using automation to ensure that all systems are configured as desired across different environments is a crucial best practice. For this, a tool such as Ansible is worth a review.

    Integration & Deployment: For continuous integration of systems in development and as a way to tighten the feedback loop for developers to determine if the central build used for deployment to production is working as intended, the Jenkins toolset might be a good fit. And finally, when it comes making any deployment process as painless as possible, a tool such as Docker that can handle created containers for an application that includes all dependencies, reducing the complexity of deployment to multiple environments, is a solid way to go.

    The point of all of this is to create an environment—culturally, technically and physically—where DevOps can succeed, grow and thrive. Organizations that can create an effective and efficient DevOps environment have also created a competitive advantage for themselves.

    — Dave Farinelli

  • Spring Cleaning 101: Polishing Up Your DevOps Processes

    Spring Cleaning 101: Polishing Up Your DevOps Processes

    Dev teams should take time to tune up agile processes and continue advancing their shift toward DevOps

    Release cycles are accelerating, but not as fast as development teams want. Customers’ desired release rates are moving at an unimpressive pace; those looking to push out new updates on a weekly basis often find it looks more like a monthly basis—and that just isn’t going to cut it.

    As the frequency of execution increases, dev teams find themselves between a rock and a hard place. While the growing demand for faster turnarounds isn’t poised to slow down anytime soon, teams struggle to integrate a set of tools into an efficient pipeline to get the job done within the time allotted. With demand on the rise, how can teams work together to fast-track their release cycles?

    It’s time for dev teams to apply a little more elbow grease.

    With spring cleaning season upon us, dev teams across industries should take time this season to tune up agile processes and continue the work of advancing their shift toward DevOps.

    Dust Off Roles and Responsibilities

    A once very siloed practice, software development has since taken on a much more agile approach across teams as the need for faster release cycles rapidly grows. According to a recent VersionOne report, nearly 75 percent of respondents attribute the need to accelerate software delivery to their adoption of agile practices. While DevOps is meant to help dev teams deliver applications at a high velocity, managers encouraging the implementation of these processes often overlook the true meaning of DevOps and the effects these transformations will have on its current employees and their roles.

    At its very core, DevOps is the combination of development and operations, which covers a wide range of tasks once performed by developers, testers and operations at different stages throughout the software development life cycle (SDLC). However, a more agile approach means these different processes (building, testing, etc.) are in a more tightly coordinated execution, requiring each of the different silos to have a better understanding—and knowledge—of each process.

    Before jumping in to update any processes or technologies, it’s important to ensure all teams are aligned on their evolving roles and responsibilities. Sit down with individuals, teams and their managers to get everyone on the same page and provide guidance on best steps for moving forward this year.

    Shrink the Skills Gap

    Despite developers’ growing list of responsibilities, a 2018 report from LinkedIn found that there is a significant skills shortage when it comes to software engineers and other similar career trajectories. That gap shrinks even further when you consider the different roles within software engineering itself. For example, developers have recently taken on more responsibility as “full stack developers,” assuring high-quality outputs and confirming there are no bugs in their code, yet have very little knowledge of how to implement continuous testing.

    This spring, spend time with employees to brush up on their skills, refine their job responsibilities and uplevel their expertise. While this isn’t a task that can be performed and executed on overnight, some recommendations to kick start the process include:

    • Get leadership on board: To fund any of this, teams will need leadership buy-in. Be sure to sit down with those in senior positions to explain the benefits to teamwide training from both an organizational and economic perspective.
    • Try the buddy system: Pair up programmers of different skills and levels to mentor one another. Consider it as a coaching system in which team members can provide feedback and training in real time with real-world projects.
    • Consider augmenting software delivery practices to improve quality: acceptance test driven development (ATDD) is a proven accelerator and behavior-driven development (BDD) helps bridge varying skills and blind spots between the different personas across the SDLC.

    Pick up New and Improved Processes for Increased Productivity

    As release cycles accelerate, team leads need to take a close look at each of the stages throughout the SDLC to determine where the roadblocks occur and what exactly is holding employees back. Analyzing not only the quality of outputs, but also how quality assurance is embedded throughout continuous integration (CI) process is a good start.

    Throughout the DevOps journey, there are a number of developers across different feature teams adding to, editing, updating and continuously testing code at any given time. Establishing best practices and some basic ground rules can be a simple way to ensure visibility into each of the teams’ productivity. Everyone must constantly be aware of which teams are moving along and which are struggling a bit to make sure code is well-maintained (e.g. determining if your testing code blocking your CI integration) and that there are no memory leaks or poor code development practices throwing the process off. Continuous testing across different feature teams will also assure that every code component for different functionalities is working once they all finally merge.

    Getting everyone on the same page will also make it easier to simplify real-time decision making. Be sure to work with teams to define their dashboards, ensuring everyone is seeing the same actionable results at any given time.

    Revamp Your Tech

    While people and processes should be a main focus for spring cleaning, don’t forget about the tech. The different types of technologies utilized throughout the DevOps pipeline must integrate seamlessly with everything mentioned above.

    First, consider your lab environments. The lab is the glue that keeps the entire CI process together, supporting all platforms (whether mobile, desktop, web, etc.). If unstable or unavailable at any given moment, the entire process breaks.

    As more organizations begin to adopt these agile approaches to software development, it’s also important to remember that it’s nearly impossible to build a “one-size-fits-all” solution; every new process, tool or technology should integrate well within the existing toolchain, which will vary from business to business. For the most success, don’t jump to conclusions and totally overhaul your current stack. Today, there are very few vendors that offer solutions that address every step throughout the development process. Instead, develop new APIs or integration points that make it easier to diversify the set of tools you already have.

    Finally, consider your frameworks. When it comes down to it, there are material differences between the developer’s objectives around tests and the test engineers. Make sure the entire team has tools and access to different frameworks based on their needs. A developer, for example, would use a tool such as Espresso or XCUItest to run a small number of unit tests, whereas test engineers require end-to-end functional test frameworks, such as Appium or Selenium.

    Conclusion

    While it won’t always be easy, it’s important to take some time this spring to get your DevOps teams looking squeaky clean. Don’t forget to focus on polishing up your processes, training team members and sprucing up your stack to ensure release cycles are on time—and spotless—by the time the summer rolls around.

    — Eran Kinsbruner

  • Using Inspec to Validate Infrastructure

    Using Inspec to Validate Infrastructure

    So, here we were, at one of the bigger financial corporations in New Zealand, working on an elaborate infrastructure built on Docker containers. It had configurations, SSL certificates, DNS entries and all the other condiments required to spice up a tasty infrastructure curry. Though we were able to stand up our complete infrastructure environments from scratch using automated configuration management tools, we weren’t really sure if it was indeed working correctly, or rather the way it was supposed to. The question staring at us was, Is there a way we can declare the desired state of our infrastructure and then validate our infrastructure against it?

    Inspec to the Rescue

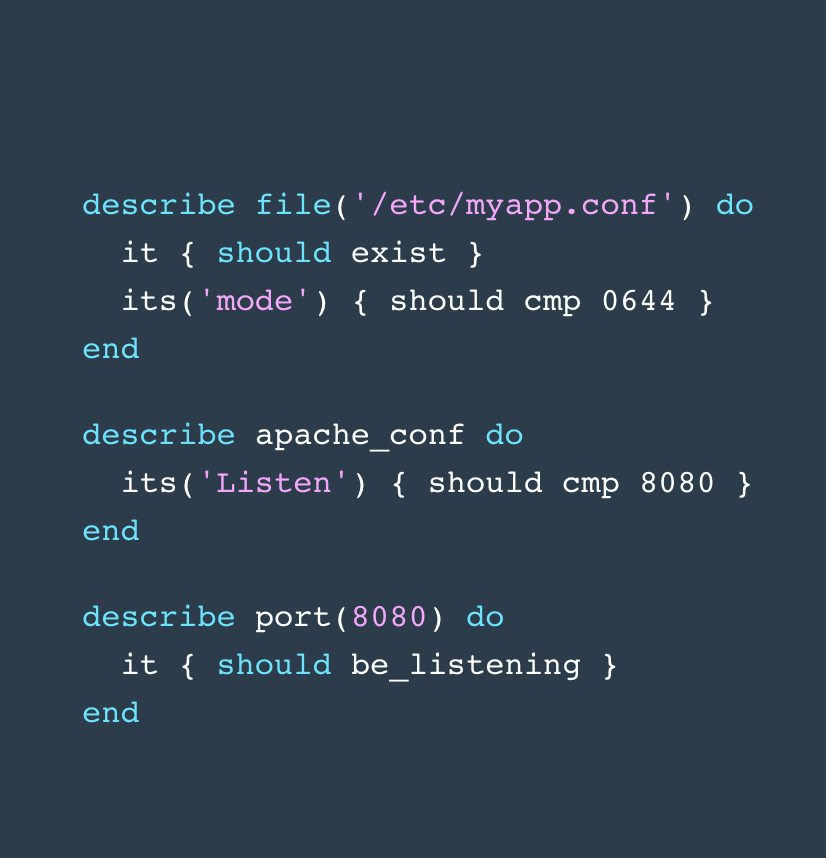
    The open source tool Inspec has been used with considerable success over the last few years to achieve security compliance for infrastructure. The syntax/constructs happens to be unbelievably simple. For instance, let’s consider the code snippet below. It doesn’t really require a lot of programming knowledge to make sense of it. Isn’t it?

    This made us wonder, what if we use Inspec to validate our infrastructure setup? What if we map our infrastructure configurations in an easy-to-read declarative syntax? What if this actually solves our problem?

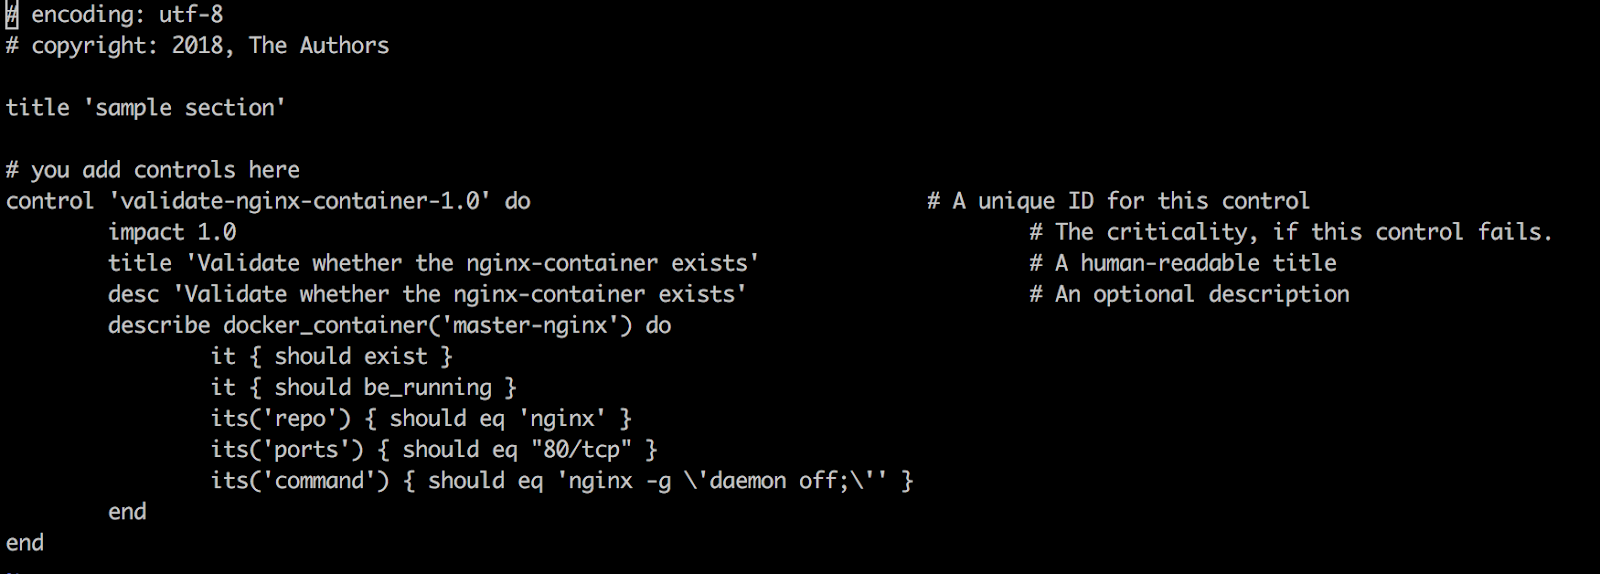
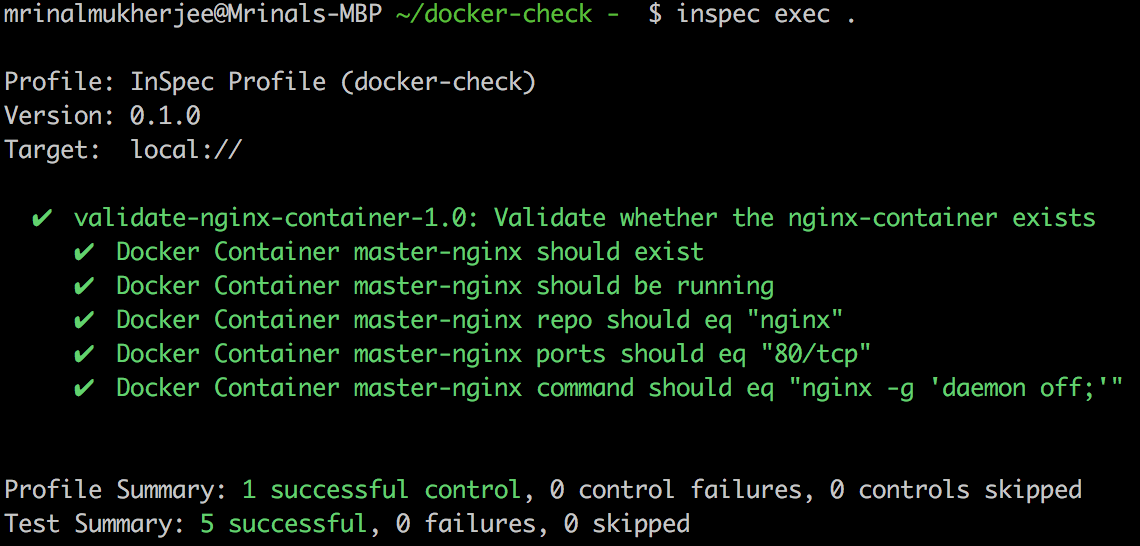
    In line with the best practices of DevOps, we started with a simple experiment; an experiment that could solve a tangible problem. We had a Docker host which was supposed to have a particular docker container running inside it, but it used to fail quite often, for some reason. We decided to write a test in Inspec to check whether this container was running on this host:

    … and tried executing the test.

    This was just what we wanted!

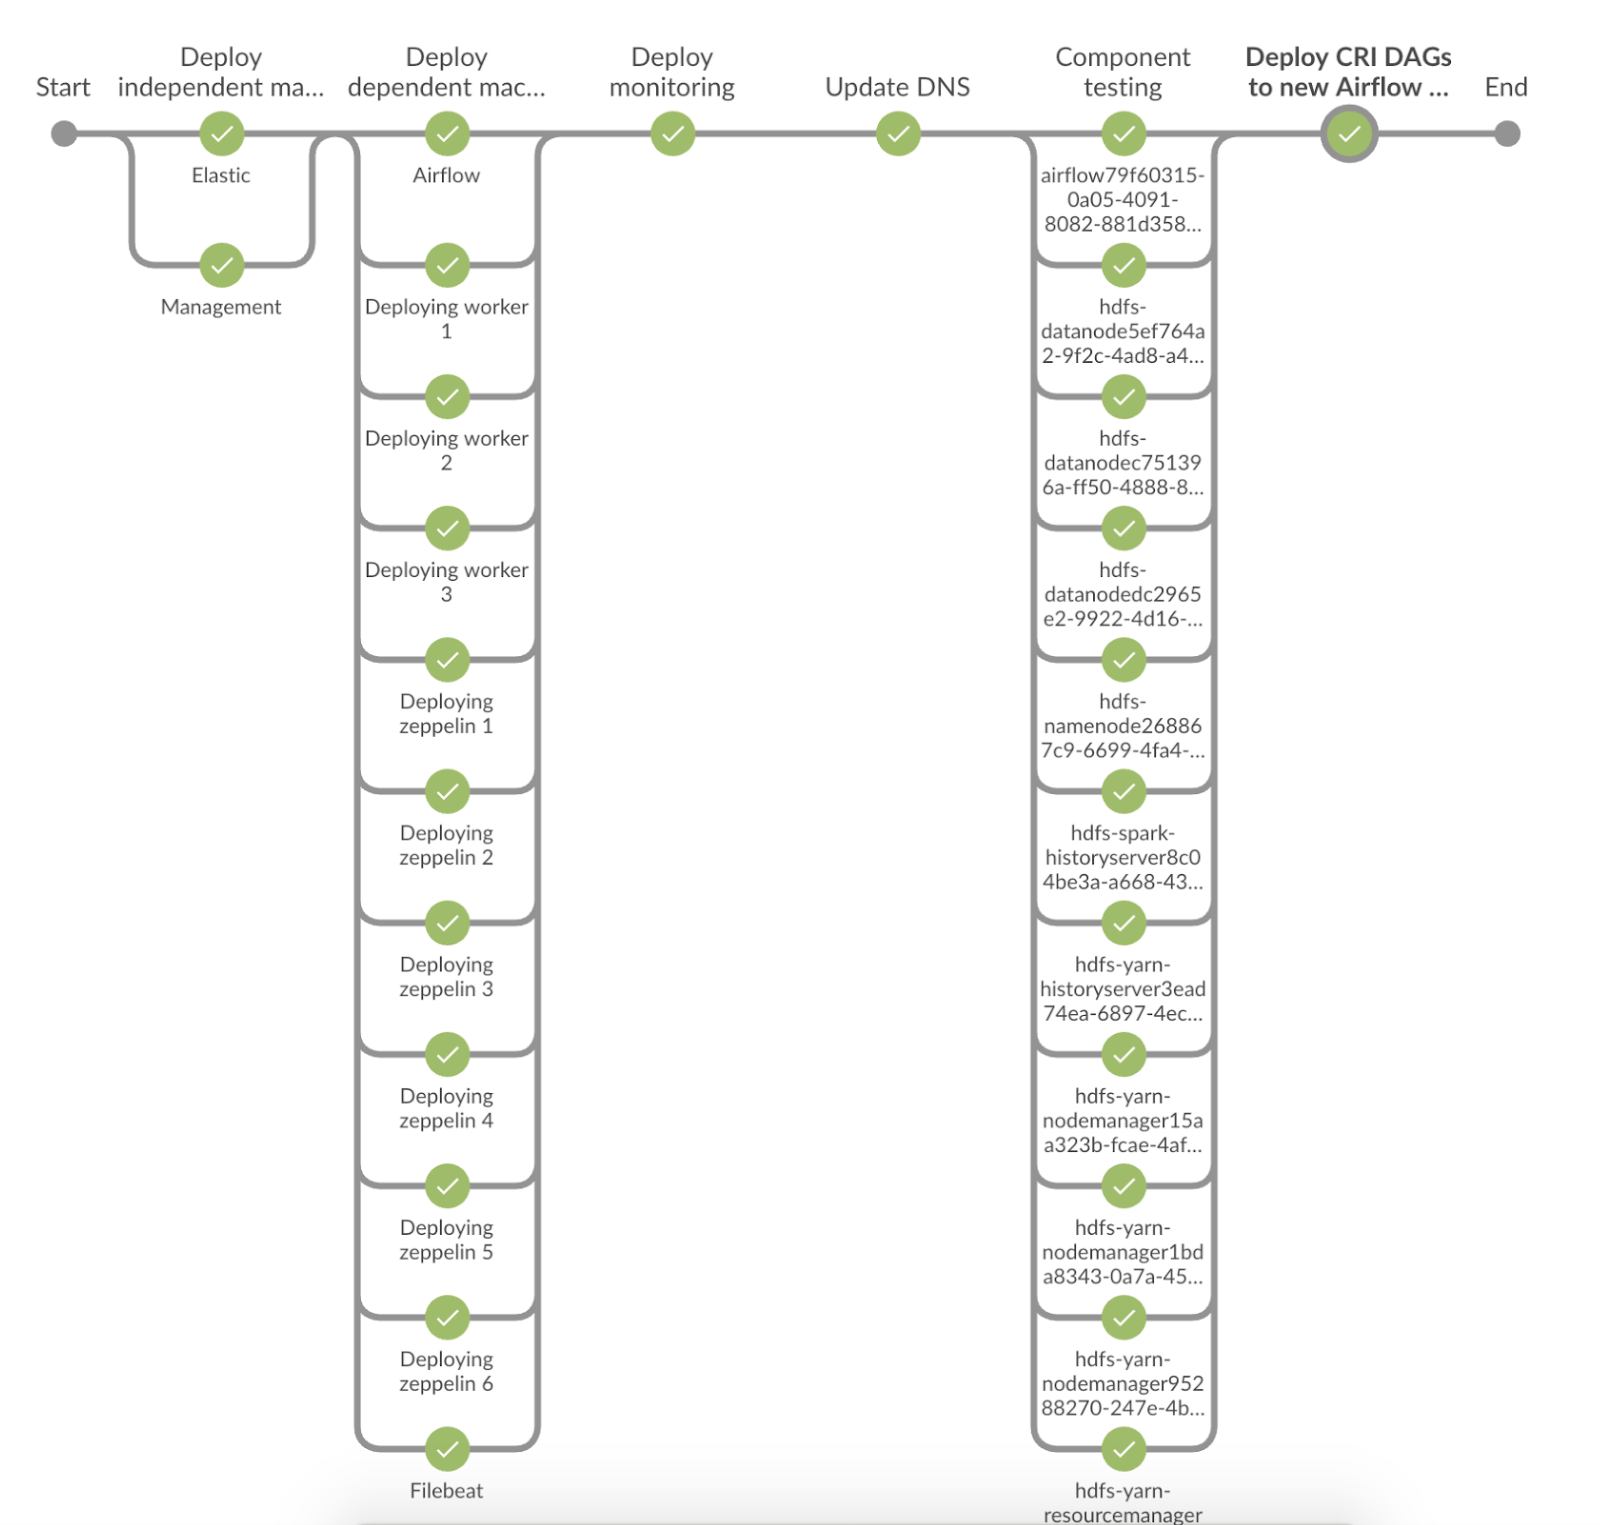
    Excited with this success, we started writing a battery of tests that validated each and every component of our infrastructure. Within a single day, we churned out 192 tests. The number of tests wasn’t as important as the scope and breadth of the test coverage. Once the tests were there, we plugged them on to our infrastructure pipeline (which was built using Jenkins) to ensure the components align with the desired state. We called them ‘component-readiness’ tests.

    So far so good.

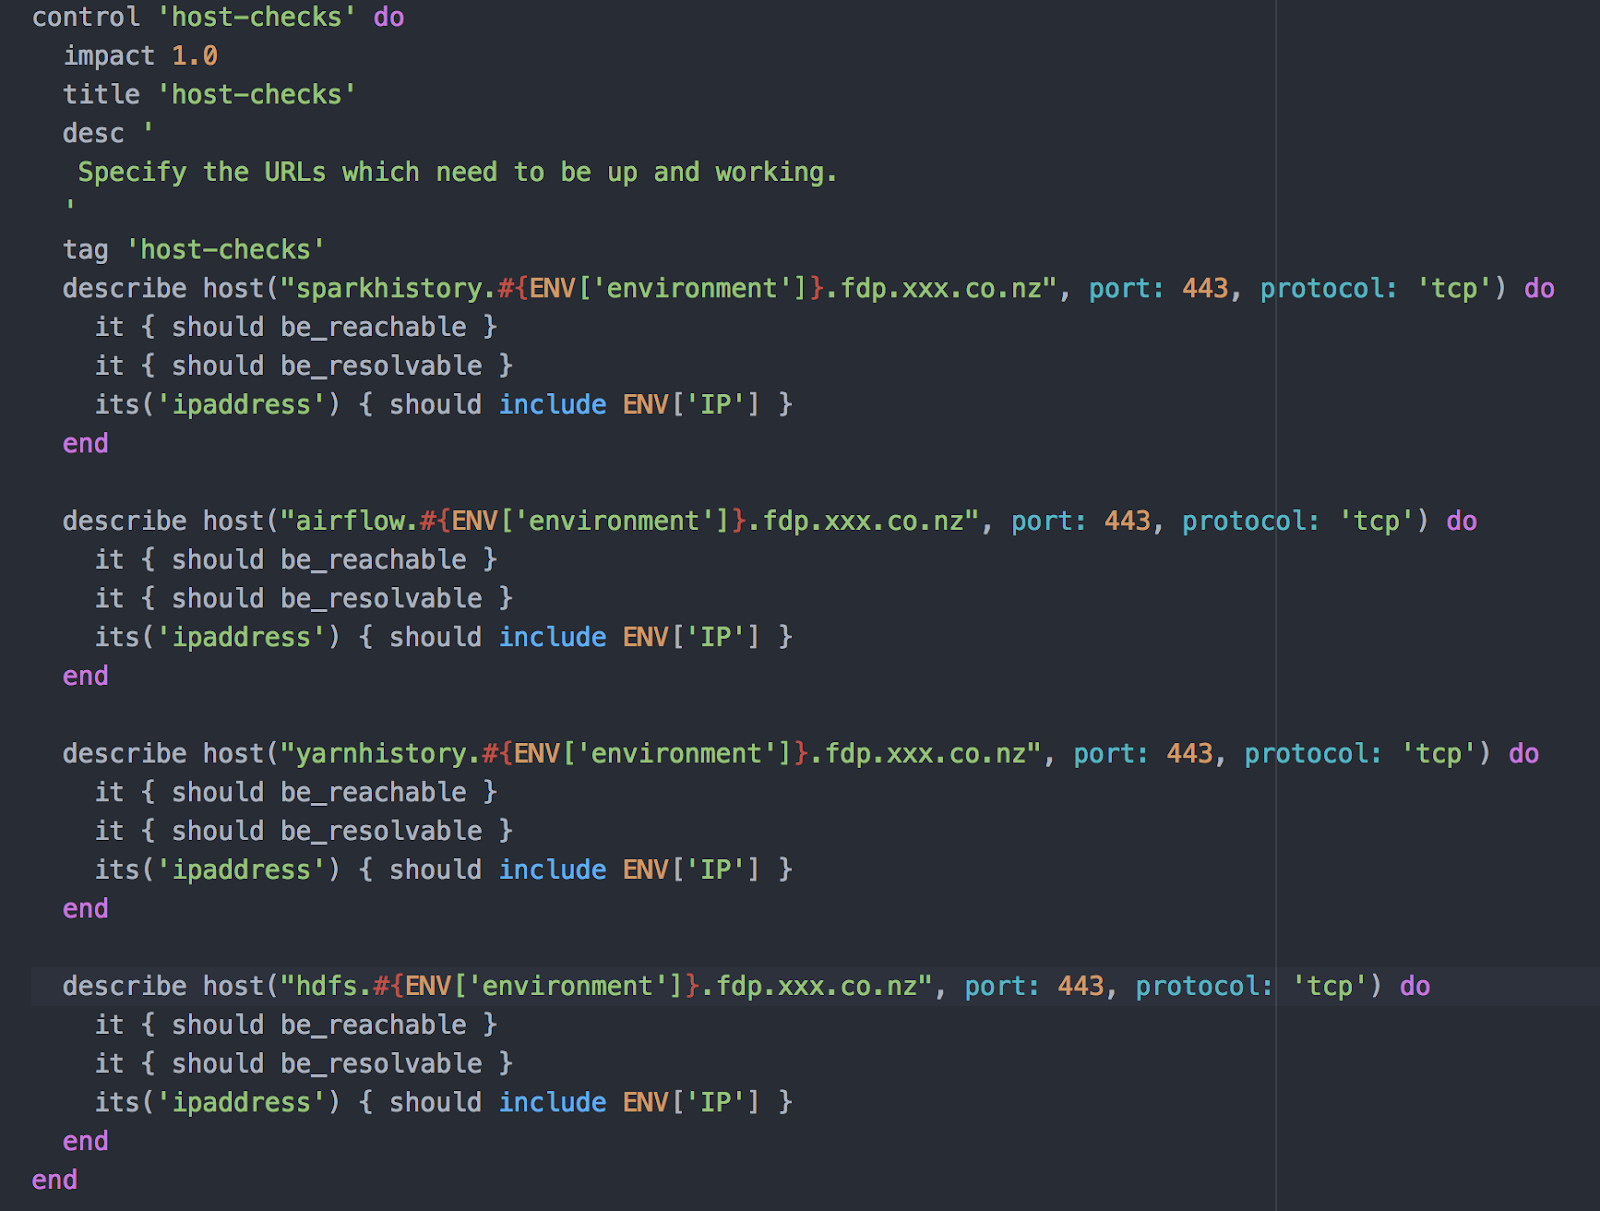
    Now that our components match the desired state, are we still confident that our platform would work the way we intended? Perhaps we need some “platform readiness tests” as well. Can we use Inspec for that, too? The answer: Yes!

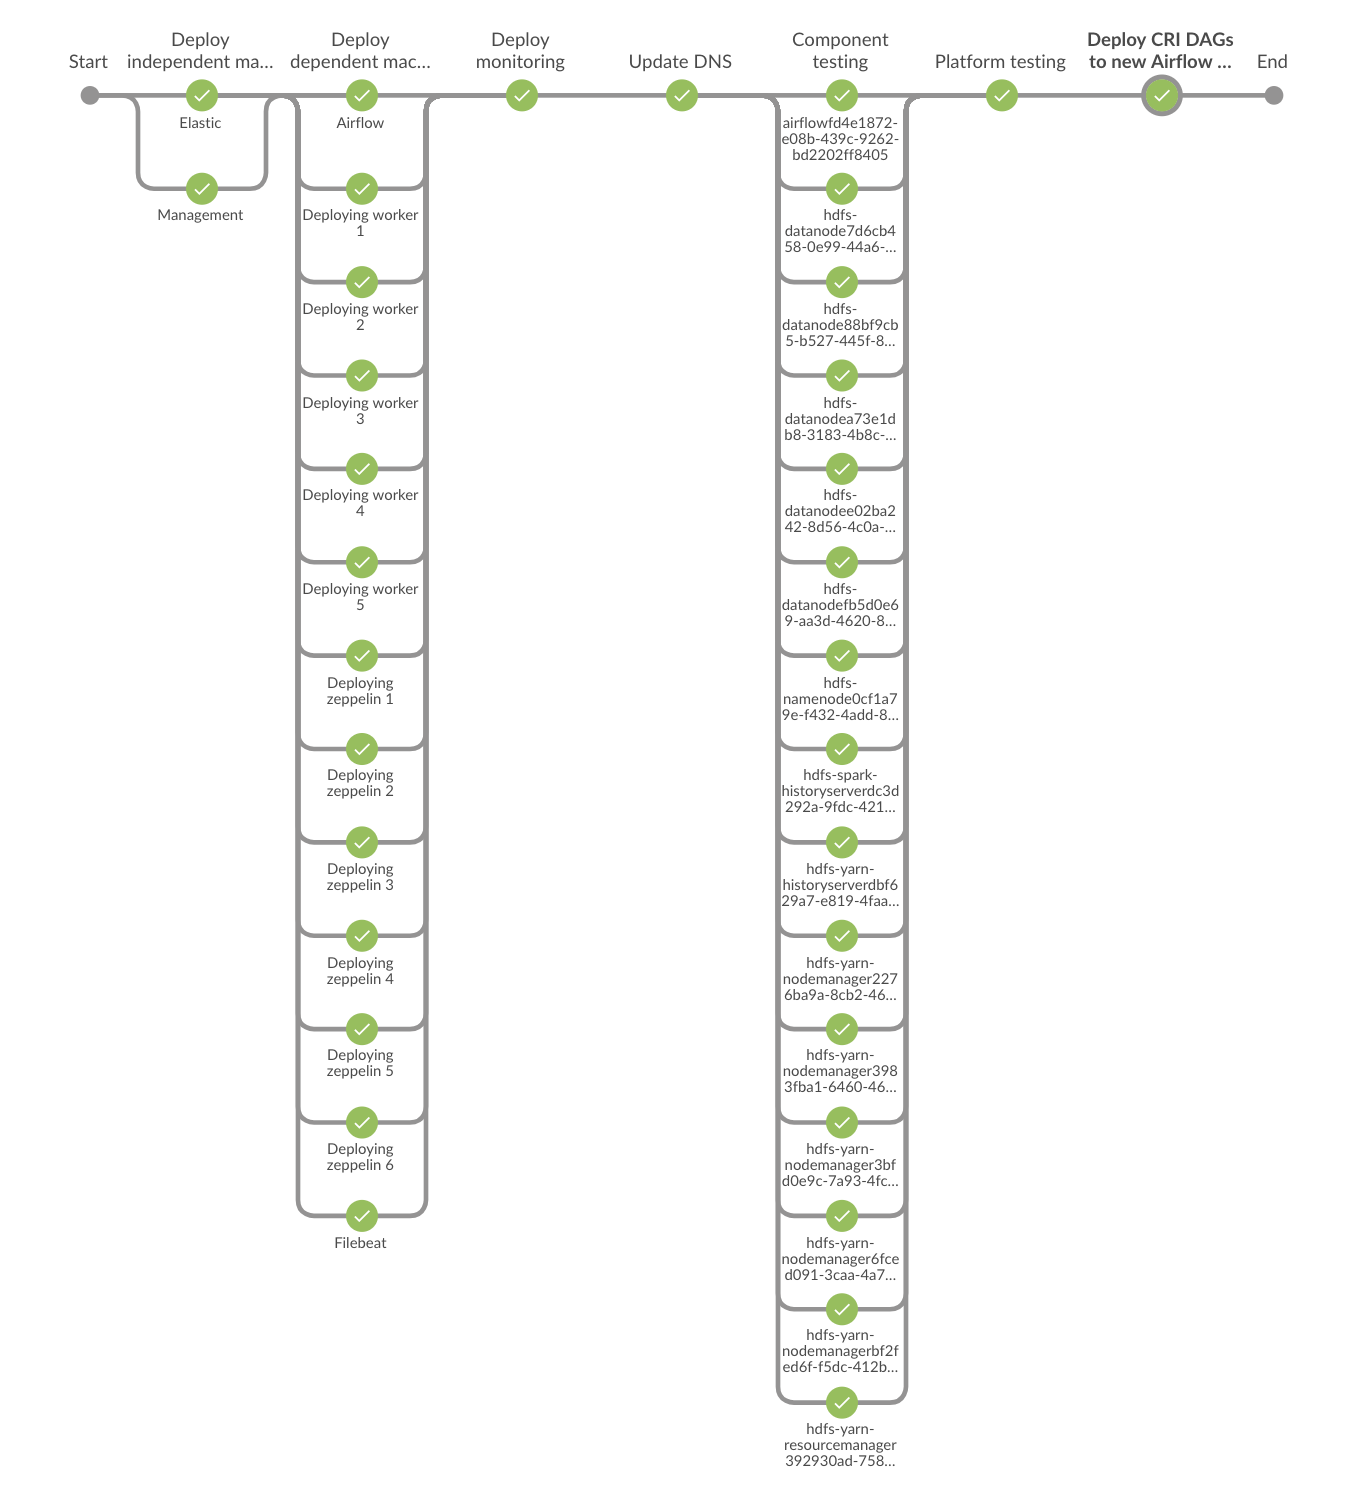
    Now that the platform readiness tests were ready, we extended our infrastructure pipeline to incorporate them as well.

    Setting our component and platform readiness tests using Inspec had one more fantastic offering: live documentation for infrastructure. Inspec allows the audit results to be displayed in a variety of report formats, including JUnit, JSON, HTML and others. We used the JUnit report format and displayed them using the Jenkins JUnit Plugin. With this, we were able to have human-readable JUnit reports that doubled as live documentation for our infrastructure.

    Needless to say, this infrastructure testing with Inspec provided that (much needed) confidence on our setup and readiness. Our pipeline is designed in such a way that whenever any infrastructure component changes in our ecosystem, the pipeline is triggered which reconfigures and (if required) rebuilds the ecosystem. These Inspec tests are triggered with this infrastructure pipeline and validates the newly configured infrastructure setup. Thanks to this, we are never in a situation in which the client application running on this infrastructure complains or aborts because of incorrect configurations. Moreover, as described above, the living documentation helps document the expected configuration of the environment.

    So far, the Inspec implementation I have referred to is using the freely available Inspec tool and the Jenkins platform. Inspec can also be combined with Chef Compliance to produce more descriptive reports and charts. Chef Compliance also comes with out-of-the-box CIS profiles that can be used to jump start an Inspec implementation for security compliance and audits.

    Inspec is an easy tool to master with simple and intuitive constructs and one could get up and working quite easily. However, this simplicity has a downside. It’s very easy to speed ahead and gloss over the documentation while missing out on the best practices and tips/techniques to implement the solution in a better way. One way to master this is to have a crack at the newly released Auditing with Inspec certification, which provides the impetus to go through the documentation in detail while preparing for the certification. And, you also get to show off a shiny badge for your efforts!

    In Summary

    Infrastructure validation is quite an important step in any DevOps implementation. Apart from being very useful for security compliance testing, Inspec can be used to validate infrastructure using a simple and easy-to-understand declarative syntax. Moreover, it has a small footprint, a vibrant community looking after it and up-to-date and clear documentation. It definitely is a tool with the potential to provide quick and effective results.

    — Mrinal Mukherjee

  • Google Unveils Suite of APM Tools

    Google Unveils Suite of APM Tools

    Google today announced that it is making available application performance management (APM) tools based on the same technology it employs to manage its internal IT environment.

    Morgan McLean, a product manager at Google, said Stackdriver APM is based the open source StackDriver Trace and Debugger tools Google originally developed for its DevOps teams.

    The APM offering, available in beta, also includes Stackdriver Profiler, a tool Google developed to enable DevOps teams to explore how their code is running in a production environment.

    Google also said it has integrated Stackdriver Debugger with GitHub Enterprise and GitLab to extend the number of repositories developers can use to create mirrors of their code.

    DevOps teams will have the option of deploying Google APM tools either on-premises or on a public cloud.

    McLean noted that rather than throwing additional compute resources at a performance issue, Stackdriver Profile enables DevOps teams to discover and remediate issues and ultimately reduce costs. To minimize the impact of Stackdriver Profile on the performance of a production application, Google opted to employ statistical methods to create a profile of a piece of code. Specifically, Stackdriver Profiler collects data via lightweight sampling-based instrumentation that runs across every instance an application. Data showing CPU time, wall time, RAM used and contention, for example, is then displayed on a flame chart.

    At the core of the Google APM toolkit is a the Stackdriver Trace software the company developed to collect latency data about applications deployed in a distributed computing environment. McLean said that in the age of microservices it’s not feasible to managed modern distributed applications without any ability to instrument them. For many IT organizations, however, the cost of acquiring APM software or employing a cloud service has forced them to limit their use of APM technologies to only their most critical applications.

    Google is trying to remove cost as significant APM factor, which ultimately will result in the applications deployed on the Google Cloud Platform (GCP) becoming more robust and reliable. The Google APM tools can be applied to applications running on virtual machines and containers, as well as the Google AppEngine, a framework Google exposes on its cloud service to enable the development and hosting of applications. In effect, Google is making it easier for organizations to consume open source tools that IT operations previously would have had to stitch together on their own.

    Reliance on APM tools is at the heart of any DevOps process. But DevOps processes are not universally employed, largely because in addition to acquiring new tools, organizations must evolve their processes and culture. The debate many of them have comes down to an argument over whether they need to buy tools before they change those processes or change their processes to justify buying the tools. Most often, it’s the initiative of handful of developers that force the issue. It’s only once that team is successful that senior managers start to think about replicating the DevOps process employed by that team across the rest of the organization. Via Stackdriver APM, Google is clearly hoping to accelerate the rate at which those transition to DevOps occur.

    — Mike Vizard

  • DevSecOps: Don’t Invest In Hope

    DevSecOps: Don’t Invest In Hope

    A successful DevSecOps approach is rooted in action, not hope.

    There is a lot of investment in hope.

    I hope we won’t get breached.

    I hope our DevOps teams aren’t deploying thousands of vulnerable containers.

    I hope our developers aren’t downloading millions of vulnerable open source components.

    I hope our developers and security teams will figure out how to work together.

    I hope we won’t be fined under GDPR.

    I hope the hackers don’t notice.

    Yet, the fact remains that hope will not reduce breaches. Hope does not safeguard your containers or components. Hope cannot achieve collaboration. Hope won’t prevent a fine. Hope is not a strategy.

    Many organizations are considering their approach to DevSecOps. They are moving beyond hope to strategy. They are choosing action over indifference. They are taking the first step of their journey.

    Here are three ways to start your journey:

    Picture This

    We all learn from others. Here is a collection of 20 DevSecOps reference architectures. They reveal the choices and priorities others have made ahead of you. Look at what they did. Choose to do something similar, or create your own path from a mix of their ideas. If your canvas is blank, use these to draw something.

    Watch This

    The pioneers are the ones with the arrows in their backs. Another word for DevSecOps pioneers is practitioner. And many practitioners have navigated their journey successfully enough to share it. More than 15 practitioners shared the tale of their DevSecOps journey during All Day DevOps. Every session was recorded online. Every session is free. Start with this one from DJ Schleen at Aetna and then pick your next one.

    Start There

    In a panel discussion I sat on recently as a prelude to DevSecOps Days at this year’s RSA Conference, I heard some very practical advice (find the recording here). One of the other panelists, Stephanie Derdouri from Fannie Mae, advised our audience to start with one thing. Don’t pick a bunch of strategies and tactics. Just pick one painful, suboptimal or annoying practice tied to security and improve that element within your DevOps practice.

    Pick only one. Start there.

    Hope is not a strategy. Action is your only safe option. Take the first step.

    — Derek E. Weeks

  • The Role of DevOps in Building an AI-Ready Infrastructure

    The Role of DevOps in Building an AI-Ready Infrastructure

    The successful application of machine learning for artificial intelligence (AI) requires several contexts to be addressed, primarily the technical, data and business considerations.

    The Technical

    From a technical standpoint, in building an AI-ready framework there are choices to be made such as which machine learning framework to select, the type and structure of learning function and the style of training algorithm to use. These decisions are normally based on the skill, experience and judgment of the computer scientist. A practitioner should be able to coordinate these aspects and focus on business outcomes without overly burdening the line of business with technical detail. The exception to this is when core design decisions in some way will impact business outcome.

    The Data

    Equally as critical to the efficacy of machine learning is the data available for use in development and training. A deployed algorithm is a function of the data inputs it received during training and testing; these inputs should be consistent and representative of the scenarios that will be subject to inference by the algorithm. It is difficult to accommodate so-called black swan events, as typically these require a level of adaptiveness beyond present machine learning technology.

    However, we can still hope to achieve an effective and enriched algorithm that is appropriately responsive to real-world events by collecting and building data sets and training libraries that are truly representative of the environment in which the algorithm will operate. Ideally, machine learning data should include as many data outliers as may occur naturally within the real world—we should not be improving or self-selecting data, though granted most applications will use some form of normalization.

    Speaking to data scientists and machine learning specialists, it is clear as individuals they have the technical skills and access to the core technology they need to do their jobs. However, more often than not it is access to and availability of real-world, suitably random data that is one of the biggest and most time-consuming challenges. Addressing this requires good engagement with the line of business, as access to sensitive data requires negotiation. But as matter of course, any business that utilizes data analysts to help inform critical business decisions and wants to benefit from machine learning should take the necessary steps to ensure it offers accessible and open data services to their machine learning teams. Having an open, accessible and agile data architecture is an essential prerequisite of being able to deliver an AI/machine learning-ready infrastructure.

    The Business

    On the business side, rather than address the how and what questions of technology and data, we also need to ask why. Certainly, as with any IT project, business does not want to engage machine learning or AI for its own sake. It is important to understand the business goals and seek new technology that will align with those objectives. This is where the application of DevOps techniques can greatly improve business outcome.

    By aligning software development with software operations, more emphasis can be placed on what is important to the business while also helping to support the effectiveness and usability of new machine learning functions. In their deployment and use, these new applications should also exhibit many of efficiency features of modern IT technology. Thus, we expect new deployments to be able to make effective and efficient use of container technology. And where a particular function is infrequently required, how much more efficient is it to use a serverless function, perhaps with the data resident on private storage, and the function being called on demand in the cloud.

    This type of capability is now readily available to machine learning thanks to the advent of virtualized GPUs provided by a choice of cloud services. This ability to dynamically and adaptively use infrastructure aligns well with the capabilities DevOps practitioners, who for a long now time have been used to managing the deployment of continuously developed releases of code. This agility, driven by the need for adaptability and innovation is very much what is required for successful machine learning and AI. But underpinning all of this is the need to maintain the conversation with the business around the open, yet appropriate accessibility to data.

    — Matt Watts

  • OpsRamp Looks to Fuel IT Operations Consolidation

    OpsRamp Looks to Fuel IT Operations Consolidation

    One of the biggest challenges associated with DevOps is cutting through all the various platforms and applications alerts to make sense of what’s occurring in an IT environment, much less manage it. In fact, there’s been a pressing need of consolidate management tools for IT operations for quite some time now.

    OpsRamp is now making just that case with the unfurling of Unified Service Intelligence, a set of integrated IT management applications that are all delivered using a software-as-a-service (SaaS) model that makes it possible to unify multiple dashboards.

    Deepak Jannu, director of marketing for OpsRamp, said that although there are more application programming interfaces (APIs) being exposed than ever, it’s still too difficult for IT operations teams to correlate data in a way that creates meaningful actionable intelligence. For the most part, IT operations teams are still swiveling between different consoles in the hopes that some insight will magically make itself apparent, he said.

    To make it easier to separate the signal from the noise, Unified Service Intelligence combines discovery and monitoring health dashboards with incident management capabilities in single application layered with hundreds of best-practice monitoring templates to simplify IT administration.

    Jannu noted many IT organizations struggle when transitioning to DevOps because they are confronted with a classic chicken-and-egg challenge. Most of them rely on legacy tools that are not integrated. Trying to modernize IT operations processes is simply too difficult without the right set of tools in place. The only way to make modern tools affordable for most organizations is to deliver them as a set of SaaS applications, he said.

    As IT organizations find themselves embracing multiple clouds as well as emerging technologies such as containers, Jannu noted it’s now only a matter of time before IT operations reaches a breaking point inside most organizations. It was difficult enough trying to navigate different dashboards for IT infrastructure and applications running on-premises. The cloud, in most cases, just adds another series of platforms to an already-inflexible mix of isolated processes, he said.

    Just as significantly, he added, an integrated platform also is key to cutting down IT operations fatigue. Most IT operations teams don’t discover critical issues early enough because it’s simply too difficult to understand what an “alert storm” being generated by disparate management tools signifies. After a while, the IT operations team becomes inured to all the alerts being generated.

    Longer term, Jannu said OpsRamp will be better positioned to apply machine and deep learning algorithms to automate IT management than the average IT organization would be by running tools locally on its own. OpsRamp already generates 3 billion records of events a day, all of which can be used to inform artificial intelligence (AI) tools that require access to massive amounts of data to effectively train models. Locally installed IT management tools will never generate the required volume of data required to train an AI model.

    It remains to be seen how fast the IT operations management space will consolidate. There are a lot of constituencies inside IT organizations that have a vested interest in one tool or another. That said, the writing on the wall heralding that consolidation already has been inscribed.

    — Mike Vizard

  • Applitools Advances AI Testing of User Interfaces

    Applitools Advances AI Testing of User Interfaces

    Given the number of platforms applications now need to be able to run on, it’s little wonder that mistakes and errors that compromise the graphical experience of the end user appear all too regularly in production. Keeping up with all the various nuances of each platform is just too much to ask of the average developer. To even those odds, Applitools has developed Applitools Eyes, the latest release of which extends the reach and scope of user interface testing in addition to providing expanded third-party tool integrations, enhanced analytics and team collaboration tools.

    Version 10 of Applitools Eyes extends the company’s mission to employ artificial intelligence (AI) to enable organizations to consistently deliver a better application experience, said James Lamberti, chief marketing officer for Applitools.

    Testing of graphical user interfaces (GUIs) is becoming more complex because the front-end of each application is increasingly made multiple microservices. Any change to the application requires developers to test each individual microservice and associated content that gets rendered on any number of platform. Applitools Eyes automates that testing process in a way that enables organizations to deliver applications faster without compromising the user (UX) experience, said Lamberti.

    “AI makes it easier to identify where the UX is broken,” he said.

    Much of the AI focus on DevOps these days tends to be on automating back-end testing. But Lamberti said it’s already been proven AI has a significant role to play in automating UI testing as well. To spur awareness of that requirement, Applitools also announced an Application Visual Management initiative, an attempt to create a new category of tools for visually testing graphical user interfaces.

    Lamberti noted that functional tests today are automated, and the visual elements of an application are still conducted manually. That invariably leads to errors that conspire to impede application release cycles no matter how much time and effort may have been invested in continuous integration and continuous delivery (CI/CD) processes.

    Applitools claims to have already executed almost 100 million visual tests using its visual AI engine to analyze billions of individual UX elements. Version 10 of Applitools Eyes adds improvements to the Layout Algorithm for dynamic content use cases as well as dashboards to make it easier to discover the root cause of a UI issue. Development teams, for example, can review visual test execution status and baseline status updates, bugs squashed and coverage levels specific to individual tasks and test assignments.

    Bugs discovered by Applitool Eyes can now also be programmed to automatically generate a ticket with a bug tracking tool such as Jira.

    In addition, integration with collaboration tools from Micro Focus as well as Slack is planned for March.

    Developers are often especially challenged when it comes to application usability. Application Visual Management may provide a much-needed framework for capturing UI best practices that would enable developers to avoid the same issue over and over by, for example, enabling a testing tool to make specific recommendations about where to place specific functions on a screen. There may even come a day when AI builds the application. In the meantime, when it comes to building applications end users will actually embrace regularly, most developers need all the help they can get.

    — Mike Vizard