Tag: observability

  • New Relic I/O Aims to Simplify Instrumentation

    New Relic I/O Aims to Simplify Instrumentation

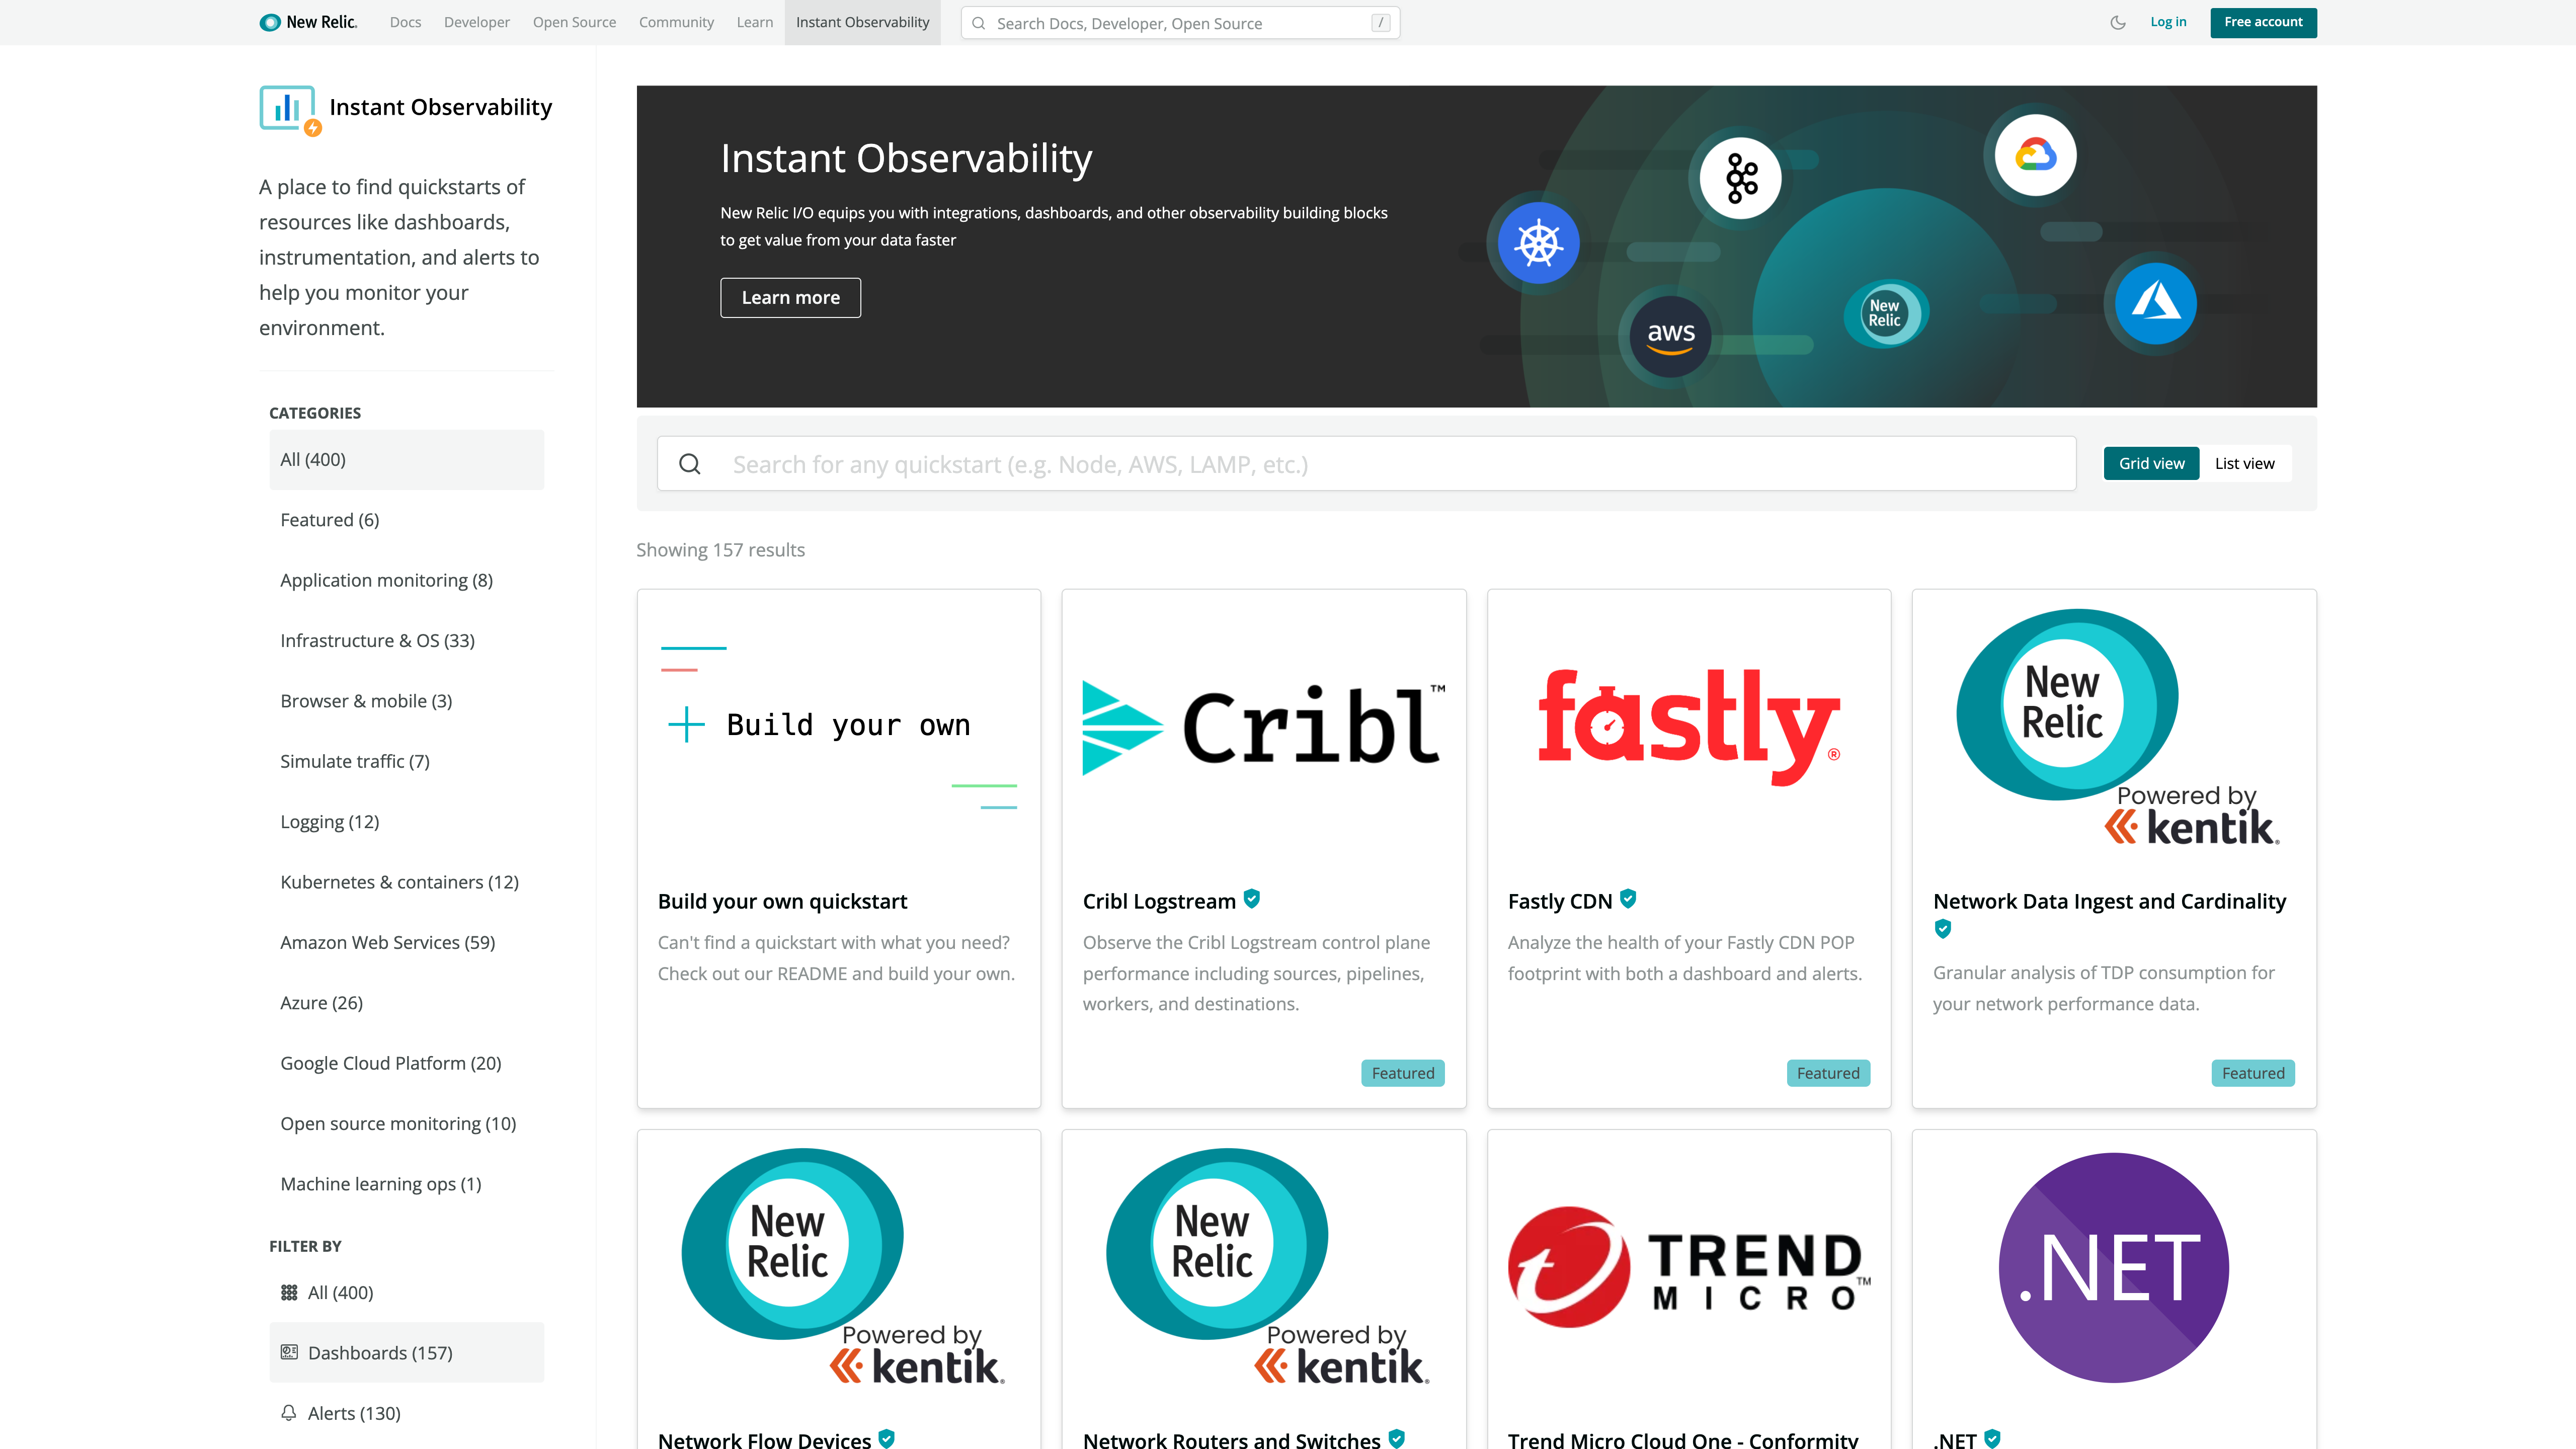
    New Relic today at the KubeCon + CloudNativeCon North America conference launched a New Relic Instant Observability (I/O) initiative through which it is making available open source tools to simplify application instrumentation.

    Marck Robinson, senior vice president for engineering at New Relic, said the catalog of tools will help DevOps teams instrument a much wider range of applications. New Relic will make those tools available as part of the free tier of its observability platform delivered via the cloud. DevOps teams will be able to use more than 400 pre-configured quickstarts to both instrument applications and create dashboards, Robinson said.

    New Relic itself is contributing quickstarts for cloud services, open source tools and platforms such as Kubernetes, Istio and Cassandra. Third-party vendors that have already contributed to the catalog include Cribl, Fastly, Gigamon, Kentik, Lacework and Trend Micro. Each contribution is being vetted by New Relic as part of an effort to foster the development of a larger open source observability ecosystem, noted Robinson.

    Robinson said overall, New Relic is trying to make it easier for DevOps teams to close an instrumentation gap that is impeding IT organizations from moving beyond monitoring to embrace true observability of their IT environments. The recent New Relic 2021 Observability Forecast report notes only a quarter of respondents (26%) have a mature observability practice, with the most commonly cited barriers to observability being a lack of resources (38%) and skills gaps (29%).

    As a result, DevOps teams often encounter a last-mile observability challenge when it comes to both instrumenting applications and then building their dashboards, said Robinson.

    As part of a larger effort to make it easier to instrument applications, New Relic has open sourced agent software, standardized on the OpenTelemetry tools being advanced under the auspices of the Cloud Native Computing Foundation (CNCF) and contributed the Pixie observability platform for Kubernetes environments to the CNCF.

    Observability in one some or another has always been a core tenet of any DevOps best practice. Initially, DevOps teams focused on continuous monitoring as the most effective way to proactively manage application environments. However, it can still take days, sometimes weeks, to discover the root cause of an issue. However, observability platforms are emerging that correlate events in a way that makes it easier for analytics tools to identify anomalous behavior indicative of a root cause of an IT issue. Armed with these insights, it becomes a lot simpler for IT teams to resolve issues faster.

    In contrast, monitoring focuses on predefined metrics to identify when a specific platform or application is performing within expectations. The metrics tracked generally focus on, for example, resource utilization. Observability, on the other hand, combines metrics, logs and traces—a specialized form of logging—to instrument applications in a way that makes it simpler to troubleshot issues without having to rely solely on a limited set of metrics that have been pre-defined to monitor a specific process.

    With the rise of microservices-based applications, the shift to the cloud and more end users than ever working remotely, the need for observability has never been more critical. The issue now is finding a way to make it much simpler to achieve.

  • New Relic Launches Industry’s Largest Open Source Ecosystem of Quickstarts and Partner Integrations to Help Every Engineer Embrace Observability in Minutes

    Company doubles down on open source commitment with New Relic Instant Observability, an open catalog of 400+ quickstarts to help engineers instrument, dashboard and alert their entire stack

    Leading enterprise technologies such as Cribl, Fastly, Gigamon, Kentik, Lacework and Trend Micro contribute to accelerate adoption of observability by all engineers

    San Francisco, CA – October 13, 2021 – New Relic (NYSE: NEWR), the observability company, today launched New Relic Instant Observability (I/O), an open source ecosystem of quickstarts to empower all software engineers to instrument, dashboard and alert their entire technology stack in minutes. As part of New Relic’s commitment to make observability an open, data-driven and daily practice for every engineer, New Relic I/O offers end-to-end integrations with 400+ cloud services, open source tools and enterprise technologies, contributed and maintained by the community. The launch features contributions from partners such as Cribl, Fastly, Gigamon, Kentik, Lacework and Trend Micro to bring the power of the world’s leading technologies to engineers everywhere, no matter the technology or use case. New Relic I/O is available as part of New Relic’s generous free pricing tier, so every engineer can get started without talking to sales or providing a credit card.

    According to New Relic’s 2021 Observability Forecast, while most engineers and developers are familiar with observability, there’s a huge gap in adopting the practice: only 26% of respondents have a mature observability practice, and the most commonly cited barriers to observability success are lack of resources (38%) and skill gaps (29%). New Relic I/O addresses this gap by introducing an ever-expanding, open ecosystem of knowledge-focused resources that codifies the collective experience of the world’s observability experts and practitioners to help engineers around the world unlock the power of their data faster. 

    Continuing New Relic’s Commitment to “Open” Observability 

    Today’s news reinforces New Relic’s commitment to making observability a daily best practice for every engineer by continuing their investment into the global open source community. In the last 12 months, New Relic open sourced 10+ years of agents R&D, standardized on OpenTelemetry, and contributed Pixie to the Cloud Native Computing Foundation (CNCF). New Relic I/O is the continuation of this strategy to dramatically reduce the barrier for engineers to embrace observability to plan, build, deploy and run the great software that underpins flawless digital experiences for their customers, employees, partners and suppliers. 

    “As part of our developer-first strategy and commitment to open source and open communities, we’re proud to introduce a new open ecosystem to help all software engineers embrace observability as a data-driven approach and daily practice through a vibrant community of telemetry data sources, dashboards and alert configuration quickstarts,” said New Relic CEO Bill Staples. “We’re honored to launch with an ever-expanding group of industry-leading partners who will help us honor our commitment to make observability available for all so every engineer can instantly observe any hardware or software systems, cloud service, SaaS, IoT device or application in seconds.”

    “Over the coming years we anticipate thousands of telemetry sources, pre-built dashboards and quickstarts will be curated from the engineering community and consumed by millions of engineers who need telemetry data to make better decisions across the software lifecycle. Only New Relic is committed to this kind of open ecosystem approach to observability,” added Staples.

    Unlike other exchanges that only focus on instrumentation, New Relic I/O introduces an open hub of 400+ quickstarts that moves beyond just instrumentation with pre-built dashboards, alert configurations, user guides and documentation to help software engineers get started with observability via a guided install process. Additionally, New Relic I/O is a community built by the world’s leading observability experts, and each contribution is reviewed by New Relic. Users and partners can easily add new contributions, improve existing quickstarts and provide suggestions to the quickstart repository at any time.

    Access Instant Observability for Leading Partner Technologies

    As part of New Relic’s commitment to providing open observability, the launch features quickstart contributions from Cribl, Fastly, Gigamon, Kentik, Lacework and Trend Micro to enhance the understanding of application performance in the context of every engineer’s daily workflow. Additionally, New Relic is introducing quickstarts for cloud services, open source tools and enterprise technologies, including Kubernetes, Istio, Apache and Cassandra, so every engineer can get a customized observability view based on their preferred tools and specific use case. 

    • Cribl is the observability pipeline company that lets customers parse and route any type of data. The Cribl quickstart allows you to get immediate visibility into your entire environment right from New Relic One without the need to create your own dashboards and alerts—simplifying your workflows and reducing time to value.
    • Fastly is an edge cloud platform that enables its customers to create great digital experiences quickly, securely, and reliably. With the Fastly CDN quickstart, you can monitor key metrics from Fastly’s content delivery network that can help you improve service reliability and ensure great online experiences for end users.
    • Gigamon is the cloud visibility company. The Gigamon Hawk hybrid-cloud visibility and analytics platform provides access to – and extracts intelligence from – all network traffic. The Gigamon quickstart delivers advanced security capabilities that offer network detection and response to advanced threats, including shadow IT activities, crypto-mining and torrent activities, SSL cipher versions and expiration dates across both managed and unmanaged hosts, such as IoT/OT and containers.
    • Kentik is the network observability company. The Kentik quickstarts help network and development teams quickly identify and troubleshoot application performance issues correlated with network traffic performance and health data.
    • Lacework is a data-driven security platform for the cloud that can collect, analyze, and accurately correlate data across an organization’s AWS, Azure, GCP and Kubernetes environments, and narrow it down to the handful of security events that matter. The Lacework quickstart bridges the gap between observability and security teams, and integrates with New Relic’s database to surface security events and alerts directly in New Relic One. 
    • Trend Micro is a global cyber security leader. The Trend Micro Cloud One quickstart ingests Cloud Security Posture Management (CSPM) data from Conformity into New Relic One to contextualize and correlate it with workload telemetry data, delivering AI-powered visualizations and quick insights. This allows security and cloud teams to immediately take action in improving their security and compliance postures.

    “Cloud security has the same core tenants as observability—organizations need speed, automation, and context. Whether you’re proactively identifying vulnerabilities or trying to find the root cause and impact of a breach, you need to streamline as much as possible,” said Lacework President and CRO Andy Byron. “Our cloud security solution coupled with New Relic’s comprehensive observability capabilities provides our joint customers with a seamless and consistent experience between DevOps and security use cases. Together we’re bridging the gap between software delivery and security—providing deeper visibility, shared context and efficiency—all while not inhibiting your development speed.”

    New Relic Instant Observability is generally available today as part of the New Relic One platform. Users can browse all quickstarts in New Relic I/O today. For more information, visit newrelic.com or read our blog.

    Comments on the News

    Clint Sharp, co-founder and CEO at Cribl

    “Enterprises today are caught between the fleets of existing deployed agents, dozens of next-generation and legacy protocols, and their dreams of ubiquitous observability. With our partnership with New Relic, customers can easily onboard data from anywhere into New Relic – giving them full visibility to observe and secure every application.”

    Simon Wistow, co-founder and vice president of strategic initiatives at Fastly

    “Fastly is uniquely built to offer greater control and reliability, supporting faster sites and apps, high-quality streaming and real-time visibility—all in our agile, API-first platform. With Fastly’s powerful edge cloud and New Relic’s industry-leading cloud-based observability platform, businesses can correlate data from all other services to get a holistic, real-time view of their network while developers get the tools they need to build and deploy the most groundbreaking apps—all optimized for speed, security and scale.”

    Michael Dickman, Chief Product Officer at Gigamon

    “We share New Relic’s vision for an open ecosystem empowered by rich telemetry. Gigamon extends this vision to security use cases for hybrid- and multi-cloud infrastructure. By providing 5,000+ metadata attributes, for example, customers enhance their full security stack to go deep into the application communications of VM, container, and bare metal workloads. New Relic quickstarts make it easy to visualize Gigamon flow and metadata, complementing log- and metric-based observability. Gigamon ThreatINSIGHT completes the picture by using this network visibility to detect, investigate, and respond to threats from crypto-mining to beaconing.”

    Avi Freedman, co-founder and CEO at Kentik

    “The lack of integrated application and network observability continues to claim a high toll in latency and downtime. Even the companies with well-budgeted IT teams are exposed to user experience impact when they do not have a unified view of their environments. Through our expanded partnership with New Relic, we’re helping network and development teams quickly identify and troubleshoot application performance issues correlated with network traffic, performance and health data, and ultimately make services more reliable.”

    Wendy Moore, vice president of product marketing at Trend Micro

    “Architecting a security observability strategy is becoming increasingly important as cloud builders rapidly take advantage of high-velocity cloud architectures. By leveraging our security services platform with New Relic One, we are providing our joint customers comprehensive visibility into their cloud risk posture, providing valuable insights to respond better to vulnerabilities.” 

    About New Relic

    The world’s best engineering teams rely on New Relic to visualize, analyze, and troubleshoot their software. New Relic One is the most powerful cloud-based observability platform built to help organizations create more perfect software. Learn why developers trust New Relic for improved uptime and performance, greater scale and efficiency, and accelerated time to market at newrelic.com.

    Forward-looking statements

    This press release contains “forward-looking” statements, as that term is defined under the federal securities laws, including but not limited to statements regarding the availability and access to New Relic I/O, and our expectations of the increase in telemetry sources, prebuilt dashboards and quickstarts that will be curated from the engineering community over the coming years,  including any anticipated benefits, results and future opportunities related thereto. The achievement or success of the matters covered by such forward-looking statements are based on New Relic’s current assumptions, expectations, and beliefs and are subject to substantial risks, uncertainties, assumptions, and changes in circumstances that may cause New Relic’s actual results, performance, or achievements to differ materially from those expressed or implied in any forward-looking statement. Further information on factors that could affect New Relic’s financial and other results and the forward-looking statements in this press release is included in the filings New Relic makes with the SEC from time to time, including in New Relic’s most recent Form 10-Q, particularly under the captions “Risk Factors” and “Management’s Discussion and Analysis of Financial Condition and Results of Operations.” Copies of these documents may be obtained by visiting New Relic’s Investor Relations website at http://ir.newrelic.com or the SEC’s website at www.sec.gov. New Relic assumes no obligation and does not intend to update these forward-looking statements, except as required by law.

  • Why an Embedded Analytics Maturity Framework is Essential

    Why an Embedded Analytics Maturity Framework is Essential

    Contextual analytics, or embedding analytics directly into a business application’s transactional environment and core workflows, is the most sophisticated stage of business intelligence (BI) currently available to organizations today. It is one level ahead of the traditional integration of analytics, which is a standalone capability presented as a separate dashboard or reporting module.

    Today, there is an increasing shift among organizations toward embedding transactional analytics into their enterprise applications. Because contextual analytics is the most advanced option in the market, there is also an increasing need for assessing our analytics readiness first.

    The fundamental difference of contextual analytics lies in how it offers analytics to the user to explore data or derive insight within their transactional environment rather than accessed as an external tool. This approach requires a deeper evaluation of the product’s analytical maturity level using a formal framework. Having such a framework can act as a deployment guide for your developers for every stage of embedded BI implementation, including contextual analytics.

    But first, what makes contextual analytics so different that it necessitates a readiness evaluation?

    Contextual Analytics Vs. Embedded Analytics

    With contextual analytics, dashboards, reports and charts are no longer separated but are part of the main user experience. This integral change necessitates a closer look at your data and integration capabilities to align what it brings with all aspects of your software, including existing analytics.

    Embedding these elements directly into core software workflows isn’t a replacement for any existing analytics, but is instead another big step toward making data and analytics a more seamless part of your end users’ everyday work.

    It should be stressed that contextual analytics accommodates various levels of implementation and business requirements. Analytics can be embedded lightly, such as in the form of basic in-line charts and graphs users can see as they explore your software, or embedded deeper to offer AI-assisted insights and real-time alerts that trigger action from users while they work. It can be integrated with an experienced BI vendor partner or in-house if you possess the skill set internally.

    Avoidable Pitfalls of an Improvised Approach

    The need to assess your application’s analytical maturity and readiness for embedding analytics directly into the transactional workflow comes down to avoiding unnecessary BI roadblocks. 

    For many organizations, BI and analytical capabilities are traditionally lower in priority than other aspects of the software. Intending to add BI features later is well-meaning and understandable, but leaving developers to add in features intermittently and leaving it to your users to demand them when needed creates an issue of visibility. Vendors typically lose sight of what their application currently is capable of analytically, or what development needs to make the addition of a new feature not only technically achievable but worth the time and cost investment.

    If you take the time to reassess your application’s analytical capability, your developers and leaders can better understand that your product could be at an earlier stage of readiness than previously believed, and prepare accordingly before seeking out a contextual or other BI solution.

    For example, approaching contextual analytics ad-hoc could mean you find an unexpected older dashboard module, a cost that could have been accounted for in a formal maturity assessment. 

    What it comes down to is this: Implementing a basic dashboard module or data export feature, completely separate product features, is fundamentally different from fully embedded analytics in your users’ core workflow experience. Pursuing a formal evaluation to guide the introduction of contextual analytics—or even a form of embedded analytics at an earlier stage—means your users and product receive the best type of analytical capability your business is ready for today.

    The Five Stages of Embedded Analytics Maturity

    Based on our experience, there are five possible stages of product development, as illustrated in the embedded analytics maturity curve below. As contextual analytics is the final, most advanced stage of an embedded analytics integration available to product owners, the need for a formal assessment of maturity is most important, should it be the target state.

    Accelerating the implementation of contextual analytics comes down to your skillset, which will allow you to identify and evaluate your state of readiness accurately and determine a BI solution’s flexibility. If you do not have the internal expertise, implementing contextual analytics is easier with the help of specialized BI vendors that can help you in your assessment, and offer a contextual analytics platform built around openness. We recommend you look for vendors and partners that allow for:

    • Advanced APIs that lower total integration time and ensure the need to rearchitect the software is minimal to zero.
    • Customized experiences to make your desired contextual linkages, such as showing a user a relevant embedded chart when they click on a table of a client, possible.
    • An open platform that allows for options for on-premises, cloud, multiple operating systems that guarantee long-term security, scalability and flexibility with your analytics.
    • Rapid adaptation to your product development roadmaps with automated processes and administrative tools to lower total cost of ownership
    • White-labelling to make the rebranding and blending of the analytical solution and your native application components seamless.

    Ultimately, having an awareness of your product’s readiness and taking the time to examine your application’s current state means you avoid costly integration mistakes, save time and ensure developers implement the best solution according to your exact needs now.

  • Sumo Logic Extends Observability Scope and Reach

    Sumo Logic Extends Observability Scope and Reach

    During the online Illuminate user conference, Sumo Logic revealed how it is integrating capabilities it gained with the June 2021 acquisition of Sensu, a provider of open source monitoring tools, with its continuous intelligence platform in addition to adding support for data collected via open source OpenTelemetry software.

    Sensu Go, a set of tools for implementing monitoring-as-code, is now a core part of the Continuous Intelligence Platform. The company is also now making available in beta Sumo Logic OpenTelemetry Distro and Ecosystem Support, a single agent through which all logs, metrics and traces can be collected from instrumented applications. Sumo Logic is also supports the AWS OpenTelemetry Distro, an offering from AWS that provides similar capabilities. Sumo Logic has also increased the capabilities of Sumo Logic Free to include monitoring-as-code tools created Sensu.

    Bruno Kurtic, vice president of product and strategy, said as responsibility for managing applications shifts left toward developers it’s critical to provide observability capabilities that can be programmatically infused into applications. As part of that effort, Sumo Logic is now also offering Sensu Plus, which provides access to an analytics engine for the data the platform collects.

    Sumo Logic is also adding machine learning algorithms to provide more context to the alerts the platform generated via an Alert Response feature that is part of the core platform.

    The company is also adding support for the operator software that Red Hat created to make it simple to deploy Sumo Logic Continuous Intelligence Platform alongside the Red Hat OpenShift platform for building and deploying applications on top of Kubernetes clusters. In addition, Sumo Logic is also providing integration with a total of 38 either new or updated observability applications that integrate with a wide range of third-party platforms.

    Finally, Sumo Logic is extending the security observability platform it provides based on its platform to add support for containers and serverless computing functions alongside virtual machines and integrations with third-party endpoint detection and response (EDR), network detection and response (NDR), threat intelligence and managed detection and response (MDR) platforms. The company has also added or updated 26 applications for specific third-party platforms.

    Kurtic said Sumo Logic makes it possible for developers and IT operations teams alike to observe an IT environment on an end-to-end basis via a single pane of glass. In some cases, the members of an IT operations team will require a user interface to manage that environment. Developers, meanwhile, might prefer an application programming interface (API) through which observability data is made accessible from within a continuous integration/continuous delivery (CI/CD) platform.

    Regardless of the type of user, however, IT teams should not have to hire their own data science team to analyze observability data. Instead, the observability platform should embed machine learning algorithms that surface all the benefits of data science without the need to hire additional headcount, he said.

    One way or another, DevOps teams will soon routinely benefit from the additional levels of context that observability platforms provide. The challenge will then be determining how best to fix a raft of issues that many DevOps teams today simply didn’t know existed.

  • Harnessing the Value of Log Data Analytics

    Harnessing the Value of Log Data Analytics

    Each day, the average enterprise’s cloud applications, containers, compute nodes and other components throw off millions of tiny logs. Each log is a file whose data describes an event such as a user action, service request, application task or compute error. Logs also capture messages that applications and other components send to one another.

    There’s a wealth of information and value hidden in those logs, which is why businesses are so keen on using them to address business needs like customer engagement, IT security and cloud operations. 

    The need for understanding and managing this data is so high that Markets and Markets valued the market for log analytics data at $1.9 billion in 2020. Analysts predict this to grow to $3.7 billion by 2025. It’s not just the sheer growth of data driving this market—it’s also the demand to gain business insights. 

    That’s why ChaosSearch recently conducted a survey to better understand how businesses are currently using and managing their log data. Insights were collected from practitioners at 50 medium-to-large enterprise organizations. What the survey found is that organizations see a lot of value from tapping into their log data to achieve better outcomes across both business and IT functions. That said, these practitioners face challenges handling the scale requirements and they know there are still more opportunities for them to expand the scope and discipline for log management.

    Top Use Cases

    This study confirmed that businesses are using log data in a number of ways, spanning both business and IT functions. We see that more than 90% of respondents are using log management and analytics for at least two primary use cases. It’s not surprising that the top use cases for log management are security (70%) and IT monitoring (68%), but many are prioritizing BI & analytics (46%) and business operations (28%) as well.  


    It’s interesting to look more closely at the security use cases: Investigations (45%) and insider threats (45%) top the list of SecOps uses for log data. Audits and compliance (32%), threat hunting (32%) and anomaly detection (30%) also made the list. 

    Growing Desire to Support Business Operations

    We also saw that these practitioners want to use log data to support business operations—specifically to drive better business outcomes and improve competitiveness. For example:

    1. A global industrial equipment manufacturer attached IoT devices to farm equipment to track weather, temperature, humidity, time of day, depth of planting, soil conditions, seeds planted and geo-routing on farms. This raw data is continually collected and analyzed within the central log analytics solution, thereby allowing the vendor to deliver farm productivity reporting and recommendations back to their clients.
    2. A biopharmaceutical firm tracks cell culture logs with alerts on temperature and humidity. The company uses its log analytics platform to store long-term data to run queries that help in hypothesis testing. They also conduct various long-tail analyses that reveal trends and allow scientists to make informed decisions about future experiments. 
    3. A large online retailer leverages log data from web visits and other customer activities to develop 360-degree profiles of customers and analyze the steps in the “customer journey” to identify opportunities for improved efficiency and increased revenue capture.

    Tackling Challenges of Growth and Complexity

    Even with more interest in using log data for security and business operations, the surveyed practitioners called out a range of challenges. The top three being: Complex infrastructure (48%), managing costs (42%) and managing growth (34%). They also said the lack of centralization, reporting and data quality were problems. These challenges are perhaps exacerbated by the expectation that data will continue to grow and data retention will increase. 


    There are a lot of variables that drive the volume of log data generation, like the number of users, devices, applications, IT environments and infrastructure elements. The survey found two things were universal—data growth rates are high and are a source of pain and data retention is an increasing priority. 

    Among the participants, 94% ingest at least one TB or more of data per day, with 18% in the 10TB + range. Consider this—the average daily ingest volume for these companies was 7.9 TB! 

    The problem is, despite the massive amounts of data being ingested daily, only 28% of respondents are capturing 80% of log data or more today. And 78% believe that capturing more than 80% of log data is ideal. That’s a big gap. 

    Practitioners Rate Most Important Log Management Capabilities

    We also learned that these practitioners are generally satisfied with their existing solutions, but many of them still expect to bring in a new solution for log management and analytics within the next three years. That’s because they want better scale and a cloud-native solution. 

    When we asked about important capabilities for a log management platform, scalability (58%), resilience (54%) and advanced analytics (52%) topped the list. 


    Budgets Increase to Meet Demand for Log Analytics

    To address these challenges and opportunities before them, survey respondents are growing their budgets; 86% anticipate their budgets will grow by at least 20% and 36% expect an increase of 50% or more. These budgets will not only support more data capture and increase retention periods but also help them go after the growing use cases for supporting the business. In fact, 68% said they expect the number of use cases to grow in the next 12 months.

    There is no doubt: Companies who value log data and invest in capturing data will harness insights that will propel their businesses forward.

  • LogDNA Previews Streaming Module for Observability Platform

    LogDNA Previews Streaming Module for Observability Platform

    LogDNA is making available on a limited basis the ability to process streaming data to its observability platform as part of an effort to give DevOps teams more control over log data.

    Tucker Callaway, LogDNA CEO, said the data ingestion pipeline that LogDNA already provides can ingest, parse and normalize massive amounts of structured and unstructured log data. LogDNA Streaming adds the ability to automatically send log data to any application or analysis tool.

    That capability also helps reduce storage costs by limiting the number of copies of log data that might otherwise be created, he added.

    LogDNA also expects that DevOps teams will also be able to analyze data in flight as part of an effort to make it simpler to surface issues even before log data is stored, noted Callaway.

    While there are multiple streaming data platforms available, Callaway said LogDNA opted to build one on its own to meet the requirements of an observability platform. Ultimately, the goal is to shift observability left at the data level to provide more granular insights in real-time, he said.

    That capability will also lay the foundation for a wide range of autonomous processes that would be driven by the observability data collected via LogDNA, added Callaway.

    LogDNA

    Observability has always been a core tenet of any DevOps best practice. Most DevOps teams typically focus on some form of continuous monitoring to more proactively manage application environments. However, it can still take days, sometimes weeks, to discover the root cause of an issue. Monitoring tools are designed to consume predefined metrics to identify when a specific platform or application is performing within expectations. The metrics tracked generally focus on, for example, resource utilization.

    Observability combines metrics, logs and traces—a specialized form of logging—to instrument applications in a way that makes it simpler to troubleshot issues without having to rely solely on a limited set of metrics that have been pre-defined to monitor a specific process or function. DevOps teams can more easily employ queries to interrogate data in a way that makes it easier to discover the root cause of an issue. An observability platform correlates events in a way that makes it easier for analytics tools to identify anomalous behavior indicative of an IT issue.

    It’s now only a matter of time before providers of the platform widely employ machine learning algorithms to analyze machine data faster. There may even come a day when so-called “war room” meetings—that today need to be convened to identify the cause of an IT issue via a painstaking process of elimination—are no longer required.

    In the meantime, the percentage of applications that are instrumented in an IT environment needs to increase to achieve that goal. Fortunately, thanks to the rise of open source agent software, the cost of instrumenting applications is starting to decline. At the same time, DevOps teams should expect to see a marked increase in the volumes of incoming data, and they will need to find somewhere to store that data as well as determine the length of time it should be retained.

  • Sentry Integrates Code Observability Tool with GitHub, GitLab

    Sentry Integrates Code Observability Tool with GitHub, GitLab

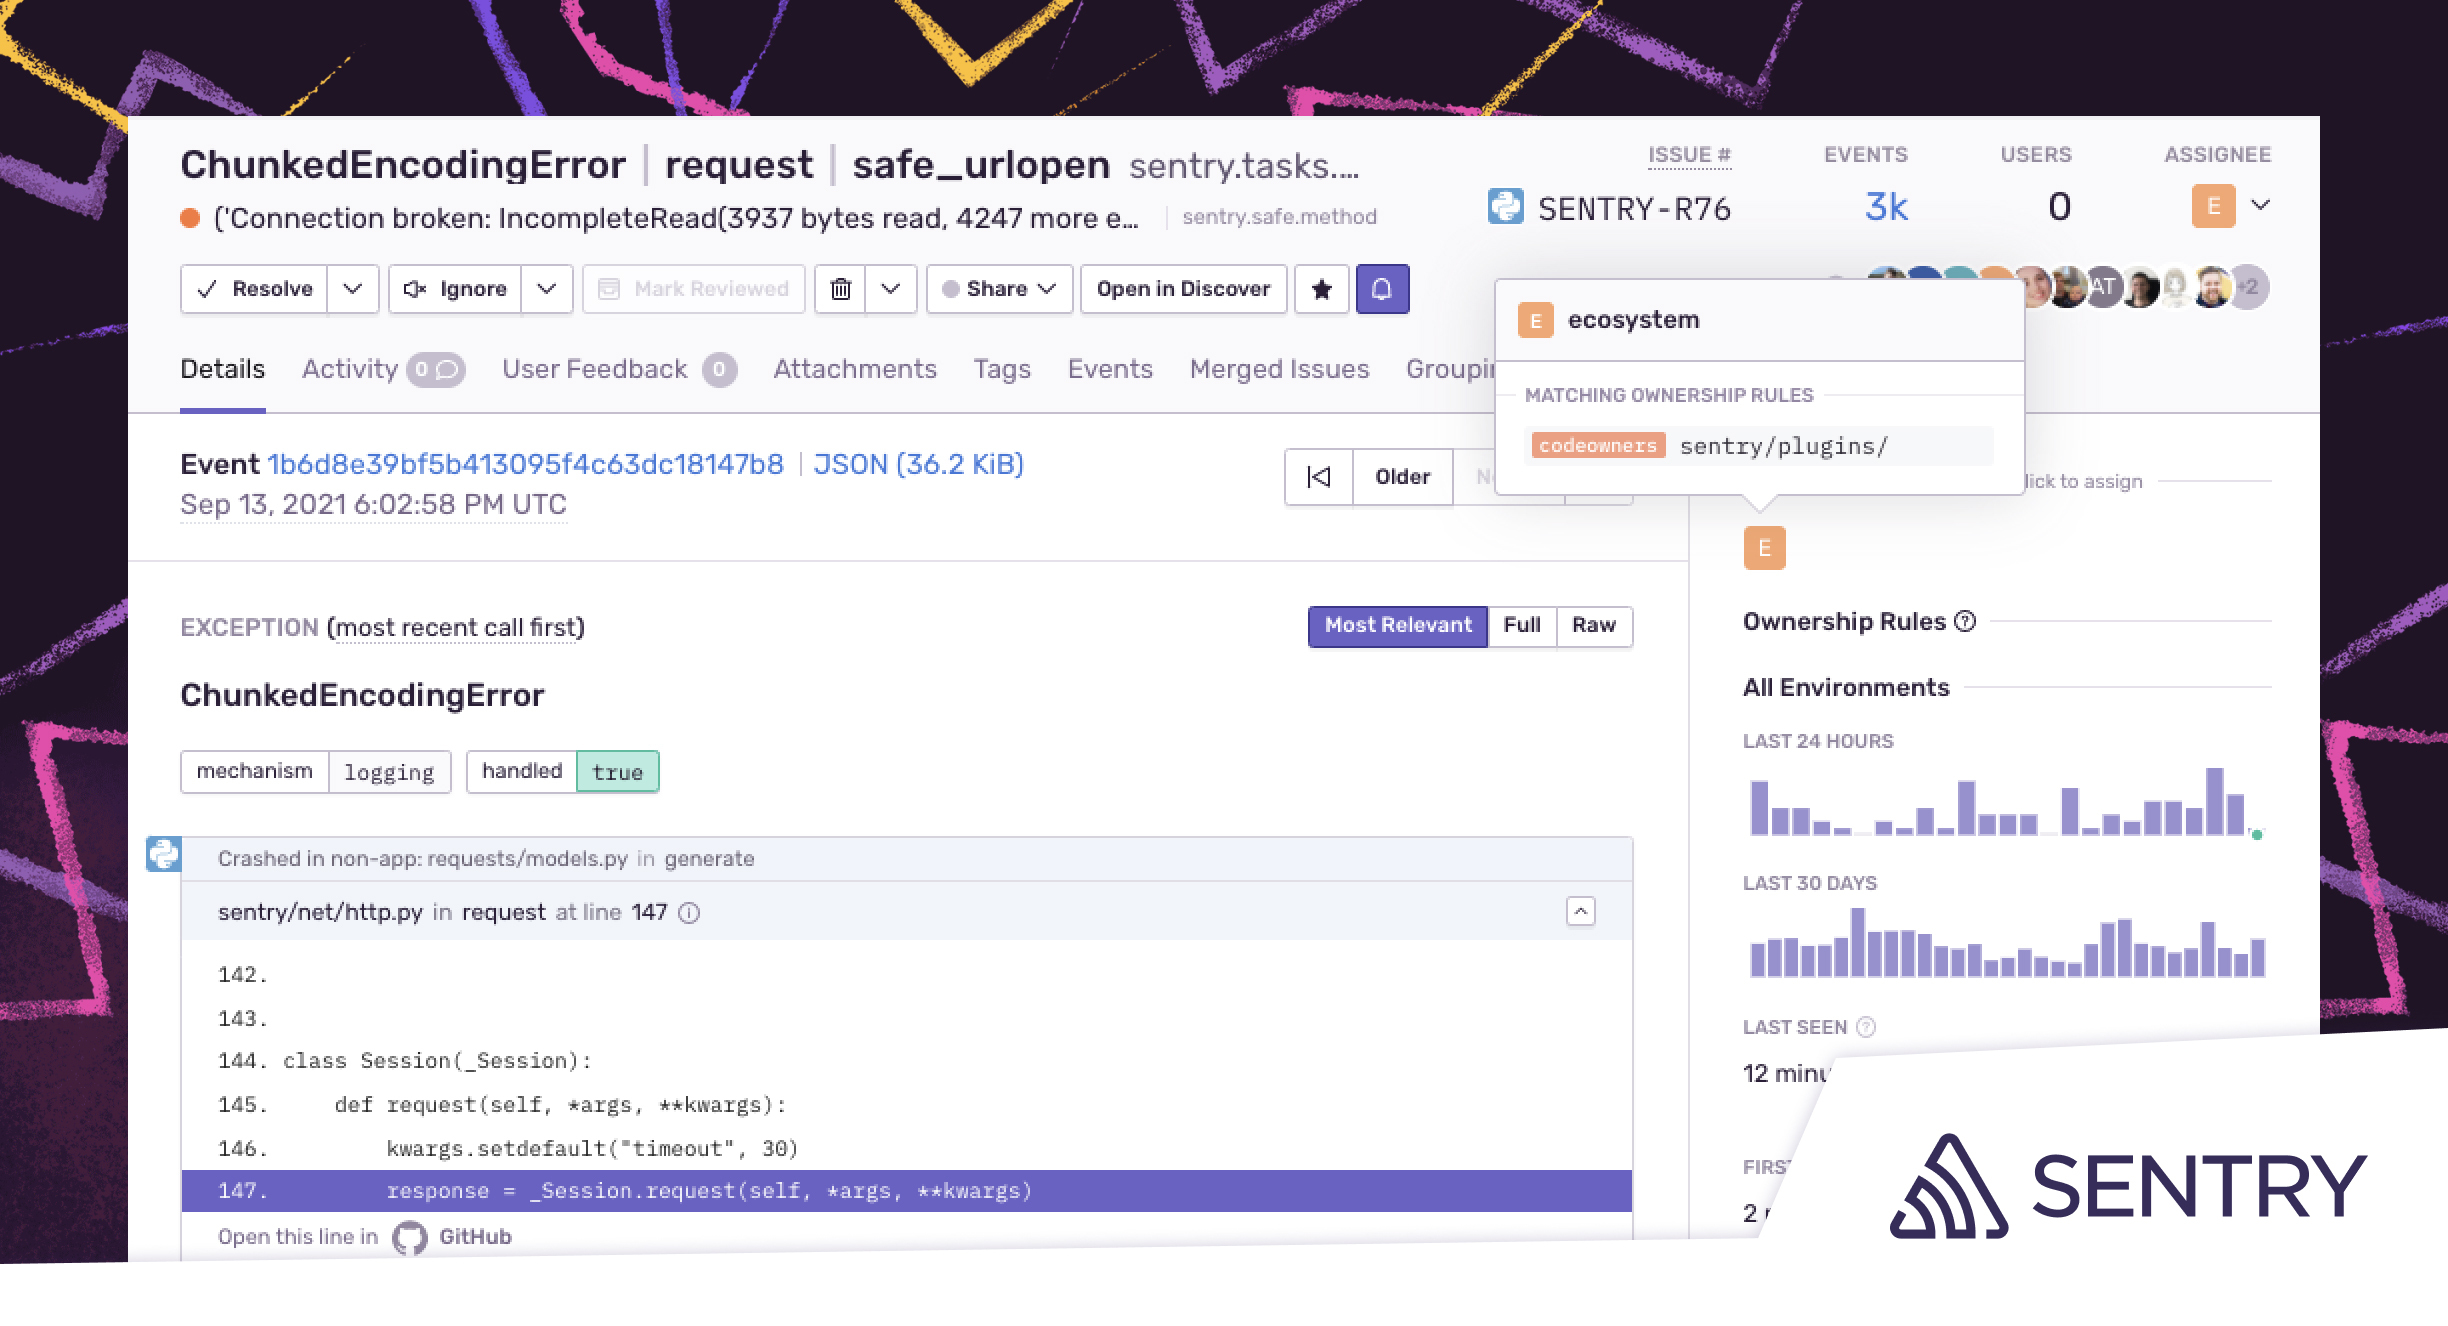
    Sentry this week extended its namesake observability platform for code to provide tighter integration with the DevOps platforms provided by GitHub and GitLab.

    Application development project managers can now assign issues to DevOps teams by integrating directly with the CODEOWNERS file in GitHub or GitLab. Error messages, for example, can now be automatically routed to individuals or teams that own the code via notifications in Slack.

    IT teams can now also identify and prioritize issues based on user impact by setting alerts based on when an issue exceeds a certain percentage of user sessions within a specific amount of time.

    Sentry CEO Milin Desai said that the percentage-based approach to alerts reduces the overall noise being generated in a way that enables DevOps teams to better prioritize their remediation efforts.

    Finally, Sentry has added an integration with the Okta identity management platform to make it possible to automatically provision and de-provision users and teams using the system for cross-domain identity management.

    As more responsibility for managing the application environment shifts left toward developers, there needs to be a way to streamline communications between developers and the rest of the IT operations team, noted Desai. Most developers today already spend less than one-third of their time writing code.

    The Sentry platform is already used by more than 75,000 organizations to enable developers to better observe and analyze code behavior. The company is now moving to bridge the divide between developers and site reliability engineers (SREs) by streamlining communications and workflows, noted Desai.

    As the responsibility for managing applications shifts left, developers don’t necessarily want to use the same tools that IT operations teams have relied on for years. Most developers want to be able to troubleshoot their applications with minimal interaction with IT operations teams.

    Historically, IT operations teams have relied on application performance management (APM) platforms to manage IT operations. Those platforms are now evolving into observability platforms that promise to provide more context by correlating events as they occur across both applications and IT infrastructure platforms. That approach, however, typically requires developers to insert agent software into their applications. Once inserted, that agent software needs to be maintained and updated, added Desai.

    The Sentry approach provides developers with a tool for collecting data from an application in a way that consumes just tens of kilobytes of memory after being embedded directly within an application. That approach eliminates the need to rely on much larger agent software to achieve observability of application code. Developers can then diagnose and possibly remediate issues in code without ever having to create a ticket asking a DevOps team to investigate an issue.

    Regardless of how developers go about instrumenting their applications, most everyone in IT agrees that the current state of observability needs to improve. The issue now is determining how best to achieve that goal in a way the benefits both the DevOps team and the developers that are now being asked to not just write code but also manage the entire application life cycle.

  • New Relic Survey Shows Greater Appreciation for Observability

    New Relic Survey Shows Greater Appreciation for Observability

    A global survey of 1,300 software engineers, developers, IT leaders and executives found half of respondents (50%) are in the process of implementing an observability platform. Another 23% of respondents said that they cannot gain end-to-end observability at all, while 26% said they believe they have mature observability practices in place. The survey, published today, was conducted by CITE Research on behalf of New Relic.

    The majority (94%) of IT professionals said observability is important for their job role, while nearly three-quarters (74%) said there is still room to grow their observability practice. In fact, 81% of the 450 C-suite executives that participated in the survey said they expect to increase observability budgets in the next year, with 20% expecting those budgets to increase significantly.

    Overall, the survey finds that lack of resources (38%), skills (29%), understanding of the benefits (27%) and strategy (26%) are top barriers to achieving observability.

    Observability, in one form or another, has always been a core tenet of DevOps best practices. Most DevOps teams have relied on monitoring tools to observe a specific process or function. The challenge is those monitoring tools track a pre-defined set of metrics such as resource utilization. Ideally, observability combines metrics, logs and traces—a specialized form of logging—to instrument applications in a way that makes it simpler to troubleshot issues without having to rely solely on a limited set of pre-defined metrics.

    Nearly three-quarters of respondents (72%) noted that IT teams today need to toggle between at least two different tools to manage IT, with 13% having to use more than ten different tools to monitor the health of their systems.

    In contrast, observability platforms make it possible to correlate events across both applications and infrastructure. This capability makes it easier for analytics tools to identify anomalous behavior indicative of the root cause of an IT issue. Armed with these insights, it becomes a lot simpler for IT teams to resolve issues faster.

    The New Relic survey notes that 60% of respondents still monitor telemetry data at the application level, which indicates that a massive amount of valuable telemetry data is largely going unused. A full 91% of IT professionals that responded to the survey noted that observability is critical at every stage of the software life cycle, especially when it comes to planning and IT operations.

    Top benefits cited include faster deployments (27%), more cost-effective use of IT resources (25%), better digital experiences (23%) and improved productivity (22%). The top use cases cited involved digital transformation initiatives (42%) followed by cloud optimization (37%), DevOps processes (36%) and bringing products to market faster (36%).

    Buddy Brewer, group vice president and general manager for New Relic, said observability will become a more pressing issue in IT environments, thanks to the rise of microservices-based applications running on Kubernetes. A full 88% of IT decision-makers New Relic surveyed said they are exploring Kubernetes and containers at some level right now, but only 10% said they have deployed them in a production environment. A total of 40% expect to be in production within three years.

    In general, it’s become critical for IT teams to be able to query data in real-time to resolve issues that are becoming more challenging to resolve at a time when organizations have never been more dependent on IT. Sampling data in the hopes of discovering issues is no longer sufficient, noted Brewer.

    The challenge, of course, is that most IT teams have been using legacy monitoring tools for so long that it’s still hard to imagine there might be a better approach. That doesn’t necessarily mean all those legacy tools will be immediately replaced, but it does mean many of them may simply fade away over time.

    One way or another, most IT teams will soon be able to observe IT environments more deeply. Developers increasingly are taking advantage of open source tools like OpenTelemetry to instrument applications in a way organizations can more easily afford, regardless of whether they fully appreciate the nuances of modern observability versus traditional monitoring.

  • 4 Ways to Simplify Cloud Performance Monitoring

    4 Ways to Simplify Cloud Performance Monitoring

    Over the past 18 months, technologists across the globe have played a crucial role in the survival of brands and organizations via digital strategies. Across all industries, their skill and dedication have enabled businesses to rapidly launch innovative new digital services to meet huge fluctuations in customer needs and allow entire workforces to operate from home during the pandemic.

    This hasn’t been easy, even as end users’ expectations for seamless digital experiences are on the rise. In fact, the recent 2021 App Attention Index reaffirmed found 76% of consumers’ expectations of digital services have increased in the last year. And an overwhelming 85% noted that applications and digital services have become a critical part of their daily lives. This has placed even greater pressure on the technologists who are responsible for keeping applications and cloud experiences running smoothly.

    Often IT teams are challenged with monitoring companies’ digital services, but they lack the visibility they need to monitor health and performance across an increasingly sprawling IT estate, exacerbated by a seismic shift toward cloud architectures over the last 18 months. IT departments don’t yet have the right tools and data to optimize health and performance in their cloud environments.

    As a result, technologists are constantly addressing the same issues because they can’t easily isolate and identify them, and don’t know where to prioritize their actions. Hiccups can lead to brands losing customers—the same report revealed that over half of consumers indicated that brands have one shot to impress them, and that if their digital service does not perform, they won’t use them again.

    After a year and a half since the start of the pandemic and with adoption of cloud technologies set to accelerate even further over the next few years, it’s time for technologists to get ahead. Here are four things technologists can do to take the stress out of managing performance across the cloud.

    Implement Visibility from the Ground Up

    Having visibility into applications and the underlying cloud infrastructures that support them can be challenging without the right tools, which has contributed to some of the pressure technologists are experiencing. Traditional monitoring has allowed technologists to identify and catch issues in certain areas of an IT stack, but this approach is of little use in dynamic, distributed and software-defined environments where organizations are continually scaling their use of IT and the cloud up and down.

    As a result, the performance of the digital services can be impacted, potentially hurting end-user experience and eroding trust in the brand.

    To keep up with the rising demands from consumers in the digital world, technologists need the ability to monitor the full IT estate, from cloud infrastructures to customer-facing applications through to core infrastructure such as compute, storage and network; including the open web and security. With access to tools like observability platforms, technologists can lessen the burden of individually monitoring the performance of each item supporting the digital service. Instead, they can achieve one holistic view into alerting, root cause and analysis of correlated metrics, events, logging and tracing (MELT) data from the cloud to enable early and easy troubleshooting.

    Consider tools that link infrastructure (compute, storage and network) with the services and applications they execute. When there is an application-level issue, it is easy to take a closer look and identify problematic areas in what makes the application run or the application itself.

    Align IT Performance to Business Results

    After aggregating a full-stack view of applications and the cloud infrastructure behind them, technologists can then link performance data identified by the observability platform with real-time business metrics.

    Linking the two provides technologists with the ability to identify where and how the digital services are impacting the business and end-users. Full-stack observability automatically provides technologists with these linked insights, enabling them to address the areas that matter most.

    Educate Teams

    In addition to having the right tools to help take advantage of the cloud, it is important that an IT team is well-versed in the technology itself. Managing the performance of the cloud is complicated and there is a finite pool of talent available to businesses. Therefore, business leaders should provide appropriate resources to ensure teams are educated and equipped to succeed.

    To support a seamless implementation of cloud infrastructure to support a business’ digital services, business leaders must invest in upskilling their teams or recruit others who are knowledgeable about cloud monitoring.

    This will ease the pressure on existing teams and give technologists the skills and confidence to progress in their careers.

    Leverage Automation

    Even with the best observability solutions in place and teams equipped with the necessary skills, there is still concern that there will be an overwhelming amount of data generated by accelerated digital transformation over the coming years, especially those involved in large-scale public cloud environments. It can become a challenge for technologists to dedicate the level of resources and skills required to manage and optimize performance across the IT estate.

    To avoid these potential circumstances in the future, it’s worth considering how to minimize the impact of a data deluge by reducing an IT department’s reliance on manual interventions to monitor health and performance and resolve issues.

    Two things that will play an increasingly vital role in tracking health and performance across the entire IT estate are automation and AI. This is particularly the case in large-scale public cloud environments, which are fast becoming the biggest headache for some IT teams.

    With AI deployment to identify and fix issues in real-time, technologists can spend less time firefighting thanks to the AI/ML guiding hand. This will lead to increased job satisfaction and fulfillment and a better work-life balance.

  • The Key Benefits of Observability for SREs

    The Key Benefits of Observability for SREs

    In today’s technology landscape, organizations strive to champion innovative ideas, techniques and technologies to achieve success and outshine their competitors. For this reason, site reliability engineering (SRE) has become one of the fastest-growing enterprise roles and a set of organizational practices for fast and reliable software delivery. 

    SREs use various tools and practices at their disposal to manage services at scale, such as observability. Observability is the ability to infer a system’s internal state(s). It provides actionable insights into when errors occur within a system and, more importantly, why they occur. For SREs, this actionable data can be important to providing secure and reliable applications. 

    To gain more insights into the benefits of observability for SREs, I asked SKILup Day participants and DevOps Institute Ambassadors to weigh in. Here’s what they shared: 

    Sponsor, Priya Satheesh, CEO, Instana 

    “As their name implies, site reliability engineers are tasked with keeping the applications, architectures and websites up and available. Observability solutions put alerts in front of them at the first indications of trouble, with proper context and information so they can take action before issues become incidents and start affecting their customers. In addition, AIOps and machine learning help them to predict events and standardize responses for common occurrences to reduce response and repair times.”

    Helen Beal, chief ambassador, DevOps Institute 

    “Embracing observability supports SREs’ goals by:

    • Reducing the toil associated with incident management—particularly around cause analysis—improving uptime and MTTR.
    • Providing a platform for inspecting and adapting according to SLOs and ultimately improving teams’ ability to meet them.
    • Offering a potential solution to improve when SLOs are not met and error budgets are overspent.
    • Relieving team cognitive load when dealing with vast amounts of data–reducing burnout.
    • Releasing humans and teams from toil while improving productivity, innovation and the flow and delivery of value.
    • Supporting multifunctional, autonomous teams and the ‘We build it, we own it,’ DevOps mantra.
    • Completing the value stream cycle by providing insights around value outcomes that can be fed back into the innovation phase.”

    Mark Peters, technical lead, Novetta

    “True system observability means any process or event within any operational or development phase can be monitored by SREs. Systems with built-in observability provide SREs, as subject matter experts, the opportunity to examine events from different perspectives. The more observable the system, the more different places can be examined to help improve the overall flow. SREs can then create the feedback and design experiments to observe from different perspectives. If the event is showing functional difficulties and the only monitoring point is the input/output of the function and there is no process observability, SREs have to go back to the beginning to find events. If they can observe the entire process chain from commit to deployment, one can find the different areas. Think about the A/B cycle: Limited deployments are planned, and the load shifted gradually to ensure the new system can handle the increased functions. If the SRE cannot observe the function, then they cannot help improve reliability.”

    Ryan Sheldrake, field CTO, Lacework 

    “If you can ‘see’ or observe the complex and ever-changing environments that SREs are tasked with managing, creating and perhaps destroying, you can manage the associated risk posture associated with those environments and corresponding workload.“

    Vishnu Vasudevan, head of product engineering and development, Opsera

    “The top benefit for site reliability engineering (SRE) teams is the opportunity to work collaboratively with the business stakeholders and technology stakeholders to set goals and continuously improve. Based on these goals, SRE’s can create an approval process, which will help them understand where they are with respect to their own planning, security policies, quality metrics and operations practices. The ability to measure every release and verify the project helps improve speed to market and other factors once a robust observability practice is achieved. With DevOps orchestration across all the DevOps tools, applications being released and the different teams involved, SRE teams can then turn observability practices into a competitive advantage.”

    Sushant Mehta, senior manager, application development, Diyar United Company

    “Using observability, SREs can achieve a number of objectives in their day-to-day work, like identifying the root cause of production issues, faster resolution of issues and striving for self-healing infrastructure setup with no-code.”

    Tiffany Jachja, engineering manager, Vox Media

    “Every team that delivers software should be taking responsibility for their contributions to a software service. For SREs, having observability into an application means having the systems in place to help developers gain insights into how software applications function. Ultimately, it’s about building better software.”

    Parveen Arora, co-founder and director, VVnT SeQuor

    “SREs teams can leverage observability to get the following benefits:

    • To keep SLOs intact by detecting customer-affecting issues faster and rolling back before an issue affects the SLOs.
    • To have real-time health updates and transparency of information with regard to a service’s status. 
    • To create better workflows for debugging, optimizing workflows and resolving issues rapidly.
    • To simplify root cause analysis and investigation of hypotheses.”

    Jose Adan Ortiz, solutions engineer, Akamai Technologies

    “SREs are mainly concerned with the reliability of systems and usually monitor practices of toil, SLO, error, budget and stability to maintain systems working as expected.

    You could ask, ‘How can an SRE achieve such an integrated view of all systems components?’ The answer is observability. Without observability tools, it was impossible for an SRE to provide an effective response, fast RCA and analysis of data to improve SLOs.”

    Supratip Banerjee, solutions architect, Principal Global Services

    “It can provide several advantages, including:

    • Detecting customer-impacting errors faster and reverting before SLOs are broken.
    • Fostering transparency and delivering real-time updates on the status of a service. This allows SREs to be more productive and saves a lot of time.
    • Developing better methods for debugging, optimizing and quickly addressing issues.
    • Allows for feedback loops, which are crucial in the SRE role.
    • To avoid downtime, the relevance of observability rises in real-world production systems. There should be proper notification processes in place.”

    Maciek Jarosz, DevOps and process expert

    “The benefits are quite great, I’d say. Unless one is living under a rock with one local system, then it’s rather inevitable that there will be dependencies here and there. And if you’re an SRE, then I’d say that you’d rather know a bit more about dependencies from other branches of your system—or other systems altogether—than less.

    Learn more about observability and similar topics by registering for an upcoming SKILup Day.