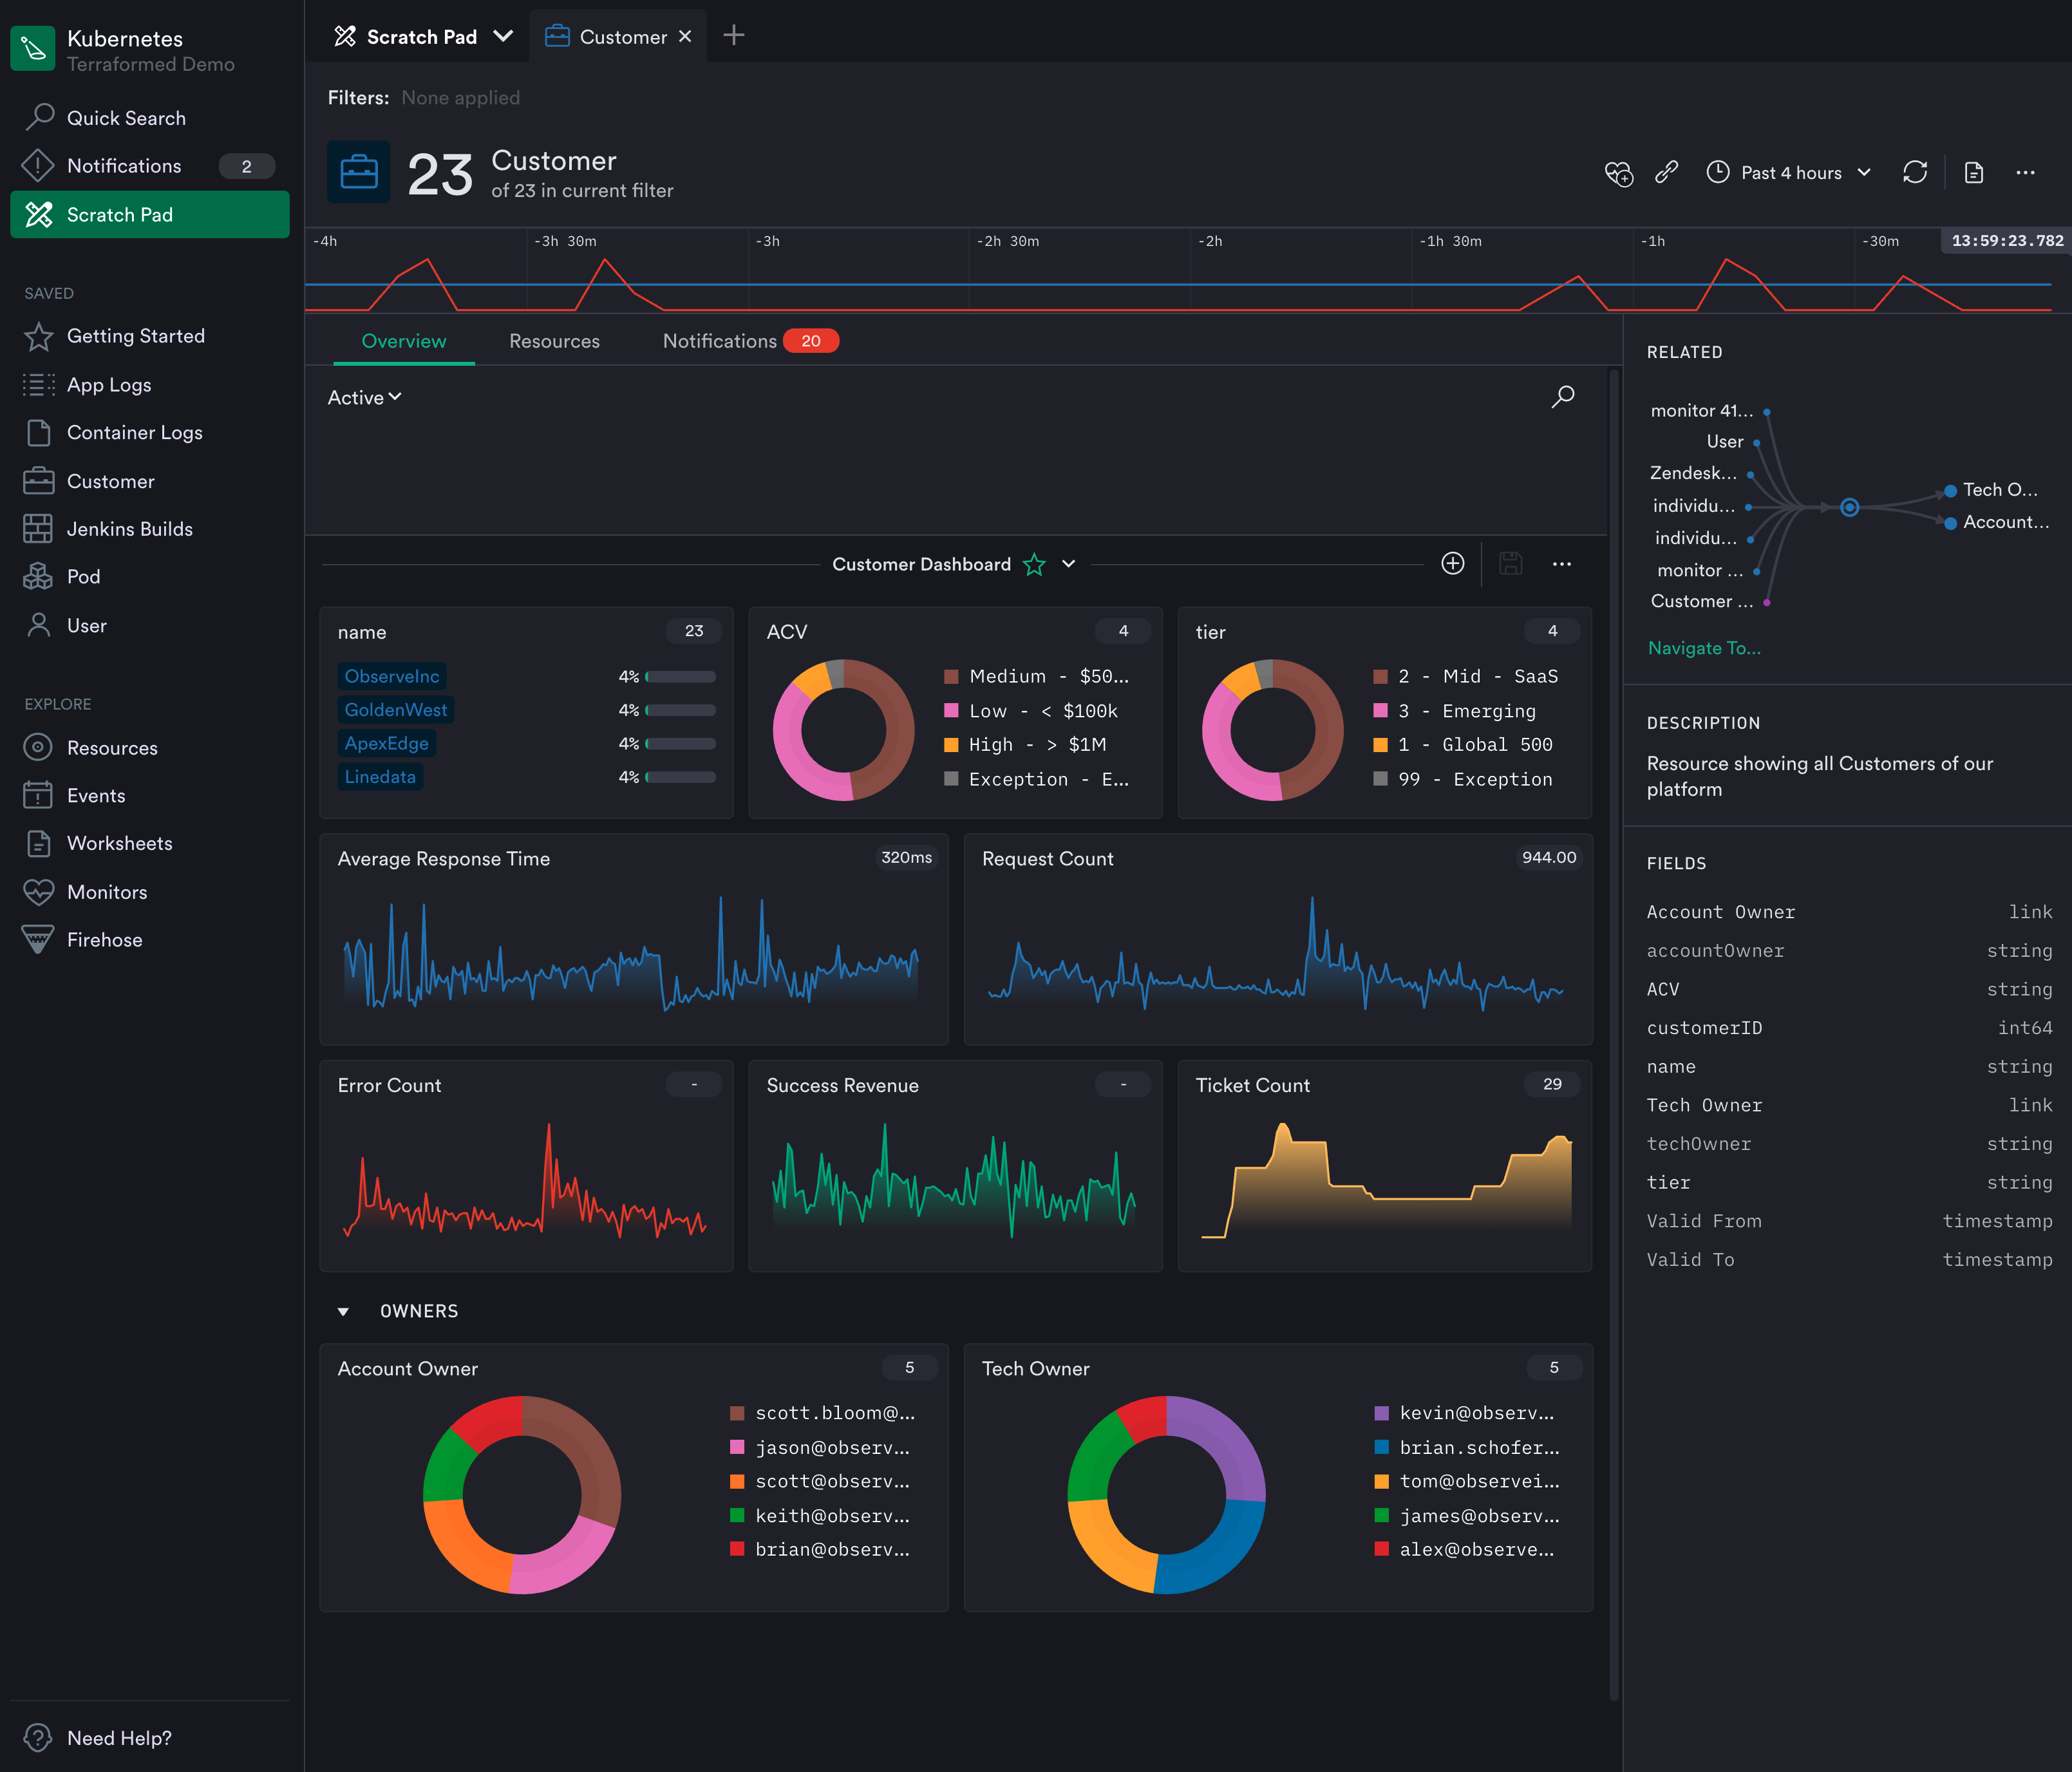
Observe, Inc. announced today it has updated it observability platform to add support for metrics based on time series data. In addition, the company is revamping how the platform generates alerts as part of an effort to surface more actionable intelligence.
Jeremy Burton, Observe CEO, said rival observability platforms require IT teams to sift through hundreds of metrics that are generated using elaborate tagging schemes that ultimately drive up the cost of storage. The Observe platform curates metrics by associating them with, for example, a customer, to provide more relevant context, Burton noted.
That approach eliminates the need to present IT teams with overwhelming lists of metrics in addition to reducing storage costs by removing the need for a complex tagging scheme, added Burton.
The latest update leverages that approach to metrics to only generate alerts based on curated metrics attached to customers, pods, shopping carts or containers. Rather than simply being alerted to a drop in response times, for example, the IT team can also easily see which customers or pods might be affected. That shift will reduce the volume of alerts that are already overflowing in email inboxes and across other communications platforms.
For now, Observe will continue to primarily focus on metrics as part of an effort to deliver insights in a form IT operations teams are prepared to consume today, said Burton. Over time, however, Observe will add support for distributed traces via tools such as OpenTelemetry and Jaeger as it adds additional application performance management (APM) capabilities, added Burton. Rather than telling IT operations teams they are managing IT in the wrong way, the goal is to meet IT operations teams where they are today, noted Burton.
That strategy also enables the Observe platform to be employed to manage both monolithic and microservices-based applications running on Kubernetes clusters, noted Burton. The immediate goal is to provide IT teams with an alternative to legacy monitoring tools that provide more context at total lower cost by allowing IT organizations to rationalize tools that don’t tend to be especially well integrated, added Burton.
In the longer term, Observe will also employ machine learning algorithms to collect data more efficiently. However, Burton said the company remains skeptical of visions of an IT future that depend on machine learning algorithms to continuously learn IT environments that are not only unique, but subject to frequent changes.
Competition among observability platform providers is already fierce. Each IT team will need to decide what type of platform makes the most sense for them based on costs and their preference for specific capabilities one vendor might have that another doesn’t provide. One way or another, however, the way IT environments are managed will soon be changing for the better.
At the same time, Grafana Labs revealed that Grafana Tempo is now available as a service on Grafana Cloud.
Version 8.0 of Grafana adds support for additional types of visualizations such as streaming panels, state timeline, status history, bar chart and histograms in addition to a revamped unified alerting system that enables DevOps teams to view and edit alerts generated by Grafana and open source Prometheus monitoring platform via a common user interface. The notification system adopted to achieve that goal is based on a Prometheus alert manager that provides capabilities such as grouping, deduping and silencing of notifications alongside advanced message templates.
The latest release of Grafana also improves startup and graph rendering performance, thanks to a major reduction in initial download size and graph rendering time.
The enterprise edition of Grafana has also been updated to provide support for fine-grained access controls, improves caching of back end data sources and improved reporting capabilities such as live dashboard links that can be embedded in email.
Overall, Grafana Labs claims there are now more than 750,000 active installations of Grafana that organizations are employing to create visualizations that correlate data collected from multiple back end sources.
In addition to contributing to Grafana and Grafana Tempo, the company is running a cloud service that makes multiple instances of Prometheus running on different clusters accessible from a central console.
Torkel Ödegaard, creator of the Grafana project and chief Grafana officer for Grafana Labs, said Grafana Tempo promises to further advance observability thanks mainly to its ability to employ object storage to capture complete distributed traces. Rather than only sampling traces, it’s now feasible to trace every request. Grafana Tempo is also compatible with any open source tracing protocol, such as Jaeger, Zipkin and OpenTelemetry, and can be integrated with metrics, logs and dashboards via a managed Grafana Cloud service.
It’s not quite clear how quickly organizations are embracing distributed traces to improve application observability or, for that matter, to what degree traces might eliminate the need for certain types of metrics or log analytics. The one thing that is certain is DevOps teams require more context than ever to proactively manage complex IT environments. Distributed traces make it simpler to track interactions between application services. The challenge is they can require IT teams to store a lot more data.
In time, of course, distributed tracing will become more commonly employed as developers more routinely instrument applications based on microservices that tend to have lots of dependencies that are difficult to discover in the absence of some type of distributed tracing capability. Of course, distributed tracing has been around, in some form or another, in application performance management (APM) platforms for some time. The difference now is that, as open source software, it’s becoming more affordable to implement.
Incentives are mismatched among SREs, SecOps, and application developers. These mismatches create challenges around how and what information is shared across siloed teams. This asymmetrical information creates a moral hazard where one team can shift deployment risk to another team, with no accountability back to the originating team. Risk shifting results in unstable applications, inefficient infrastructure, security issues and poor customer experience. All of that impacts your company’s bottom line.
Closing the Information Gap
Observability is positioned as a way to fix the information gap between these disparate groups. Observable systems allow users to ask questions about their behavior in an open-ended way, unlike more rigid monitoring systems. SREs and SecOps teams are already reaping benefits from observability, but mismatched incentives limit its effectiveness. Meeting the observability expectations of IT leaders requires pervasive instrumentation across applications, infrastructure and third-party software. Delivering that level of instrumentation has remained out of reach due to incentive mismatches, as well as human and infrastructure costs.
The main incentive for developers is shipping code quickly at a reasonable level of quality, meaning a low bug count. This contrasts with SREs, who are incentivized around uptime, performance and efficiency, while the incentives for SecOps teams are around risk reduction and breach mitigation.
Since SREs and SecOps teams don’t have insight into what developers have changed, it’s easy for performance or security problems to get thrown over the fence to operations. A fresh code push might only include minor changes and be harmless to existing operations. Or, it could replace large chunks of logic across the entire codebase, including adding calls to external and third-party applications. To the intrepid SRE and SecOps teams, one change looks like any other. They don’t get a peek behind the curtain because of the mismatched incentives. DevOps wants to deploy quickly. Waiting on approval from other teams slows down deployments, so comprehensive reviews don’t happen. This doesn’t mean DevOps teams are intentionally trying to sabotage partner teams. They’re simply acting in their own interests based on their incentives.
The challenge is that one party, the developers, has more information than other parties. That information asymmetry is what creates unbalanced risk sharing. Coping with information asymmetry has led to all kinds of new collaborative models, starting with DevOps and evolving into DevSecOps and other permutations like BizDevSecOps.
True collaboration has been hard to come by. Early DevOps efforts are often successful, but scaling beyond five to seven teams is difficult because teams lack the breadth of experience in IT operations or the SRE capacity to staff multiple product teams. The change velocity DevOps teams can achieve is often far greater than SREs and SecOps can absorb, making information asymmetry worse.
If teams can’t maintain high levels of collaboration and communication, another option must be developed. Observability practices, like collecting all events, metrics, traces and logs, allow SREs and SecOps teams to interrogate applications about their behavior without knowing which questions they want to ask ahead of time. However, observability only works if applications, and the infrastructure they rely on, are instrumented. This creates another problem: who does the instrumentation?
The expectation is DevOps teams embed instrumentation into their code as part of the development process. While that’s a nice idea, there are four reasons this falls short. First, the quality of instrumentation varies. Many log statements are terse and only understandable by the developer that wrote them. The message “In function xyx123!” isn’t helpful to an SRE digging into a performance problem that cropped up in the latest release.
Second, instrumentation libraries vary by implementation, giving inconsistent results across language bindings. OpenTelemetry is trying to improve this, but its progress is slow and still requires developers to do more work that, if we’re honest, doesn’t benefit them; it benefits SREs and SecOps. Now we’re back to those pesky mismatched incentives and information asymmetry problems again.
The third problem with instrumentation is the volume of data. Each instrumented application can produce terabytes of data each day. When you have robust instrumentation, the amount of data can be overwhelming, and extremely costly to analyze and store.
Lastly, instrumentation is isolated to the code your team wrote. That represents a fraction of the code you rely on. Vendor-provided services and APIs remain a black box, limiting your observability into those components.
Resolving information asymmetry across teams requires two things:
Pervasive, pluggable instrumentation capabilities for all code that doesn’t require developer involvement, and
An observability pipeline to filter, redact and enrich data, then route it to your analytics platform of choice.
Pervasive Instrumentation
Operations teams need instrumentation without having to go back to developers and beg them to add it to existing code. They need to turn it on and off as needed, and they need readily consumable data. They alsoneed every piece of data they can get, including packet payloads, insight into encrypted data and so on. This goes well beyond what’s possible with today’s instrumentation options.
AppScope, a newly released open source project, is a new take on instrumentation. AppScope interposes itself between application threads and system libraries, tracking things like file system access, network and HTTP activity, as well as CPU and process activity. It also provides payload data, and because it sits between the application and encryption libraries, it also gives access to users’ cleartext data. Because it works with any Linux binary, SREs and operations teams can instrument anything, even code they didn’t write.
Observability Pipeline
The challenge with pervasive instrumentation is dealing with all the data generated by applications. Network, file system, and other system data can easily swamp destination APM and log analytics platforms, driving up licensing and infrastructure costs. While instrumentation data is vital to rebalancing risk sharing in organizations, you need a way to manage that data intelligently to get value out of it. This is where the observability pipeline comes in.
An observability pipeline sits between the sources of observability data and its target destinations. By acting as a strategic control point, the pipeline gives users control over how data is formatted, filtered, enriched, and redacted before it is routed to one or more destinations.
Observability pipelines help SREs and operations teams deal with the flood of instrumentation data by routing low value data to low-cost storage, like S3, while higher value information lands in APM and log analytics tools. Later, if you decide you need the data stored in S3 to add more context to your analysis, you can replay it back through the pipeline and enrich your data set.
Shifting business priorities are accelerating the pace of technology deployment across organizations, and teams are pressured to deliver faster. This faster pace of delivery pushes deployment risk to operations and security teams that lack visibility into changes developers have made across complex distributed systems. This information asymmetry also increases risk to the business as applications become less predictable and reliable over time.
Traditional methods of resolving the information mismatch haven’t worked because incentives across teams aren’t aligned. Adopting pervasive instrumentation and observability practices will give SREs and operations teams critical visibility into rapidly changing application and infrastructure environments, without disrupting the developer experience and process.
Australia and New Zealand have seen a big move to the public cloud, and “… when I talk to customers, I see huge interest in rearchitecting applications rather than doing a lift-and-shift right into public cloud,” said Scott van Kalken, F5 ANZ solution architect for DevOps and modern applications.
That migration to the public cloud has led to massive interest in telemetry. When you go from a monolithic application to a distributed app, there may be 100 or even 1,000 APIs involved. Without telemetry, you don’t know what’s going on with those APIs. But the telemetry needs to be consistent.
F5’s 2021 State of Application Strategy report found 75% of respondents considered telemetry, especially about application security and delivery, important for meeting business outcomes, and 95% of respondents said they are missing insights from their existing monitoring and analytics solutions.
Van Kalken recounted a conversation with a practitioner as an example. This practitioner gets yelled at when problems arise with partner APIs used by the application he manages. So, even though these APIs are not technically his responsibility, he needs visibility into their status. Only by combining internal telemetry with telemetry from these partner APIs can he make sense of what’s happening within the application ecosystem.
And it’s not just a question of whether an API is available or not. Problems can arise when it is responding slowly. “‘Is that normal? Is that normal for this time of day?’ I’ve got to have some sort of telemetry data available to me to make decisions,” van Kalken said.
Enabling Security Automation with Telemetry
An aspect that’s particularly interesting to him is the ability to automate or otherwise take action based on security telemetry data.
A simple example is a security event that reveals some kind of systems abuse. Automation can add a firewall rule to block the associated traffic.
As organizations increasingly adopt event-driven architectures, events and responses occur at the application, network, infrastructure and other levels. “The minute that you automate those event-driven architectures with security, it opens up a world of possibilities.”
It’s not just about automating security. Imagine an API gateway that serves a variety of APIs to customers. Telemetry might reveal that two of the APIs are starting to slow down; in which case, “I might kick off a workflow that just deploys more of them so that we can handle the load. But if you don’t have that telemetry, you can’t do that,” he said.
In practice, this involves telemetry, analytics and automation.
“When we show [customers] how you can make use of the analytics in a really easy way, their eyes light up,” van Kalken said.
Multi-Cloud Migration
A further consideration is that rearchitecting applications isn’t just about splitting monoliths into smaller pieces and redeploying them as microservices. There’s also a desire to run them across multiple public clouds to reduce risk, and also to deploy applications at the edge where they are closer to their users.
The 2021 State of Application Strategy reported that just over three-quarters of respondents are already using or have plans to use the edge to capture benefits related to application deployment, performance and data availability.
“This is really important, because as an application developer, I want to deploy my application once and I want to say, ‘I want this distributed to all of these places around the globe’,” van Kalken said.
But if the application is deployed in, say, five locations, then from a telemetry perspective, it is five applications, not one.
“I’ve got five sets of telemetry, because I’ve effectively got five different applications deployed out there. It’s the same app, but it’s in five locations, and the consumers are different in every location; the way that they interact is different and the telemetry that I’m getting is going to be different,” he said. “So, I need to actually suck up all of that telemetry, and make it meaningful in some way,” he explained.
Telemetry Enables Clearer Vision
“A distributed cloud architecture is right for these modern applications. We recently bought a company called Volterra, and this is one of the areas that they play in — distributed applications, and specifically, abstracting multi-cloud and multi-cluster Kubernetes application deployments,” he said. This area of focus will be critical in the future, van Kalken said.
He predicts that as organizations move to 5G, applications will become increasingly distributed. If that does happen, it will be extremely important to receive telemetry from all components of the application so it can be analyzed and used to support intelligent decisions, as part of the distributed application deployment.
Detecting a cyberattack can take more than 200 days. During this time, attackers might be exploiting your system while you are completely unaware. Cyberattacks can cost affected organizations as much as $13 million per year.
What if we could reduce the time to detect a cyberattack all the way down to zero? How much money could you save by detecting and stopping an attack while it is still happening?
And what if we could do even better than that? What if we could detect security vulnerabilities before an attack even occurred?
Security observability is critical to achieving these goals. Let’s take a look at what security observability means and how distributed tracing, which is one part of observability, can help to defend your business from cyber security threats.
What Is Security Observability?
Knowing what is happening inside software is the best way to learn how to defend it. Observability refers to the ability to see the state of a system at any time. It’s like opening up a watch and watching the gears turn.
Applications and services constructed using APIs and microservices have an advantage over other systems because you can more easily observe what’s happening inside of them. You add hooks to the APIs and microservices and use additional tools to collect the details.
This presents us with an opportunity to better secure applications and services against cyberattacks by allowing us to see exactly what is happening inside the system.
The Three Pillars of Observability
Three types of data are needed to make a system observable. These are commonly referred to as the “Three Pillars of Observability:
Logs: Raw data, recording every activity that happens in the system
Metrics: Aggregated performance metrics, such as CPU load and memory usage, collected as min, max, average, number of counts, and so on
Distributed traces: The complete path a request follows as it flows through the microservices
Data analysis/visualization tools (sometimes referred to as the “fourth” pillar).
Yes, that makes four, but this item isn’t data. The above data is too complex to digest directly, making these tools paramount to achieving observability.
Figure 1. Sending observability data from the microservices to their respective collectors.
The three pillars are shown in the diagram in Figure 1. Each microservice in the diagram contains additional code that sends logs, metrics, and traces to their respective collectors. These collectors gather the data, store it, filter it, and pass it forward to analysis and visualization tools that make the data usable by humans.
Traditional security tools, such as SIEMs, make use of logs and metrics to secure a company’s assets. However, these tools fall far short of protecting applications.
Limitations of Logs and Metrics for Protecting Apps
Logs and metrics begin to paint a picture of what is happening inside your APIs/microservices. But the picture is incomplete. Logs and metrics can help developers ensure that the system is working properly and they can help with solving problems during debugging. But they do not provide enough information to protect the system from cyber attacks.
Logs: Just the Facts
Every time a microservice is called or a request is generated, a message describing that activity is sent to the log collector.
Code Snippet 2. Example of a log message, indicating that Service A has received a GET request.
This message contains information about what has happened, but it is in a very raw form. You can think of a log as a fact. It doesn’t provide any real understanding of what happened in the system.
If this GET request was the first step in an attack, we can’t tell that from looking at the logs alone.
Metrics: Adding Insights – What Happened
Metrics are aggregated data collected from microservice activity. Metrics may include things like CPU usage, memory usage, execution time, number of calls or requests per unit of time, and so on. Each metric is associated with the microservice that recorded it.
Figure 2. Metrics example, showing the number of calls received for the Login service. What do the spikes reveal? Are they attacks, or are they normal user behavior?
Figure 2. shows activity over time for a login service. The login activity is usually uniform and consistent, but there are very large spikes that occur occasionally.
The spikes show that there are bursts of login attempts that are occurring occasionally on a system. They could indicate that a hacker is sending a brute force attack, attempting to guess usernames and passwords for administrators in the system. Or they could indicate a hacker is trying to overload the server with a Denial of Service (DoS) attack.
But these spikes might indicate normal user activity. Perhaps many users are running an app simultaneously because they just saw a compelling television commercial that was aired during the Super Bowl halftime. Or maybe everybody is contacting Uber to request a ride at the same time because a Rolling Stones concert just ended.
Another possibility is that these bursts of activity indicate a bug in the system. Maybe there is some sort of unforeseen infinite loop that is causing an unexpected burst of activity.
We just don’t know what is causing these bursts. To gain the insight we need to secure APIs, we need to know what happened before this metric was generated. We need the ability to work backward.
Distributed Tracing: Context and Causality – Why Things Happen
Distributed tracing can help us understand the reason things happen. When we know why things happen, we can determine if an attack is underway.
Figure3. A “span”, or trace, showing the path a request follows through the API/microservices system.
Distributed tracing is a form of tracing that is specially adapted to microservice architectures. It allows us to observe each request traveling through the system from its beginning to its end. We can use traces to improve performance and understand what typical behavior looks like.
But traces also give us the power to identify attacks on our microservices and stop them.
Traces show the entire path a request followed through the edge API and microservices. They can tell us:
If the request went through all of the required services, including authentication and authorization checks
If the request called any unexpected services or granted access to unauthorized data
Where the request entered the system. (If a request entered without going through an edge API, also known as an API gateway, there may be a problem)
The IP address that originated the request
And if they are working especially well, traces might even help identify an attacker.
Data Analysis and Visualization Tools: Seeing What Humans Can’t
In a real system, there may be hundreds of different paths requests can take, just like the one shown in figure 3. And each request could touch tens or even hundreds of services. While distributed tracing gives us the ability to observe all of these, the complexity makes it impossible for humans to gain much insight.
Machine learning and data visualization tools can identify patterns in the data, in order to identify normal behavior and abnormal behavior, and can even create alerts when abnormal behavior is detected.
These patterns of normal and abnormal behavior help us to identify security vulnerabilities and attacks within APIs and microservices.
Tracing to Reveal Vulnerabilities
The diagram in Figure 4 shows the combination of traces through a system. We can use this diagram to identify possible security vulnerabilities.
Figure 4. Possible security vulnerability, indicated by the red-colored trace. The diagram shows that this group of requests may inadvertently grant unauthorized access to the user’s account-info.
Figure 4 shows a pattern that contains an “Excessive Data Exposure” vulnerability, which is vulnerability #3 in the OWASP API Security Top 10. The pattern shows that when a user views a shopping cart, the API will also return the user’s account information. This unnecessary information may include personal information, account information, or financial information a hacker can exploit.
These insights help developers recognize potential security vulnerabilities and correct the code to eliminate them.
Tracing to Detect Attacks in Real-Time
Tracing can monitor each request and compare it to established norms. The system can generate an alert if a trace deviates from this expected behavior.
Figure 5. Possible attack in progress. The diagram shows that a possible attacker may have found a way to bypass a required authentication or authorization step.
Figure 5 illustrates a pattern that could indicate either a “Broken Object Level Authorization” attack or a “Broken User Authentication” attack, which are #1 and #2 in the OWASP API Security Top 10 vulnerabilities.
This figure indicates that an attacker has found a way to enter another user’s shopping cart and possibly obtain information for that user, by bypassing either an authorization or an authentication check.
Typically, tracing allows us to go back in time to find attacks such as the one above. Can tracing help to stop attacks in real-time?
Yes, tracing provides the information we need to detect and stop attacks in real-time. However, more is needed. A sophisticated AI on top of a tracing mechanism would be able to notice abnormalities humans may miss and can stop abnormal behavior before any damage is done.
Tracing plus AI gives us real-time security observability. In a future blog post, we’ll discuss how AI takes what tracing gives us and uses it to create real-time protection against attacks.
Use Distributed Tracing to Defend Your APIs
Cybercrime is expensive, and it can take a long time to detect an attack. Attackers are creative, and older techniques using logging and monitoring do not give enough insight to recognize an attack when it happens.
Security observability uses internal states to thoroughly comprehend what is happening inside your API/microservices system with the goal of protecting them from attack.
Observing your software, using logs, metrics, and most importantly, distributed traces gives you the opportunity to identify attack patterns, eliminate security vulnerabilities, and block attacks before they can cause serious damage. View a recorded Traceable demo to see for yourself.
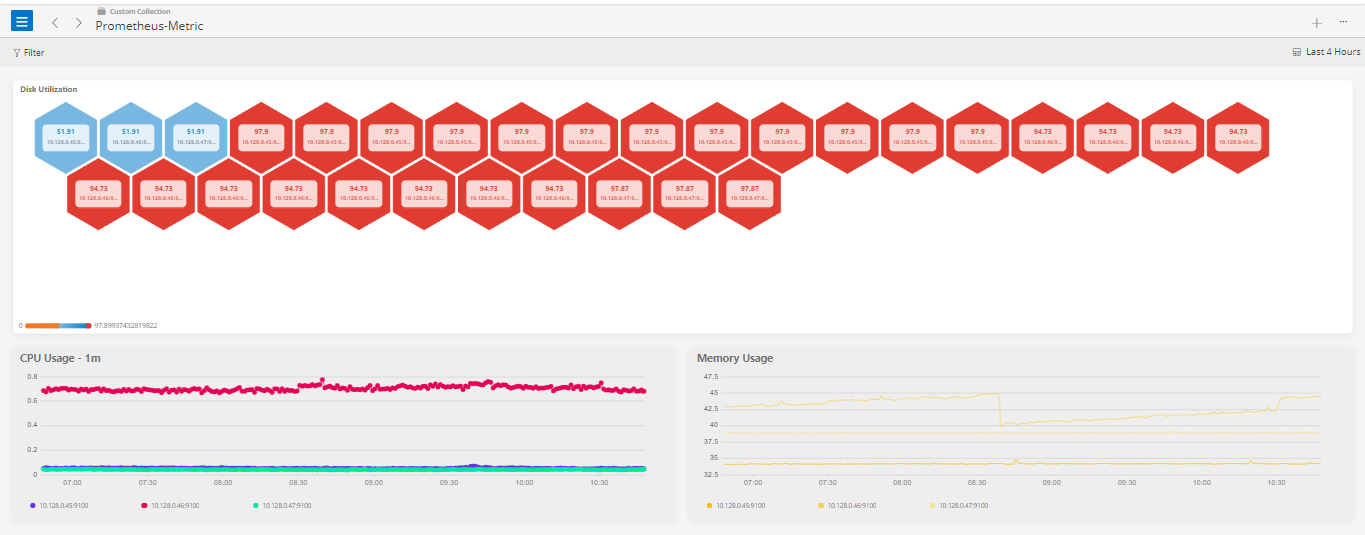
OpsRamp today announced it has added the ability to ingest data captured via the open source Prometheus monitoring software into its namesake IT operations platform infused with machine learning algorithms.
In addition, the company is adding support for customizable dashboards using the Prometheus Query Language to create visualizations of hybrid infrastructure performance. Also, a set of available tools makes it easier for IT teams to discover when workloads have been added to a cloud. These capabilities became available with the Spring 2021 Release of OpsRamp’s IT operations platform infused with artificial intelligence (AIOps).
Finally, OpsRamp has also created an alert definition model that streamlines the alerts generated by the AIOps platform and its integrations for the Microsoft Azure cloud and the Cisco HyperFlex platform deployed in on-premises IT environments.
Deepak Jannu, senior director of product marketing for OpsRamp, said that as IT becomes more complex to manage, many IT teams are starting to realize that managing these environments without help from an AIOps platform won’t be possible. As such, much of the fear and loathing that was initially associated with AIOps is giving way to acceptance as IT teams start to realize these platforms augment their capabilities versus replace them, added Jannu.
Much of the complexity is being driven by the rise of cloud-native, microservices-based applications that tend to have lots of dependencies. OpsRamp has primarily been encountering Prometheus in these environments. However, Prometheus can also collect data from legacy applications, as well, so over time, the expectation is the open source monitoring tool will be employed more widely.
As AIOps platforms become more widely employed, there is no doubt job roles within IT organizations will change. As lower-level tasks become automated, IT teams should have more time to spend resolving complex issues once the AIOps platform has identified a baseline for how applications should optimally behave. In many cases, the need for personnel to perform rote tasks that no one in IT wants to actually do will be eliminated altogether.
DevOps teams that are committed to automating IT tasks will naturally be among the first to employ an AIOps platform to augment the capabilities of site reliability engineers (SREs) that are often challenging to hire and retain.
In general, Jannu noted that the observability that many IT organizations now demand can’t be achieved by simply collecting more metrics. IT organizations will need to invest in an AIOps platform capable of making sense of all the instrumentation data being collected. The challenge now will be defining the right division of labor between man and machine in an IT environment, Jannu added.
At this juncture, AIOps, to one degree or another, is inevitable. In many cases, machine learning algorithms are already being employed to optimize applications or a specific class of hardware. The decision IT teams will ultimately need to make is determining whether to replace their existing IT operations platform or wait for the provider of their existing platform to get around to adding AI capabilities.
As an industry, we’ve seen cultures and roles shift throughout IT teams — specifically, the role of ITOps site reliability engineers (SREs), various developer roles and the culture of DevOps. Most of these roles operated – or still operate – in silos, and didn’t understand (or care to understand) how each other’s role worked. More importantly, they didn’t know how to work together. But these roles are starting to overlap, driven by the increase in demand for customer experience and, subsequently, in intelligent observability, or observability with AIOps. Before we dive into the ‘how’ behind the overlap, let’s look at how each of these roles performs today.
Developer
While the specifics of what a developer does varies by project, the overarching responsibilities haven’t changed much since the introduction of the role. Simply put, developers write code to create and improve product functionality.
IT Operations and SRE
Traditionally, an IT operations professional focused on operating the code a developer put into production; aka keeping the lights on. However, we’re now seeing evolution of the role of highly skilled operations pro to that of an SRE who oversees automation and features surrounding the product, like CI/CD pipelines, infrastructure-as-code and the ability to monitor and observe the services and components within.
QA
Traditionally, QA would test the code the developer wrote and move it down the deployment pipeline. But we’re moving away from traditional QA. Now, the role sets up an automated framework for the developer so they can automate tests — similar to how the SRE sets up the CI/CD pipeline and observability framework to build, test, deploy, verify and monitor their code.
DevOps
DevOps has, in some cases, evolved from a practice and culture into a role. The DevOps engineer prepares the automation and the CI/CD pipeline for the developer to push out their code to test and, ultimately, production. But let me be clear – I believe the idea behind the practice of DevOps is that the practitioner does everything — they own testing frameworks, CI/CD pipeline and infrastructure. They own end-to-end product development and operation, so when anything does go wrong, they know exactly what to do, where to go and how to fix it.
In the end, if a SRE can develop everything around the product code and knows how to fix the product — isn’t an SRE actually a developer? What if we have a really skilled developer who sets up the automation and observability framework to get their code from their keyboard to the user as quickly as possible — without breaking anything, of course — while also building and improving all the infrastructure and components surrounding the product? Isn’t the developer an SRE, or at least performing site reliability engineering?
The short answer, in my opinion, is yes. And there’s one guiding force behind this amalgamation, this crossover; ultimately, this evolution: intelligent observability.
The role of observability with AIOps
Traditionally, and with the use of many tools, DevOps practitioners and SREs have had to — manually — battle floods of data coming in from all their endpoints, services and products. This can feel like a never-ending struggle. It can lead to a lot of toil and time spent on maintenance, when what developers really want is focused time to do what they love – write code, create and innovate. Not to mention, the result has a negative impact on the customer experience.
But now, new tools are surfacing to support the everyday needs of SREs and DevOps practitioners. For example, intelligent observability, or AIOps, applied to observability data like events, metrics, traces, changes and logs, gives teams clearer insight into not only where complex data is coming from, but why an issue is happening and what action they need to take to resolve it. They can spend less time operating and more time innovating.
As these roles continue to evolve, it’s important SREs and DevOps practitioners remain agile and willing to adjust to keep up with the latest technologies supporting their day-to-day workflow. AI can be the key to keeping the incident count down and the customer experience up.
Looking Ahead
If you’re currently in one of these roles, consider how you are practicing. Whether you’re a developer, a QA engineer, a DevOps practitioner, or an SRE, have you evolved your role to fit your company and customers’ needs right now? As these roles overlap with the application of intelligent observability throughout your development life cycle, it’s possible to deliver better products and fix reliability issues faster. It’s up to you to decide if you want to embrace the evolution of your role and intelligent automation or stay put and risk falling behind.
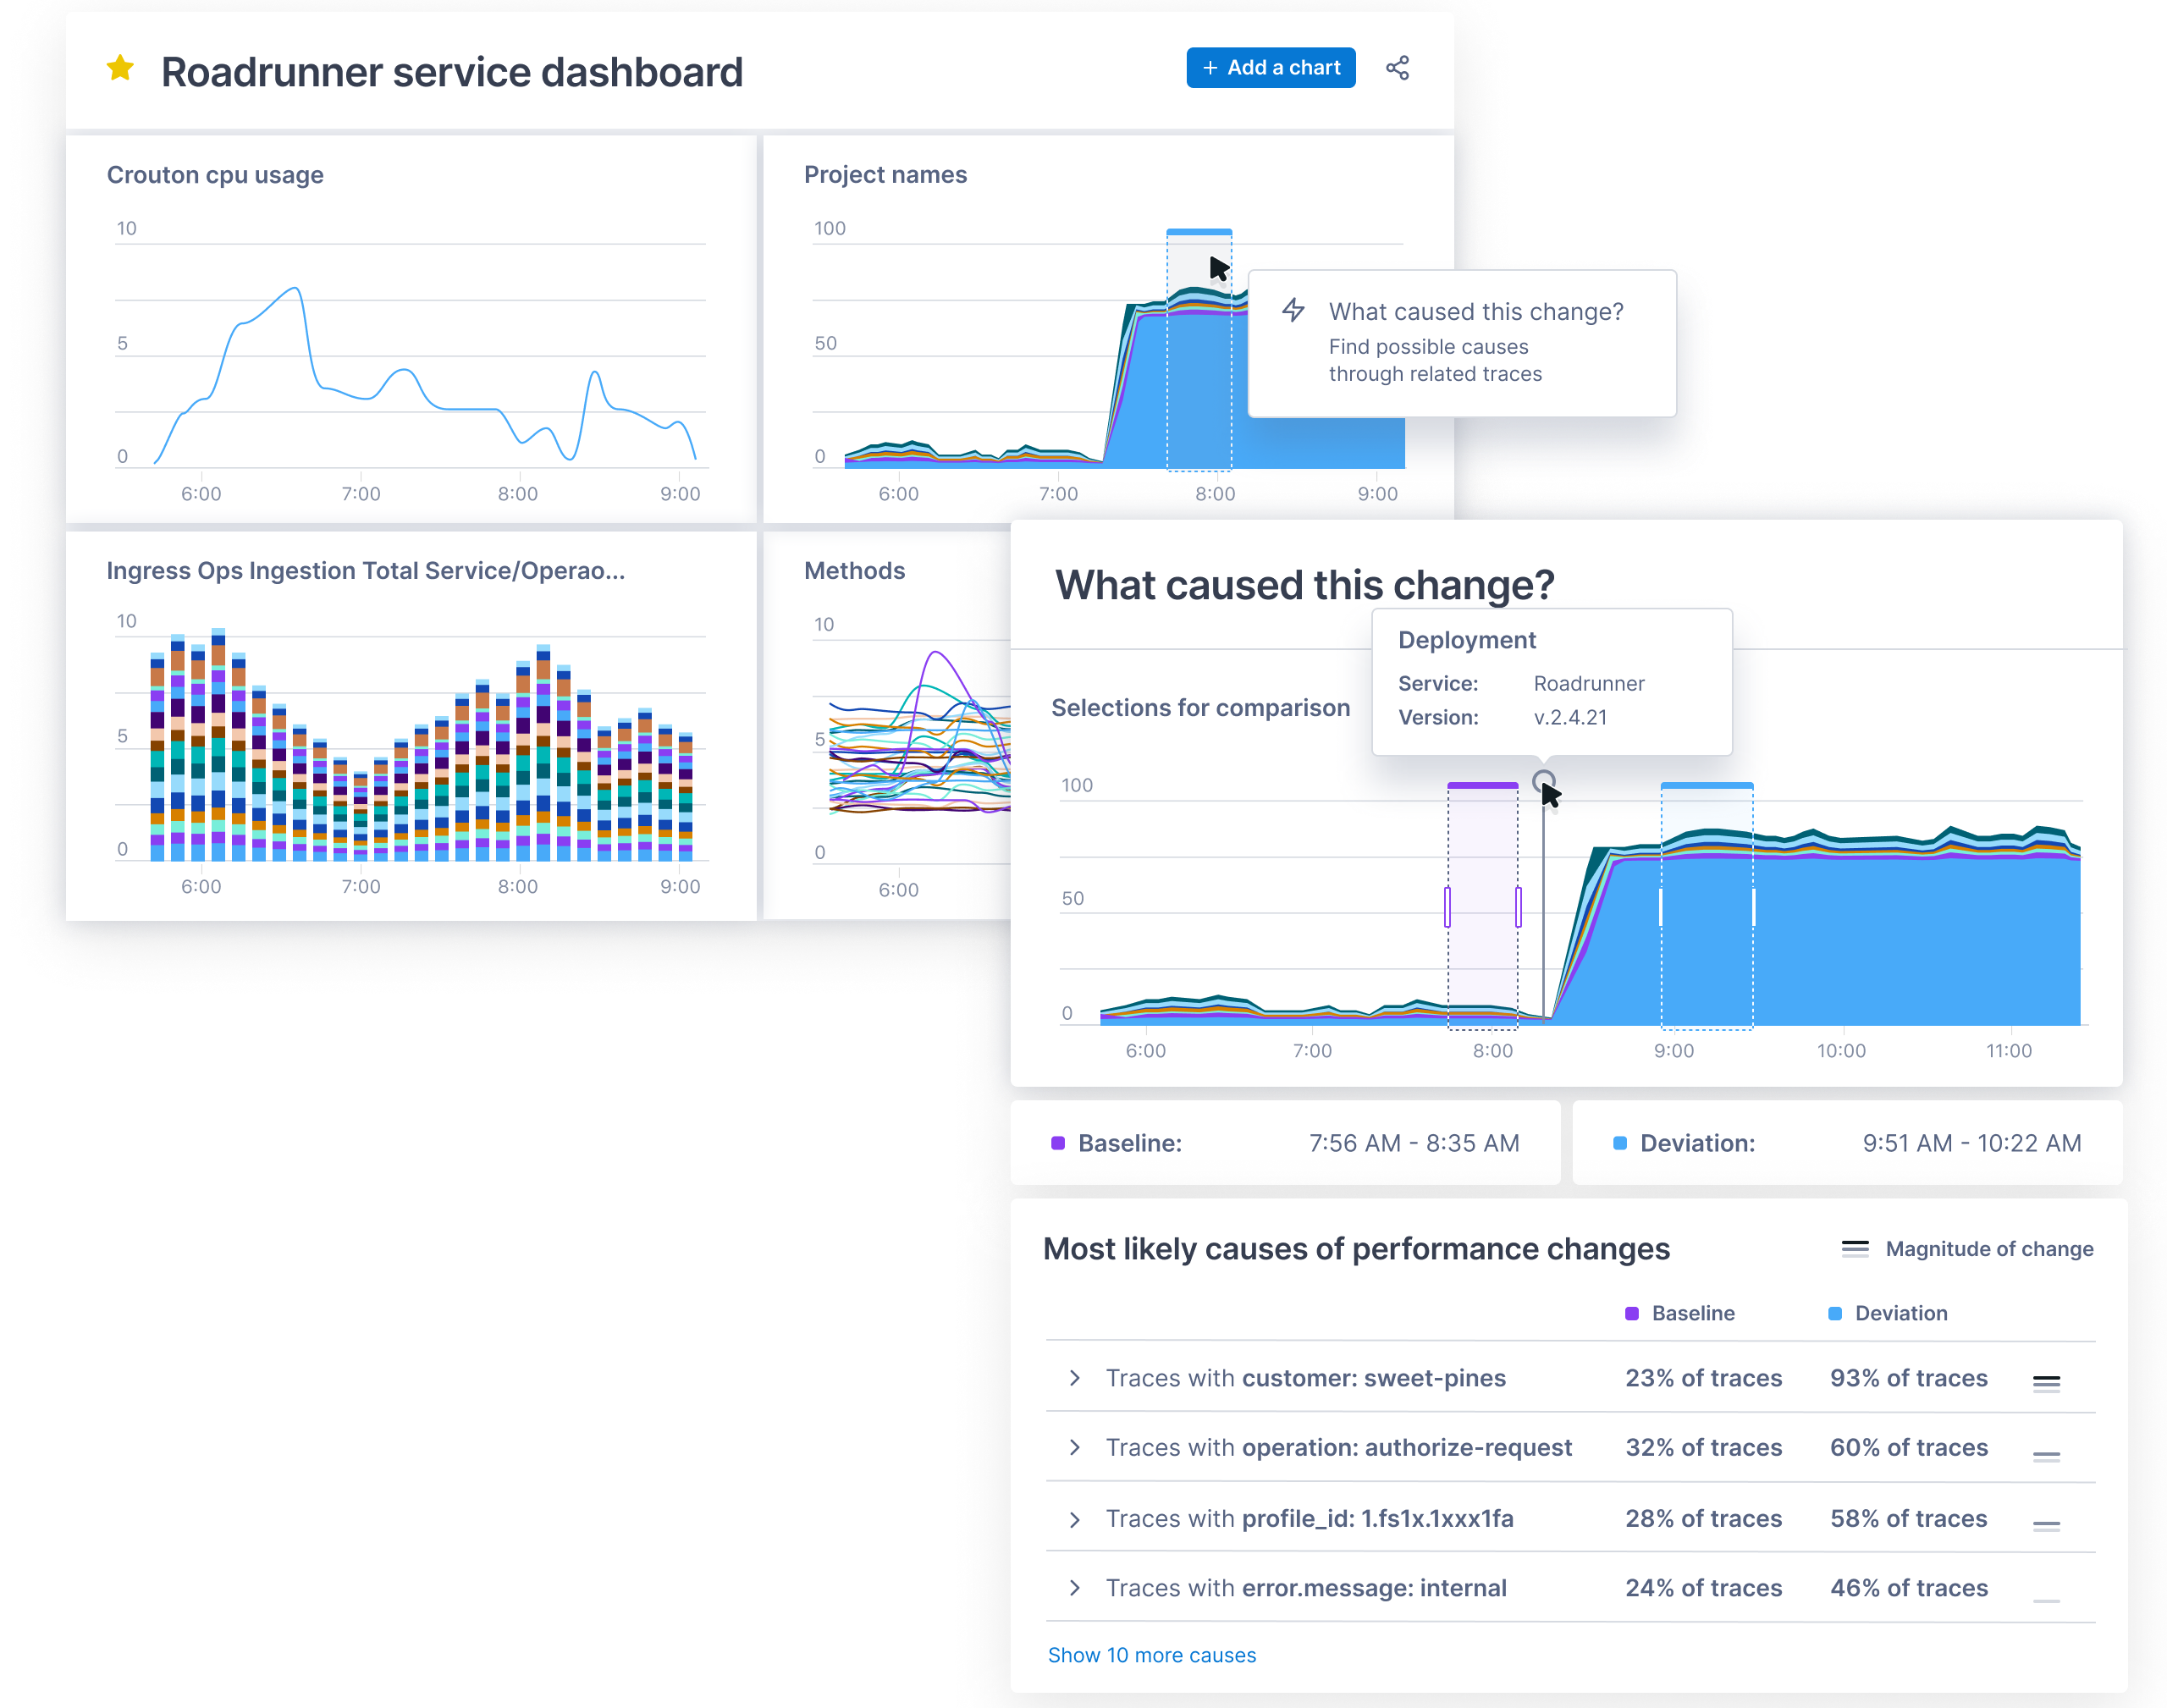
ServiceNow today announced it has acquired Lightstep as part of an effort to add an observability platform to its IT operations portfolio. Terms of the deal, expected to close this quarter, were not disclosed.
The Change Intelligence observability platform from Lightstep is based on a time-series database that is capable of processing a trillion events each day. It was built by the same team that created Monarch, the globally distributed in-memory time series database system that Google employs to monitor its applications and systems. Lightstep team members also co-created both the OpenTracing and OpenTelemetry open source projects for collecting traces, metrics and logs.
Pablo Stern, senior vice president and general manager for IT workflow products at ServiceNow, said ServiceNow will employ Lightstep to enable IT organizations to observe both monolithic and microservices-based applications as IT operations and DevOps teams continue to collaborate more closely with one another. The goal is to provide a single pane of glass through which IT teams can observe their entire IT environment via the Now platform that ServiceNow makes available via a software-as-service (SaaS) delivery model.
That approach will enable DevOps teams to programmatically manage IT environments alongside IT administrators employing graphical tools, noted Stern.
Lightstep CEO Ben Sigelman added that, in time, the number of users of that observability will only increase as more application stakeholders start to track software development projects that are at the heart of various digital business transformation initiatives.
Thanks mainly to the rise of microservices that are now being deployed across highly distributed computing environments, it’s become more difficult to discover the root cause of an IT issue. Microservices-based applications have lots of dependencies that, while serving to make the overall application more resilient, conspire to make it difficult to determine which specific microservices might be adversely impacting the performance of an application.
The time-series database that lies underneath the Change Intelligence observability platform makes it feasible to go beyond logs and metrics to process distributed traces that provide more insight into application behavior. Ultimately, the goal is to enable organizations to innovate faster with a higher degree of confidence in the IT environment, said Sigelman.
As far as the march to observability in the enterprise is concerned, it’s still early days. While observability may be a core tenet of any DevOps practice, most IT organizations rely on myriad tools that surface data the teams then attempt to correlate. Whenever there is a major issue, those IT teams typically convene in a “war room” to compare reports generated by the various IT monitoring tools employed. Observability platforms that collect and process distributed traces used to instrument an application using a consistent set of specifications, frameworks and libraries. The OpenTracing and OpenTelemetry tools are significant because they provide an open source approach to instrumenting applications that reduces the total cost of observability. In comparison, many legacy application performance management (APM) platforms employ proprietary agents to instrument applications.
Naturally, each IT organizations will be moving down the path toward an observability platform that provides greater application context. At this point, however, it’s not clear to what degree observability platforms will need to be installed before making the transition to microservices versus being a capability that only gets appreciated once the trouble with microservices finally becomes apparent.
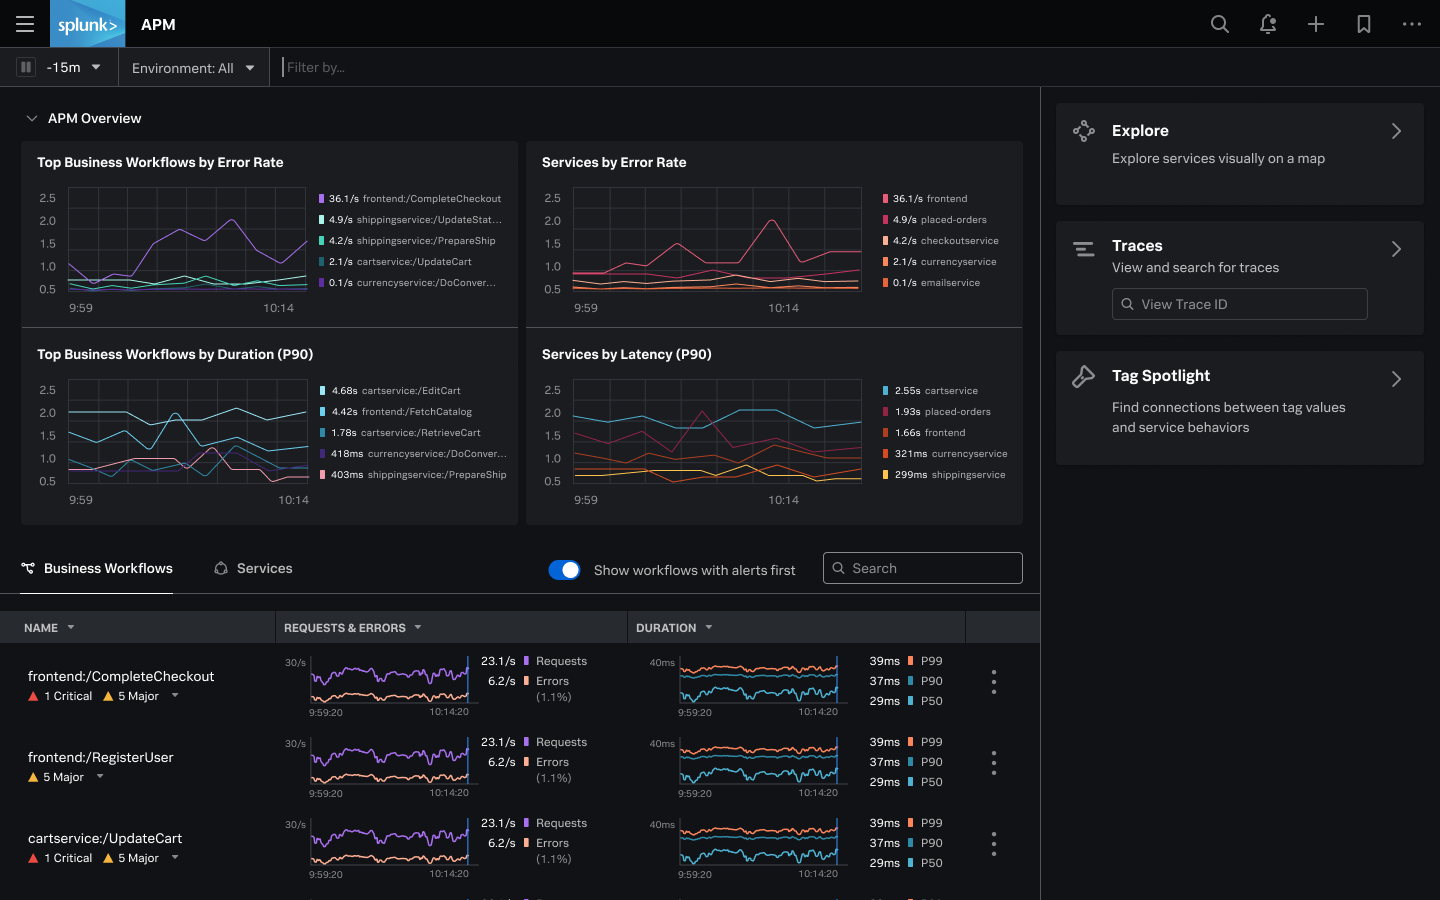
Splunk today unveiled an observability platform delivered as a cloud service that captures all metrics, traces and logs in real-time without relying on sampling.
Spiros Xanthos, vice president of product management for observability and IT Ops at Splunk, said Splunk Observability Cloud collects all that data via a single agent based on open source OpenTelemetry software to instrument an application.
Historically, application performance management platforms (APMs) have only analyzed samples of data to identify a potential anomaly. Splunk Observability Cloud analyzes all the streaming data captured by its agent software to enable IT teams to pinpoint the root cause of an issue faster, said Xanthos.
As a result, Xanthos said the signal-to-noise ratio dramatically improves compared to legacy monitoring platforms. It will then be up to each IT team to decide how much of that data they want to store after it’s been analyzed, added Xanthos. Pricing for Splunk Observability Cloud is based on the number of hosts employed rather than the amount of data collected.
The Splunk Observability Cloud unifies a Splunk analytics portfolio by including capabilities provided via Splunk Log Observer, Splunk Real User Monitoring (RUM), Splunk Synthetic Monitoring, Splunk Infrastructure Monitoring, Splunk APM and Splunk On-Call. Splunk Synthetics Monitoring is based on technology Splunk gained with the acquisition of Rigor last year.
The Splunk Observability Cloud is one of the first such platforms to rely solely on OpenTelemetry agent software being developed under the auspices of the Cloud Native Computing Foundation (CNCF) to collect data. That project not only reduces the cost of instrumenting applications, it also reduces the number of agents an IT team might have to deploy to collect metrics, traces and log data.
Many rival observability platforms can collect data from OpenTelemetry agent software, but also tend to encourage DevOps teams to deploy proprietary agent software that they claim is easier to install and collects data at a more granular level. Splunk has decided OpenTelemetry has matured to the point where those proprietary agents are no longer required, said Xanthos.
The rise of observability platforms presents an opportunity for IT teams to rationalize a raft of monitoring tools that often surface conflicting analyses. IT teams today spend an inordinate amount of time convening so-called “war room” meetings to determine the actual source of an issue. Those meetings can go on for hours, only to eventually discover an issue that only takes a few minutes to fix.
While observability has always been a core DevOps principle, the level of visibility most IT teams have into their application environments is limited. There is no shortage of monitoring tools, but because there is no unified approach to observing an IT environment, there simply isn’t enough context being provided. As IT environments become more complex – thanks primarily to the rise of microservices-based applications that have lots of dependencies – that lack of context is rapidly becoming a major issue. A microservices-based application is designed to degrade gracefully if one microservice suddenly become unavailable. The issue is that it can take a very long time to discover the root cause of performance degradation.
It may be a while before most IT teams achieve true observability, but once they do, many will wonder how they previously managed IT without it.
Nothing gets the blood pumping like seeing an IT incident alert flash across the screen. Is the network traffic anomaly a potential intrusion? Are we about to have an outage? Is it just a random blip on the radar? The implications of these different potential incidents vary wildly, and each requires a different set of response tactics.
Responding to incidents both large and small is essential for every team. Especially in a remote-first world, it is more important than ever to ensure that all developers are in the same war room to tackle the problem as efficiently and effectively as possible. It’s also critical to have a single view that aggregates data from all of the systems and services used to monitor and respond to incidents. But not every team has invested in a fully fledged incident management strategy.
In fact, it’s not uncommon for incident management to be completely ad hoc. Teams wait for something to happen and then take a “dive and catch” approach to incidents. Some teams have some processes in place, but those plans may be missing key components. In both cases, teams struggle with slower time to resolution and often waste resources in the process of responding to incidents. Critical stakeholders often suffer from a lack of clarity in communication around an incident.
Depending on the type of incident, the consequences can be challenging to overcome. Running afoul of a compliance law, like GDPR, can result in business-ending financial penalties. Incidents that impact uptime can keep an organization from meeting SLA terms and potentially losing customers and revenue. Regardless of the size of your company or customer base, formulating an effective incident response begins with people.
People are the Cornerstone of Incident Response
Companies should assess their business needs and the risk profile of their applications and services. With those barometers in place, leaders can then determine the appropriate staff levels to ensure 24/7/365 incident management coverage. The size and breadth of the team will depend on the size of the company and the structure of response plans, but the team should attempt to cover a few areas.
Ideally, a team has at least three responders.
Incident owner. This is the team’s quarterback. They coordinate everything, make sure the team follows runbooks, involves the correct people and removes roadblocks.
Incident investigator. The investigator has their hands on the keyboard. They run the investigation, pull and analyze logs, review metrics and generally try to determine how to best mitigate the issue.
Incident communicator. Smaller teams may not have the personnel to have a designated communicator in every incident. On those teams, the incident owner will often assume this role, as well. Communicators focus almost exclusively on two tasks: documenting the incident via an “incident timeline” and communicating with stakeholders when appropriate. It’s critical that a complete timeline is built during the incident. It’s nearly impossible to put together a properly documented incident timeline after the fact. Critical details will get lost or forgotten, and your retrospectives and RCAs will be low quality.
Runbooks offer Muscle Memory During Incident Management
The incident response team, no matter how experienced, will need a set of runbooks—a compilation of processes and steps to take when incidents arise. Runbooks will help guide teams as they perform everything from analyzing and mitigating common problems, to post-action investigations. They represent the process portion of incident responses, and act as a guidebook for the team when the pressure is high.
Typically, an alert system will ping the on-call engineer about a metric that doesn’t look right. The runbook will help that on-call person determine if the alert should be categorized as an incident or not. When that person determines the alert indeed represents an incident, they must estimate the severity of the incident. Different teams may use different definitions for severity, but here is an example:
Severity one – Production down or highly degraded.
Severity two – Serious bug impacting customers or system stability.
Severity three – Important bug. Requires tracking until mitigation, but likely not a 24/7 workstream.
Runbooks can also guide teams through analysis of the situation. After a root cause is determined, the book will remind teams to perform an immediate post-action investigation to see if specific processes worked well, if gaps exist, and if communications were sent out to customers or other stakeholders.
Tools are Important; Tying Them all Together is Crucial
People and processes are important for responsive incident management. Without the right tools, even seasoned incident-management veterans may struggle with the complexity and pressure of an incident. Tooling can prevent a lot of mistakes and omissions when the heat is on.
There are numerous platforms that address different components of incident management response. Depending on the size of the organization, teams will need some or all of the following:
On-call rotation management
Observability and alerting
Ticketing system
Communication system
One of the biggest challenges in incident management is having the ability to tie together the data and actions defined by this broad toolset. If you’re working a severity level one incident, teams will likely rotate people into and out of the incident based on their geographic location and timezone. How does the next person in the rotation come up to speed on what’s been done so far? How do we document a detailed timeline that can be used for an RCA investigation later? How can we provide an up-to-the-minute view of the status of an incident for key stakeholders? Ideally, teams will have a single place where all of this data is collected and managed and where the data can be filtered and exported at the end of the incident.
Effective Incident Management: People, Processes and Tools
Is that traffic spike a sign of impending doom, or just another meaningless bump? Without the proper people, processes and tooling, answering that question becomes very difficult. Unfortunately, the wrong answer can lead to disastrous consequences. Only with the right set of tools and processes can companies develop an incident response system that provides maximum stability and keeps customers happy.