Tag: observability

  • EP 17: Lies, Damn Lies and Metrics

    EP 17: Lies, Damn Lies and Metrics

    In this episode of DevOps Unbound, hosts Alan Shimel and Mitch Ashley are joined by Helen Beal of the DevOps Institute, Viktoria Praschl of Tricentis, Frank Ohlhorst, principal analyst with Accelerated Strategies Group and Alex Hidalgo of Nobl9 to discuss how to use DevOps metrics effectively to improve delivery performance and help teams become high-performing with a culture of continuous improvement. The video is below and a transcript of the conversation follows.

    Alan Shimel: Hey, everyone. This is Alan Shimel and you’re watching DevOps Unbound. DevOps Unbound is sponsored by Tricentis and we’re happy always for their sponsorship and helping up put this show together. DevOps Unbound is an every-other-week session with experts from around the world talking about relevant topics to DevOps. In addition to that, about once a month or every six weeks we will do a live roundtable which is open to you, our audience, to come on, come in, ask questions live, and really kind of steer the conversation. We do have another live roundtable coming up. If you check the devopsy.kinsta.cloud website you can register for that. Today’s conversation, though, is prerecorded and unfortunately that means I get to ask all the questions, not you.

    But let me introduce you to what I think is an amazing panel we have lined up for us today. Well, actually, before I do that let me tell you what we’re going to talk about today on DevOps Unbound. So, it’s the issue of metrics and kind of the ghost in the machine, the dark side of metrics – lies, damn lies, metrics – whatever you want to call it. How do we measure success or failure? How do we measure progress in things, in areas like DevOps or digital transformation? What does success really look like? Our panel is going to talk about that today. Let me introduce you to them.

    First, I’m happy to introduce Frank Ohlhorst. Frank, if you wouldn’t mind saying a few words about yourself?

    Frank Ohlhorst: Sure. And I’ll be quick as not to bore people.

    Shimel: Okay.

    Ohlhorst: I’m Frank Ohlhorst. I’m a journalist, author, and consultant. And I currently work over at DevOps as a contributor, at Security Boulevard as a contributor, and I am also a contributing analyst. And that’s pretty much my story, other than I’ve got 30-plus years – I hate to date myself – 30-plus years in the IT field and I’ve worked both for the federal government, I’ve been a developer, and I’ve put a lot of effort into cybersecurity.

    Shimel: Excellent. Thanks, Frank. Next, let me introduce you to one of my friends from the other side of the pond. I’ve known her now for eight years or more. The one and only Helen Beal. Helen, welcome.

    Helen Beal: It’s a pleasure to be here as always and spending time with you and the others. So, thank you very much for the opportunity. I’m Helen Beal. I’m Chief Ambassador at DevOps Institute, and therefore one of the co-creators of ADOC, which is the Assessment of DevOps Capability, which I may mention once or twice during today’s session. I’m also chair of the Value Stream Management Consortium, and prior to all of that I was coaching in DevOps in a number of different companies across Europe and the Middle East for several years.

    Shimel: Thank you and welcome, Helen. Next up, let me introduce you to Viktoria Praschl. Viktoria, if I mispronounced your last name I apologize. I just realized when I looked at it that I thought I remembered it, but maybe not. Go ahead.

    Viktoria Praschl: It was totally correctly pronounced, so you did a good job.

    Shimel: Thank you.

    Praschl: Hey, everybody. Happy to be here today. I’m Viktoria Praschl. I’m with Tricentis, a software and quality assurance company based out of Austria and Vienna. And I’m responsible for our UP and sales and transformation team where we work a lot with customers on how they transform their organization when it comes to DevOps and quality assurance.

    Shimel: Excellent. Thank you, Viktoria. Our last panel member today also is somewhat of a regular; he’s been with us a number of times. And that’s author, expert Alex Hidalgo. Alex, why don’t you give them a little background and welcome?

    Alex Hidalgo: Thanks so much, Alan. Hi, my name is Alex Hidalgo. I am the Director of Site Reliability Engineering at Nobl9, which is a startup focused entirely on providing the best possible service level objectives, the best possible SLO platform. I’m also an author of Implementing Service Level Objectives, and I’ve been working in this space for – in some way or another the last two decades or so. My current area of research is really into how to bring reliability lessons from other industries into the tech world and what we can learn from others.

    Shimel: Excellent. Thank you, Alex. And then, last but not least, my cohost for DevOps Unbound, my partner in business, Mitch Ashley. Mitchell?

    Mitch Ashley: As always, good to be with you, Alan. And I love our panel. You all are fantastic; I’m excited to hear what you say. As Alan mentioned, business partner and cohost. I run Accelerated Strategies Group, an analyst firm that’s focused on DevOps, cloud native, cybersecurity. And also, I serve as CTO with MediaOps, the company that puts this event on. And both a practitioner and product creator in software, software as a service, cybersecurity for a number of years. I’m not going to name or number how many they are, so you’ll have to guess.

    Shimel: [Laughs] Okay. I’m not guessing. But anyway. All right. Let’s get into this week’s DevOps Unbound. So, I remember a VC mentor of mine getting up in front of – we had launched a new company, he stood up and said something to the effect that in this brave new world we all live in everything can be measured and we measure everything, and it is based upon those measurements we determine who wins and who loses and by how much.

    So, that was 20 years ago, maybe more, a little more than 20 years ago: 22 years ago. I wonder, is it still true? Or have numbers, like everything else, with fake news and all of that, kind of lost their meaning and lost their importance in today’s organizations? Helen, can you –?

    Beal: I’m not sure it’s ever been true. From my experience with metrics I think what I’ve always observed is just people fall into one of two camps. So, either they’re not measuring enough, or they don’t have enough metrics, or they have far too many. I think there’s a cognitive load limit on how many metrics we can handle and we probably need about a handful.

    I think it’s true that we need to have telemetry everywhere, which is of course a very popular DevOps adage. I think we need to have the facility to be able to get to the metrics that we want, but we have to be able to choose them and be able to think of them as an adaptable framework. So, for example, deployment frequency, of course a very popular metric in DevOps, is very useful if you’re moving from deploying every three months to once a week or more. But once you’re deploying several times a day it’s a much less interesting metric.

    The adage I always use is if you can’t measure it you can’t improve it, which is a Peter Drucker phrase. And I do have a problem with that as well because I think you can improve things without measuring them. But the thing is that you’ll never know. And to me that’s the most important thing about measurement: It’s about being conscious about what you’re doing.

    Shimel: Guys, any thoughts on that?

    Ohlhorst: I think it also comes down to an issue of context. People can measure whatever they want out there and they often do, and they spend so much time measuring that they don’t take into account the context of the measurement. You can measure certain processes in the DevOps process and they really don’t matter when it comes down to it when you’re looking at trying to achieve a particular goal.

    Shimel: They don’t. You know what, Alex, we’re going to let you go, and then, Viktoria, you follow up.

    Hidalgo: Yeah, I think one of the big problems that I often see is that people end up trying to measure themselves against others. They hear “Oh, at my last company” – or “I heard at Google or whatever they’re able to deploy X number of times a day and let’s aim for that.” But why? Do you need to deploy that many times a day? Is it actually applicable to you or your application or your organization or your customers? Are you actually gaining anything from trying to do things the way you know others are? Every situation is unique. Every company is unique. Every organization is unique. Every application is unique. And that means you really need to take a step back and think about “What is right for us? What do we need to improve upon?”

    Praschl: Yeah, that’s what I really wanted to say, basically similar, that you take a step back and you really need to look at what’s your baseline. Where are you and what do you want to achieve? What are the outcomes you’re looking for? And I think it’s very important: The metrics will change over time depending – as you mature your processes and as you mature in your organization you will have to constantly change and adjust your metrics which you are measuring. So, I think the key thing is to really initially take a look: “Where am I? And what are the most important initial metrics where I start with?” And then, constantly, basically changing and improving toward further goals.

     Shimel: Great. I think – I’m reminded of the adage “Just because you can doesn’t mean you should.” And I think that’s where we have – and not just in DevOps, frankly, in IT in general. That’s where we run into problems. Because it’s digital almost by definition it’s very easy to grab metrics on all of these digital things, on all these. But just because you can doesn’t mean you should. And just because you can doesn’t mean it’s necessarily indicative. I think, as Helen mentioned, when you’re going to a release a quarter to a release a week, ooh, that’s big news. That’s good metrics. But – and to Alex’s point, not everyone needs to be Google or Amazon and release hundreds of times a day or whatever it is – dozens of times a day. And I think that’s where we get ourselves kind of wrapped around the metrics axle.

    Ashley: I think it goes back to the question of why. If you don’t understand why you’re measuring something, then why do it? Because everybody is not going to be on the same page about how you want to utilize that information. I think about the VC quote that – I remember I was there for that too, Alan. And in a financial world winners and losers, how much return on investment, that’s pretty clear. But I also think there’s a lot of fear around numbers because people are afraid that it’s going to be used against them or it’s not going to be understood, what they really mean. In a continuous improvement context it’s really to – that’s an aid to help you get better and know if you’re getting better, and you have to decide if it’s the right things, which you’ve got to put that context, as Frank mentioned.

    And we have to be on the same page about what it is we really – what does it mean to put a release into production? Is that really – is that a canary release? Is it a real – across every data center that we are in the cloud? What does it mean to do a release? So, you have to get to that specificity. We’re all in agreement that’s – and that’s important to us because we either want to measure ourselves by it or improve at it.

    Beal: I think it’s been implied by a lot of the speakers already, but I just wanted to really want to say explicitly as well that I don’t think metrics shouldn’t be inflicted on people. They should belong to the team. The teams need to generate them themselves. You can set things like KPIs at a higher level and have them connect, but things like OKR should be really generated and owned by the team themselves. And that really speaks to some of the cultural elements at DevOps, which are much harder but not impossible to measure, but things like distributing of autonomy – sorry, distributing authority and having autonomy at the team level to choose and define and improve the work, and that move from leadership from being managers and leadership becoming coaches that are moving impediments out of the way.

    I think, Alex, you were inferring this as well, the importance of the team-level metric.

    Hidalgo: Yeah. One of the things I’d like to kind of bounce off there is I explicitly try to always use the word “measure” because “measure” means something different then “collect.” I think Helen mentioned earlier it’s good to have telemetry everywhere, and so you have numbers everywhere, you have metrics everywhere, you have time series everywhere. And you run into the multiple comparison problem where you don’t really know what you’re looking at anymore. You run into spurious correlations. Have you ever seen that website where it can track people drowning in pools correlates almost perfectly with the number of Nic Cage movies released each year and things like that? And that’s where you end up when you have too many numbers.

    And that’s why I always like to say you measure, because “measure” means you’re taking the important signals out, and you measure flour to bake a cake; you don’t just collect flour. Otherwise, you’re going to not end up with a cake. And it has to be an intentional act, and this kind of – like Helen just said, you can’t inflict metrics on people. You need to let them collect it correctly and measure it correctly.

    Ohlhorst: If we look at DevOps from the pipeline’s perspective it starts to become clear maybe where we should be measuring things or why we should be measuring things. And one of the first things that a lot of organizations run into when they implement a DevOps strategy is they run into bottlenecks because they did not consider certain things. So, perhaps the first place to start with measurement is to try to identify bottlenecks and then go from there. This way you’re improving your process while you’re getting some value out of the metrics, and you’re also establishing what type of metrics you need.

    Beal: I’m glad Frank brought that up because I really think that – for me, there are two classes of metrics, though, that are the most important and underpin everything. And one thing I will say about the DevOps pipeline is in my opinion it doesn’t start early enough. There’s that fuzzy front end and I think we need to expand it right back to where the idea happens. But my duality of metrics is basically if we measure flow and we measure realization of value we really have a concept of what the customer experience looks like. So, we know how fast we’re able to deliver the things that they need and we’re starting to understand whether we are actually delivering the things that they wanted.

    Hidalgo: And I just wanted to add: Frank’s point about bottlenecks is great, but we can get meta about it. We want to make sure we’re very carefully selecting what we’re measuring. And identifying bottlenecks might be a great start but we need to carefully select which bottlenecks we even want to address in the first place. Just because we can see that something slows down somewhere it doesn’t mean that that’s necessarily an area of focus.

    Beal: We could be waiting six weeks for a security check and that’s really hard to get that out of the way, but we could maybe – and Viktoria may be having an example around, I don’t know, test automation or something. Viktoria?

    Praschl: Yeah, I mean, also test automation and _____, you have tons of metrics you can actually measure just from a curious perspective, and if you don’t measure the right things there as well it will seem as if it’s at a standstill. But I think it’s also very important to – I liked the bottlenecks you just mentioned, Frank, because one is the team level, but then you also want to see how does it look from an end-to-end process? How does my overall customer journey look like? And I see quite often companies, actually, they start and they identify the right metrics on the team level, they get the teams there, but then they are failing on the overall picture to bring everything together. A lot of people struggle with that. That’s what I see.

    Ohlhorst: I think the mistake that a lot of the teams make nowadays is they either look at this and they try to relate either DevOps to a waterfall ideology where there’s a beginning and an end and you can measure certain points or they look at DevOps as this rigid structure on how you do things, where the whole idea behind DevOps is it’s flexible and it can be easily modified to meet specific needs. So, I think people run not only into an issue of where “Okay, where do I establish metrics? Why am I doing metrics?” but also how you interpret those metrics. I mean, like we were talking about before, release frequency and things like that are great for what we use as a term is “vanity metrics.” It’s “Hey, we accomplished something.” But when it really comes down to it, what did we accomplish and how did that improve the process? And I think people are losing sight of that.

    Beal: It’s been said already, I think, here but I think that focus on outcomes is really, really key. And I think there’s a couple of other things I wanted to bring up. One is that we talk a lot about being data-driven in DevOps and I’m starting to think actually about being more insights-driven. And the other conversation I’ve had recently is about doing less hypothesis-driven development and more impact-driven development, which I think is another really interesting iteration on our ways of working. And it reminds me of when Alex was talking about this idea of having telemetry everywhere, which is wonderful. And so, the idea then is that you can get any metrics you want. And you don’t want all of them but at least you have the ability to choose them. But as Alex pointed out, there is this downside to this, that we are just overwhelmed with data. And I think that’s something that AI can help us with there as well. I mean, it’s just a fact: There’s far too much data in the world for us to cope with. We need somebody or something probably that we’ve created, a machine to help us with it. So, Alex, I wonder what your thoughts were on AI in the context of measuring our journeys.

    Hidalgo: You’ve asked a very interesting person about this because I’m actually fairly dubious that a lot of these models will actually help. You need a lot of data, a lot of data, to train a model. And most people actually don’t have that much. We may be talking about “Oh, we have too much data” and “We’re swimming in data” and this and that. Very few people have enough data to properly train models. Can this work in some contexts? I think so. And I think a lot of smart people are working on the problem. But I do think there’s a little bit of an overblown focus on it today because I think it’s a lot of trying to fit a square peg in a round hole. We need to – like everything else, as we’ve been talking about, you need to be careful and you need to think about what outcomes you’re really looking for and then decide “Is AI, is machine learning the right thing here?” Because it – just because it’s a buzzword, just because lots of people want to do it doesn’t mean it’s always going to work. You need to make sure that you’re picking the right tool for the right job.

    Ohlhorst: Yeah, and the same can be said with automation when it comes down to it. If you don’t know the possibilities or the probabilities around a process how can you automate it unless you have the data to provide you with that insight?

    Hidalgo: Which, I should say, those words just remind me of what we can do with data is statistics. And actually, when you see me flinch a bit about “Oh, should we use ML?” or “Should we use AI?” I think a lot of the places where people are doing ML they’re actually just using stats. And that’s great because statistics can actually compensate for not having enough data. That’s kind of what it does best in some sense. So, I am a huge fan of using models. I’m a huge fan of using math. Just, again, let’s make sure we’re using the right math. Do we need to build an ML model if a simple regression tells us everything we need to know?

    Ashley: Yeah, I do agree with you about the AI, machine learning of it. It takes a ton of data, if that’s a measurement, in the data world. I want to go to something that you said, Helen. I really like the word “outcome.” What are the outcomes that – have we achieved an outcome when we’re developing software or creating an experience or something out of the process? Because ultimately, that’s what matters. We can improve the things within it. We can automate the processes within how we create software. But it’s all for a purpose. It’s all for – if we’re not doing a better job of delivering on an outcome, maybe those things we’re working on internally are sort of navel-gazing, if you will, looking internally but it isn’t really that valuable. Let’s work on the things that we can connect to an outcome. That’s what I would propose.

    Beal: It’s funny. The other day – it was at DevOps Enterprise Summit and she went up to speak because she used the phrase “time to market,” and I kind of in the Slack chat went “Oh, time to value,” because obviously there’s no point in getting something out the door if it’s useless, whereas with “time to value” at least we’re recognizing that it’s been – giving something useful to something. And then, John Smart corrected me with “time to learning.” And I thought, “Oh, no, actually, it has moved.” We’ve moved from time to market, time to value, and now we’re in time to learning, where we’re recognizing that actually only – something only becomes useful when we’ve seen it have value and we’ve learned from it and decided to do something else.

    But yeah, it’s the same as this kind of impact-driven development as well, this idea that we really focus on having an idea about what we’re trying to do, and then, importantly, measuring that it did what we thought it was going to do. And we’ve been traditionally really bad at doing this in the technology world because we’ve been really project-driven. And when we’re project-driven we have huge amounts of requirements which are (a) really difficult to track, the impacts of, because we deliver them all at once and we weren’t doing things like canary testing which does allow us to look at a much more granular level. And the other problem with being project-driven is we’re always under so much pressure to deliver. Our testing always gets squished because our development overruns and our launch date never moves. So, by the time things go live we’re so exhausted, and then we disband the team and put them into other places anyway, so no one ever goes and has a look and says, “Did that really deliver the four million quid that we – or $4 million that we said it would?”

    I wonder what other people think about how metrics change as we move from project to product.

    Shimel: So, I’ll quickly jump in here on that, and that is – and it’s, Helen, something you mentioned, Alex mentioned. I think what we’re guilty of – and that’s part – in the abstract we talked about the dark side, and it’s not that “Mitchell, I am your father,” but there’s a dark side of these metrics which are that in the absence of facts or in the absence of knowledge we try to fashion metrics to compensate. So, with something like DevOps where there’s a lot of cultural aspects that come into play, there’s a lot of intangibles that come into play, and they’re almost by definition hard then to measure because they’re intangible; they’re not tangible. And so, we compensate by coming up with what some may consider frankly nonsense metrics that make us feel better or make us feel like somehow we are measuring the immeasurable. And I think that is an important part of this whole thing. Measure what you can, but are there things that are just immeasurable? Anyone?

    Beal: Yeah, I – sorry, me again for a second. I don’t believe so. As a coach and a consultant for a long time I was discovering clients that felt that their biggest problem with deploying DevOps or implementing DevOps was the cultural side. So, that seems like something that you can’t measure. And it’s true that you can’t really get data out of Jenkins to tell you what’s happening in your culture but there are other ways to do measurement. And I think it was Viktoria – sorry if it wasn’t Viktoria, but somebody said the important of baselining your current state, and that is absolutely essential. And I think people don’t always do that. They kind of dive in to try and get metrics without really kind of going “Okay, this is where we’re starting from figuring it out.”

    So, from the human aspect – I mean, talking about ADOC, which I mentioned earlier, the Assessment of DevOps Capability, we have 5 different dimensions in that and each dimension has 12 subtopics, so we have 60 topics in total. And I’m starting to sound like we’ve got way too many metrics, but there’s a lot of subtlety in the way that it’s baselined. And the first dimension is human aspects. And within that we’re really getting a feel across an organization, team by team, where they feel their level of capability is around things like psychological safety, around transformational leadership, around how much autonomy and mastery and purpose they have in their daily role.

    So, you’d be surprised, I think, about how possible it is to measure cultural capability without necessarily having a knowledge of how many – or relating it to how many artifacts you’ve got in your artifact repository. There are other ways of doing this. And sorry, I interrupted you, Alex.

    Hidalgo: No. I think those are all great points, but we do have to, as with everything else, approach it with a little bit of caution because especially if these are self-reported, if these are numbers that you’re looking at like “Are you happy on your team?” “Do you think your organization is headed in the right direction?” – those normal kind of questions and then asking people yes or no, or do you put it on a sliding bar from one to five? And studies show most people are going to just take a one or five anyway. And that’s not saying this is bad. It’s just something else that’s another caveat. It’s another “Let’s make sure we’re looking at this correctly.” “Let’s understand that some percentage of our employees are just going to click through it because they don’t want to fill out this form.” If it is this self-reporting thing, you know?

    Beal: It’s such an important point you make, Alex. And it’s something that we deal with when we engage with organizations. There’s such a lot to talk about, because what you’ve actually identified there isn’t a problem with the tool; it’s a problem with the culture. And if people are not feeling that they are part of the change that the organization is trying to make and they’re not empowered to have their say and their voice and be involved in it then they will skew their answers.

    So, we absolutely have to help people understand how important their answers are, what impact they’re going to have on their future and their ability to grow themselves in their organization and make them feel part of the change. But yeah, humans can be a tricky business. But back to your point about data volumes, again, in this kind of assessment environment it is quite important to have enough data to weed out variations from people that maybe don’t care or are skewing for other reasons.

    Hidalgo: Which, again, you can do some basis statistics to ensure that you are dropping your outliers. You – to be able to get very useful data out of this stuff, again, you’ve just got to make sure you’re looking at it in the right way.

    Shimel: Viktoria?

    Praschl: Yeah, I think quite often we just force metrics on teams, so that’s why I like it a lot, what you said, Helen, that you need to also understand the culture. So, where is the team from a metrics perspective? Do they understand why we are measuring? Or are you already in a stage where they say, “Okay, I understand why we are measuring certain things,” but now we need to constantly figure out which metrics we are measuring?

    So, I think it goes back to the team and explaining the “why” and then really helping them or work with them together, once you have the outcome, what do we do with that? How can we improve? What do we do with the outcome of the metric? What do we do with the numbers? So, I like it a lot, what you just mentioned on assessing the culture.

    Beal: Yeah, and that’s a great point. We baseline but we baseline for a reason, because we – I talk about the improvement culture a lot, so that four-step process where we start by establishing the long-term vision direction, then we establish current state, then we establish our next target state, and then we PDCA or experiment between those two states. So, kind of the finishing part of that first cycle is defining the hypotheses and executing them, and then we start again. And we’re not baselining now; we’re comparing it against our baseline at a time period of three, six months and what’s happened with our experiments in between.

    Praschl: Yeah, because I think most companies, they just don’t know. They don’t know where they stand. They don’t know where the team stands. They don’t know where the culture stands. So, that’s the starting point to get everything rolling.

    Beal: And it’s a big investment, Viktoria, for people to go down this path not to know how far down the path they’ve got.

    Praschl: I think for that you need the executive buy-in as well. So, it’s like making sure that you have from the top also the support that you do that. And then, as you go into this constant learning process, I think it becomes very important there.

    Hidalgo: And trying to look at how far down the path you’ve gone, that – it’s going to, again, be different for everyone. Is it more important how far or how far you have to go? And is there even an end to the path? Or is this a process that’s ongoing forever? And just another example of having to be thoughtful about what’s being measured.

    Beal: I don’t believe there’s an end to the path, which is why I use words like “capability” over “maturity,” because “maturity” indicates that there is some kind of a horizon that you can reach. But of course, no matter how many more capabilities you’re building yourself we live in a market that’s forever inventing new ways of doing things and new tools to support the things that we’re doing. So, it’s an ever-moving target that we’re trying to respond to.

    Ashley: I think there’s a whole nother side of metrics I don’t know if we’ve touched on yet, and that is the metric itself can be valuable and inform us about some things, but I also think the analysis of what’s – why? What are the potential causes? In a quality process you do a Pareto diagram to kind of analyze what you think are potential contributing factors and what maybe is influencing why it’s happening in a certain way to try to get to – if you’re – for example, if you’re doing a process improvement what parts of this – a lot of things go into whatever created that metric; how do we know what we might work on first or doing some experimentation with?

    But the ultimate thing is there’s a lot of learning that comes out of that process. It really kind of helps you understand “Wow, I had no idea that’s actually how it was working.” And now that we know that with a little more fidelity we can make some adjustments.

    Beal: That’s powerful. I wanted to respond to Alex, actually, and then I forgot – it went out of my mind. But this idea that the team needs the right metrics – and Viktoria and I have both said those metrics should not be inflicted on the team, but the other thing is most organizations are made up of multiple teams, and different teams, like Alex said, have different capability patterns. But it’s very interesting to try and understand, for example, why one team is really good at something like diversity and inclusion or really good at AI ops or something, and not saying that the other teams are bad but trying to learn from those success stories. And I think it’s probably the Phoenix Project that put it, it was making local discoveries and global improvements.

    And I think that kind of mindset of looking for the strengths and spreading the strengths across a business is really important when we’re doing things like measuring people on their journey because the – we talked about culturally that people are kind of either scared of this stuff because they’re expecting to get beaten up about it or they’re cynical and they’re not giving true answers. But there’s another side of this, that people are also quite afraid of being assessed or even assessing themselves because somebody’s going to go “Well, you’re shocking at deployment frequency. What are you going to do about it?”

    And it’s like we have to change that whole mindset in an organization that they are a dynamic learning organization. It’s all about continuous learning and not about beating people up over the head or removing their annual bonuses or the like, which are things that I’ve seen in various places.

    Ohlhorst: Which gets us back to that key point of the “Why are we measuring?” Making sure people on the team know why we are measuring things, not only from a cultural perspective, but also from a value perspective so that they know that by them giving their answers based upon queries that there is value to that, and that is the “why” behind it. And ultimately, the goal is to improve processes or accelerate SDLC or whatever it is, but there is a goal there that is not just random data being thrown out asking “What flavor of gum do you like?”

    Praschl: Yeah, I think it’s also –

    [Crosstalk]

    Praschl: It’s important to get them to understand the “why.” It’s usually a long and not as easy of a process. But once they have this and understand it you have the buy-in and the outcome will be way more worth it if you do that way.

    Hidalgo: A thing that I’ve found that can help with this kind of stuff is people underestimate how powerful interviews can be. Instead of just asking people to self-report or just collecting random numbers out of your computer system sit down with people and talk to them. Not for five minutes. Schedule an hour. Sit down, find out what is this person thinking? Make sure you’re talking to the right people, not just in terms of an organizational structure, because you do want to make sure you’re talking to people at all levels of the company and all roles. But also make sure that the people you’re interviewing are comfortable with it in the first place. Not everyone has the personality to want to sit down for an hour.

    So, another example: Select carefully. Measure carefully. But I’ve found so much value in just – instead of trying to do this in some – a method that is based around metrics. We’re talking about metrics. Sometimes you don’t need metrics. Sometimes you just need the human interaction and you can walk away with that if you really want to then throw that in that kind of scale and attach a number to it maybe. But you can learn a lot just by talking to people.

    Beal: I think the best assessments are always a combination of quantitative and qualitative data. And I think we’re seeing this increasingly in the data world as well. About 80 percent plus of most businesses’ data is unstructured, which by its very nature is that kind of textural response data, whether it’s on social media or in your logs in Splunk. We’re seeing more and more people understanding that it’s not just about what’s in an RTMS. So, I absolutely agree with you, Alex. Yeah.

    I think there’s a big advantage, though, which I’m going to point out, around ADOC. So, some organizations are very large, so when you’re spending an hour with people and there’s 8000 people it’s quite impossible to speak with 8000 people. So, actually having an ability to empower everybody to be involved in the change by giving them a platform on which to share their opinions is quite useful. And of course, you can put open text fields in there as well and get those snippets and insights that you would miss if you were just getting a one to five or yes or nos.

    I did want to maybe slightly disagree with one thing you said, though, which is about the people that don’t want to talk. It always kind of worries me – and this is the big thing about, I think, diversity and inclusion and things like Heloxi that they are trying to give equal voices to people, is I don’t want us to fall into that trap where we think “Oh, that developer is really quiet and introverted; we won’t ask them what they think because they don’t really like talking.” It’s like they’ve probably got just as much right to their opinion as everyone else and we shouldn’t avoid hearing it because we just think maybe they don’t like chatting as much as other people.

    Hidalgo: I totally agree. But from my point of view you’ve just got to make sure that whoever is comfortable with the process – people don’t want to feel singled out. Just like everything else, depending on the person, depending on the culture, depending on the team, they might feel like “Why am I being picked? Is this a bad thing?” So, it’s just looking thoughtful. That’s all I meant. Definitely don’t want to exclude anyone. Definitely want to make sure we’re getting every possible voice. Just want to make sure people feel safe about it.

    Beal: Totally. And that psychological safety is so important. I learned this from one of my clients years ago. We didn’t use to do things like participant briefings, and now I think it’s really important to get everybody that’s involved in this type of work and talk to them about what DevOps is and the “why” that we’ve all talked about – so, organization performance and succeeding in a disruptive market and all that kind of stuff – and then give them the comfort about anything that they share is between them and the people that are collecting that information. And they may be quoted but they’ll never be associated with what they said. Their words may be used as an example but they can be completely honest. And actually, they are being asked to be involved because their opinion is so highly valued in the organization and we want to gather their insight, so they shouldn’t feel fearful or that their job is at risk. They should feel honored and hopefully excited to be involved in a process that’s intended to make their future more fun and secure.

    Hidalgo: The only other thing I’d add there is – and again, I totally agree; I think we’re actually –

    Beal: Finally agreeing.

    Hidalgo: – in agreement here. Yeah. Yeah, exactly. But the one other thing I would add is that even if we have a strong suspicion or even have the numbers to prove that our organizations or our teams generally are psychologically safe and we’re building a good culture here and this and that, you don’t know what it was like for people at previous companies. People can carry baggage for a long time. It can take people a long time to adjust, especially as your career goes longer and longer. You have these memories and not all of them are great. And so, even if you think “Ah, our company as a whole, we are scouring very high,” for individuals it may not have anything to do with the current organization at all; they could still be carrying some scars from previous ones.

    Beal: Yeah, and there’s –

    [Crosstalk]

    Shimel: Viktoria?

    Praschl: It’s about creating the safe space. So, some probably will take longer to open up, but usually if you see that others are joining and the more comfortable you feel, you also get those people to open up down the road.

    Shimel: I think we’re all humans, to borrow a phrase, and we bring our own experiences, outlooks, prejudices to whatever metrics we’re going to measure and to whatever we’re going to be in. And I think we can’t lose sight of that either.

    Beal: Right. Those scars that Alex was talking about, I just wanted to talk about one other element of this, which is that the scars are negatives. We’re never badly affected by positive experiences, if that makes sense. So, from a neuroscience perspective we basically train our minds to be fearful. We keep on avoiding – we have an avoidance response that’s trained into us. So, I think I really like to try to use neuroscience when I’m helping people through a DevOps change because there are things we can learn from it, things like neuroplasticity and these different avoidance and approach responses that we have in different scenarios. And actually looking at an organization as a whole is great, looking at different teams and how they compare, but actually understanding, as Alan has just said, that how individual humans operate and in the context of their previous experiences and just how we’re built, because we’re all built differently from _____ anyway, is really important. And that’s really where the transformational leadership comes in and having people that understand how to be coaches and how to understand people at a personal level.

    Ohlhorst: Interesting that we’re talking about the process from almost applying a “flight or fight” type of ideology to it, that here we are talking about software development and DevOps in particular and pipelines and all that, and so many people so often forget that there are people involved in the process. And that is where you come up against the most challenges.

    Shimel: Yeah. It’s about the humans. Guys, we are – we’re about out of time, though we could probably sit here and talk for the rest of the day. But it wouldn’t – I don’t know if anyone would want to watch, and we all have other things to do. What a great conversation on metrics and DevOps and people and everything else today. Maybe we’ll come back and we’ll run a part two of this or something. But for now I need to pull the plug.

    I want to thank our friends at Tricentis for making DevOps Unbound possible with their sponsorship. Alex, Helen, Viktoria, Frank, great conversation, man. Great conversation, men and women. Good stuff. Mitchell, you want to take us home?

    Ashley: What I’m struck by is the richness of just the word “metrics” and what all it can mean and the depths of it and aspects, whether it’s the human side of it, whether it’s the “why,” whether it’s the outcome. There’s several – I think there’s several good takeaways there from this, and so I hope it’s helped everyone kind of think about maybe why you’re doing what you’re doing and how you want to lead that going forward.

    Shimel: Excellent. All right. This is Alan Shimel for MediaOps, devopsy.kinsta.cloud, here on DevOps Unbound on TechStrong TV in the TechStrong TV network. We’ll see you in about two weeks with another great DevOps Unbound episode, but for now this is it. Thank you, everyone. Thank you for watching. Take care..

    [End of Audio]

  • Datadog Cloud Security Platform Advances DevSecOps

    Datadog Cloud Security Platform Advances DevSecOps

    Datadog has launched a Datadog Cloud Security Platform that promises to advance DevSecOps by identifying potential threats using the same agent software many DevOps teams already rely on to instrument applications.

    Renaud Boutet, senior vice president of product for Datadog, said organizations that rely on the Datadog software-as-a-service (SaaS) platform can now more easily invoke security services based on the same data model used to observe applications.

    The security services provided by Datadog include a cloud security posture management (CSPM) offering that identifies misconfigurations and applications that are not compliant with industry standards such as the Payment Card Industry Data Security Standard (PCI DSS).

    A cloud workload security (CWS) offering, meanwhile, detects threats to production workloads by monitoring file and process activity, while a monitoring tool identifies threats to cloud environments by analyzing operational and security logs. It also provides integrations and threat detection rules that are easy to extend and customize.

    Finally, there is an application security tool, currently in beta, that identifies and blocks attacks that target code-level vulnerabilities, such as SQL injections and cross-site scripting (XSS) exploits.

    Boutet noted that many DevOps teams are reluctant to roll out security platforms that require them to deploy, manage and update an additional set of agents across their application environment. Datadog is now effectively unifying application observability and security in a way that makes it simpler for those DevOps teams to embrace DevSecOps best practices, added Boutet.

    In some cases, the dashboards surfaced by Datadog will be employed by DevOps teams that have assumed responsibility for cybersecurity as part of an effort to shift more responsibility for application security further left, noted Boutet. In other instances, cybersecurity teams will be able to view the same alerts shared with their DevOps colleagues, he added.

    Pressure to address DevSecOps is mounting in the wake of a spate of high-profile software supply chain breaches. While the majority of organizations have not been breached, questions are now being asked at the boardroom level as concerns over application security increase. Many organizations are wondering if they should slow down the pace of application development to ensure better security and to what degree.

    Regardless of the path forward, awareness of application security has never been higher. An executive order issued by President Biden calling for improvements to security will likely have a cascading effect across not just government agencies but also on organizations that do business with those agencies. One way or another, DevOps teams and cybersecurity professionals will be required to work more closely together. The challenge is striking the right balance between security and productivity. Most developers are never going to become world-class security experts. Conversely, most security professionals know next to nothing about coding. That doesn’t mean, however, that efforts shouldn’t be made to educate both camps as much as possible. After all, even a small amount of education can have a profound impact when most of the attacks being made against applications are not especially sophisticated.

  • EP 13: Observability and Performance Testing

    EP 13: Observability and Performance Testing

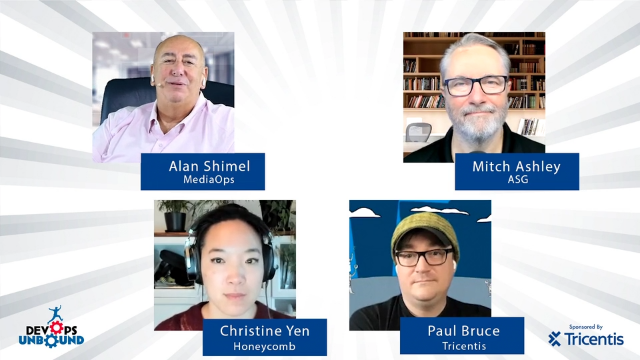
    In this episode of DevOps Unbound, Alan Shimel is joined by Christine Yen of Honeycomb, Paul Bruce of Tricentis and Mitch Ashley from ASG/MediaOps to discuss how to effectively test the performance of your applications and how bringing observability into testing environments helps DevOps teams identify and resolve issues early in the SDLC. The video is below, followed by a transcript of the conversation.


    Alan Shimel: Hey, everyone. I’m Alan Shimel, CEO of MediaOps, Editor-in-chief of devopsy.kinsta.cloud, Security Boulevard, Container Journal, and you’re watching DevOps Unbound. DevOps Unbound is a biweekly video series where we have some of the leading lights in our community talk about topics of interest around DevOps. We’re lucky enough to be sponsored, DevOps Unbound, by our friends at Tricentis, so many thanks to Tricentis for their sponsorships. But this is a media ops event.

    Let me introduce you to today’s panel and then we’re going to jump into our topic. Let me first introduce the guy with all the robots in his background there: Paul Bruce, with a 404 shirt. Paul, welcome. Why don’t you introduce yourself to our audience?

    Paul Bruce: Sure. Thanks, Alan. So, my name is Paul Bruce, as you said. I’m on the nerdy side. I’m a performance and reliability geek. That’s just a place of complexity that I love to – it’s just what – it’s just my bag; it’s just what I like to do. On the other side I’m a community organizer. I work with DevOpsDays Boston and the Boston DevOps Meetup. I am hosting an event along with Liz Fong-Jones this year called o11yfest around observability, a vendor-neutral and also – community-focused but also the open telemetry project-focused two-day event. It’s half days so that we don’t burn people out. And I work with the Tricentis team since the NeoLoad acquisition – again, performance reliability. I was with Neotys and NeoLoad for years now. I really loved that team. And I love my new one, the broader one at Tricentis. So, that’s me.

    Shimel: Very cool. Thanks, Paul. And then, joining Paul today is – we’re very lucky to have her – someone I’ve had the pleasure of interviewing more than several times now over this past year of Covid but hopefully soon to see in person, my friend Christine Yen. Christine is CEO of Honeycomb. Christine, welcome.

    Christine Yen: Hello. It’s wonderful to be here. Alan, you shared my title, but my background is as a product engineer. Honeycomb, for anyone who isn’t familiar, is a tool who – a tool for observability. And I love working on it and I love talking about this topic because even though I tend more towards the software engineering side I have done my fair share of breaking production, and so this topic is near and dear to my heart for software engineers to do that less and find out what their code really did more quickly.

    Shimel: Very cool. Thanks, Christine. It’s great to have you here. And then last but not least is my cohost of DevOps Unbound. We’ve worked together for probably longer than either of us want to admit, but it’s hard to believe we’re both only 25. But CTO here at MediaOps, CEO of the Accelerated Strategies Group, Mitch Ashley. Hey, Mitch. Welcome.

    Mitch Ashley: Thank you, Alan. But the best 25 – this year again. Twenty-five again, right?

    Shimel: Yeah, 25 again again.

    Ashley: Good to be here.

    Shimel: Anyway – yep. Thanks, Mitch. So, today’s show, really, we’re going to explore the intersection – or maybe it’s a border between performance, performance testing, and observability. What – how do they play with each other nicely? What is the interaction? What is the relationship? And for those in our audience, you may be looking at it and saying, “Well, observability is kind of almost post-deployment. Hopefully we’re doing some performance testing pre-deployment and then post-deployment.” But how – I don’t know if I see a nexus right away but there’s – in my mind anyway there’s an obvious nexus. There’s an obvious connection.

    So, let’s talk about it at a high level. How is observability and performance testing connected? And how can they – how can we get a one plus one equals five or four out of performance testing and observability? Christine, if it’s okay, I’m going to ask you to kick off with that and kind of lay out the framework, the ground rules, the – and we’ll all jump from there.

    Yen: Well, laying out the framework and ground rules is a little bit of a big ask for early in the morning, but I’ll do what I can.

    Shimel: Okay. I’m sure you’ll do great.

    Yen: I’m wearing the wrong shirt for this. I often – I think I’ve come on one of these interviews with my “test in production” shirt, but it’s a phrase that too many folks – it can be interpreted in many ways. What does testing in production mean? There is a version of it that means, well, I’m not going to run tests beforehand; I’m just going to see what breaks in production and try to fix it after it’s impacted users. Obviously, that’s not what any of us mean. And there’s a version of it that means, hey, look, when you write preproduction tests, when you write any sort of tests, what you’re trying to do is you’re trying to compare actuals versus expected. You’re trying to form a hypothesis, observe reality, and then think about that difference. Isn’t that really just a different phrasing of what we’re trying to do when we’re looking at production, where we’re using our logging or monitoring or observability tools to see what actually happened when our code is in production?

    And so, I love – I think it’s a huge intersection, a huge overlap between things like performance testing and observability because we are all using the same skill set, we’re all using the same brain sequence, but there’s – people seem to think that observability is – can be more exciting because it’s incidents and downtime and alarms are going off. I don’t think it is. I think it’s all the same. It’s just at different points in the development life cycle. It’s on different timelines. It’s with a different level of urgency. But it’s the same thing we’re all just trying to do to come up with hypotheses, validate them, and learn.

    Ashley: I really like, Christine, the way you kind of intersected them together because the environment that we’re doing all of this has changed substantially. It wasn’t that long ago where it was kind of a static flow of writing codes, we’d test it, we’d CI/CD, we’d test it, we’d deploy it into production. And DevOps helped speed that up with automation and tools, and of course tools of automation for testing. But now the software stack is fluid. The infrastructure is fluid. The code is fluid because we may have introduced three new changes to containers, for example, in a cloud-native application since we’ve really had an opportunity to go and debug or determine what the source of that was. We also have dynamic applications that start up and go away, and those things may be long gone by the time we actually look at them. So, I think this key to observability is also giving you insight into an environment that may not exist at the time that happened, and so you need that information to be able to understand “This is really something I need to fix, address” – a bug, a feature, whatever it might be.

    Bruce: Yeah, and I think there’s a lot of intersection between putting pressure on systems, whether that’s through actual users and risking revenues and all sorts of things or doing prerelease type testing or testing in production. There’s a – performance is about how does this system perform to expectations? And there are a number of different people with a number of different expectations. There’s the technical expectation, maybe articulated – hopefully articulated in something as legitimate as an SLO or an – and then measuring them with SLIs and stuff. But there’s also user expectation. There’s the CEO expectation. There’s B2B. If you’re in some kind of regulated industry and that SLA is actually part of a legal requirement that becomes really important. Like, we saw that unemployment sites – I don’t mean to pick on that kind of work, but that was a mess. Same thing with various different – trying to get the vaccines scheduled and stuff. And it’s like why are we still suffering from these systems that are out there and they’re good enough maybe for the day to day but have never been exercised, have never been – the concept of that being – that scaling has never really come about for that system.

    Okay, well, what about systems that do by default have scalability as a first class citizen? Going back to some of the stuff that Christine said – and actually, Christine, I love – your cofounder Charity has a phrase and I’m going to butcher it, but “It’s never not a good idea to have your glasses on when you go driving.” That idea that if you can’t see what’s going on that’s a big problem.

    So, a lot of people traditionally would have used something like “Let’s just throw all our APM tools at production.” And that’s great. But going back to that original thing where I was saying pressure on systems really shows us how well we’re doing engineering, the impact of that pressure matters too. So, as a performance engineer, performance and reliability engineer, I’m constantly not just trying to – as my French team would say – make load on a system, put load, put pressure on a system, but I also care deeply about being able to measure the impact of that.

    I’ll pause there because we probably some other questions. But there’s more to go into about that. It’s not an either-or. And it’s not about just production or preproduction. It’s about what’s not a good idea to have visibility. Isn’t it a good idea to have visibility on a thing, whether it’s putting pressure before release and having visibility or doing that in production? We’ve got a lot of customers who do testing – who do load testing in production on production systems. This is not an impossible thing, folks, you know?

    Shimel: So, let me try to put this in some kind of context that we can jump on. So, here’s what I say Christine saying, which is – and maybe I’m taking it up a couple notches, getting out of the SLO woods – at the end of the day what do we all want? We all want our apps, our infrastructure to run better. We want to have good predictability, visibility into how things are performing. And whether that is an aspect of performance testing, or you want to call it performance monitoring, or do you want to call it observability, at the end of the day the aim is the same, which is let’s understand how our stuff is running and make sure it’s running the way we think it should be running. So, at a very high level it’s almost equating performance or observability – I mean, it’s all with the same goal, which is let’s make sure our stuff’s running good, as the best we can.

    In my mind – and Christine, I’ll defer to you – certainly over the last year, year and a half, maybe two even, observability has taken on – as it’s become more hyped and a real word, a real thing out there, has taken on almost an even bigger mission than that, where it just doesn’t equate with – the goal may be “Hey, let’s make sure things are running the best we can make them run and how we expect them to run,” but there – observability has a whole uber mission of things that people want to do with it or use it for. Paul, you mentioned APM. Kind of observability subsumed APM, AI ops, all of these things. But yet, wait, there’s more. Observability does more than that. It’s become this whole big thing out there. And maybe it – maybe that’s right, maybe that’s wrong. I’m not here to judge.

    But that, I think, is really the crux of this. Yeah, we all have the same goals. Is observability – part of what observability does helping the performance engineer? Absolutely. Is there more to observability? I think so. Christine, you’re the observability expert. I’m going to ask you.

    Yen: You know when you say a word enough times and it starts to lose its meaning and you’re like “This is starting to sound funny”?

    Shimel: Yeah.

    Yen: We – I think you’re – there’s – we are definitely approaching that with observability a little bit. And whenever I get to that point I like to pause and remind folks “Let’s look at the – let’s take a deep breath and look at the English word we are using to describe this. It’s not a bucket full of buzzwords. It’s not a bucket full of types of data. It is an ability to see. And it’s the ability to see into our production systems. What do you want to do with that? What can you do with that if you have an improved ability to see?”

    Okay, well, now we have the laundry list of all the things that we can do once we have the ability to see into these systems that, as Mitchell mentioned, are so different than they were five or ten years ago.

    Shimel: Oh, yeah.

    Yen: And that to me is – that zooming out behavior is what re-centers me when it feels like we’re trying to do all the things. And you’re like “Well, it kind of makes sense. I want to have my glasses on when I’m driving.”

    Shimel: Yeah. Paul?

    Bruce: Christine, you’re definitely right about a buzzword merry-go-round. I have experienced that with “DevOps.” I have experienced that with – oh, man, I can’t believe I’m saying it again but I’ve got to because people will know – “shift left.” These terms that just get all the things. And we go at these things, these different terms, we latch onto them, we try to make it our own. Oh, man, vendors love to do that. We’ll take a word and we’ll make it ours and we’ll try to align it to our product strategy. And at the end of the day it’s like there’s 150,000 different versions of this thing, which as a performance guy I’m kind of like “Well, it’s not bad to have a big sample set,” but the sample set of what’s going on in the delivery chain from good idea to working software that’s making you money is not just in production.

    Let’s take an example of Nike, for instance. This is a known thing that they ship the watch, the watch that you open up on Christmas Day, and you go to connect to the internet and because the servers were swamped you don’t have a good Christmas experience. That’s not the only – I’m just picking on… But that kind of situation is a situation where there’s a lot of stuff you can do to prevent obvious faults from getting to the point where that’s the bad experience. And you also need visibility on the day where your production is having problems. And it’s not just the day; it’s every day. Every day you have a certain un-zero amount of events and issues in your production systems. How do you address those things? Well, there are plenty of situations where if you’re only thinking about observability as it only applies to production – which, by the way, production is where – what makes you money. If code is not sitting in production doing something useful for people you are not making money off of it necessarily. And production isn’t just out for consumers. It could be all the different constituents in your larger organization. So, even private systems are production. And so, if something is not out there then it’s not making money.

    So, is that the only place where we should pay attention, where we should have good visibility on logs, traces, and metrics, on understanding how the business is impacted, long and complicated queues and delays in these systems? No. I mean, yes, in our edge and final production systems, yes, of course we will want that because we don’t want to be in a bad situation not having the right visibility into problems when they’re happening in production. But how do you think problems come about in production? Well, there’s the emergent ones that we can’t possibly know about. Ooh, there’s just so much time in the day. But then there’s a whole bunch of other stuff. Every line of code is not just an asset; it’s a liability. So, as you’re constantly shipping these things out there’s plenty of things you can do to prevent obvious – and I mean dumb and stupid and obvious things from getting out there, causing toil, waste, risk, and loss of brand, revenue, and all that stuff.

    So, I think the observability for me is not just in production. It’s really useful to have classic monitoring in preproduction environments except for that it’s super expensive. Oops. And then, observability, pieces of observability, which Christine would probably be better to go into, all those things that you can do and what you get out of that, and now we can have use cases, that also applies to preproduction situations. That’s why I’m so excited about that open telemetry project and the community over there, this notion of being able to emit information from your systems, to either build it in directly from your systems or put it on sort of after the fact, sort of replacing some of the obvious early agent type stuff that monitoring used to be the only thing that could do. That open telemetry stuff now makes it a standard that we can all benefit from no matter which environment. How about all environments? That would be super nice. And to get tracing and traceability from – all the way from the Web app that somebody is touching all the way down to the database and the 30 different APIs that it touches.

    That’s really useful, not only to firefight in production but to see “Am I risking dependencies? Am I go wildly off my architecture diagrams?” You know what I mean? Those things slide. Your conceived architecture diagram is never what’s actually running in production. So, to actually be able to have visibility on that is really important.

    Ashley: Well, you know, Paul, the lines between production and, let’s say, tests are blurred, to use a phrase – are really kind of blurred, and oftentimes when we adopt whatever new technologies or approaches we’ll attempt to do what we used to do just using a new technology to do it. So, we’ll test the way we used to. And just what sort of clicked with me with cloud early on was how Netflix was doing their rolling upgrades and being able to flip back and forth. The same is really true for testing and performance testing because your availability to resources generally is not an issue, or not the issue it would be normally in an environment where you’re not in the cloud or at least partially in the cloud. So, there’s a lot of things you can do not just in your current testing environment but to set a pretty elaborate – with resources to do different load tests, performance test scenarios, in addition to what you experience in production.

    And I think one of the points that you made is salient, is if you’re paying attention to this you now understand your systems, your applications, your environment enough to identify “Well, we may be able to handle the number of unemployment claims we’re getting today but I know when we reach the next peak these are the three things it’s going to impact. I know those are the things we have to go adjust or fix or whatever it might be.” Because you’ve already instrumented it well enough and you have the information through observability to be able to do that. So, I think that’s a different mindset of how we think about performance testing.

    Shimel: Yeah. So, I tell you, I think one of the big breakthroughs of DevOps has been to create our “testing environments” to be more lifelike, to be more real lifelike. I mean, because prior to DevOps, the world I grew up in, the classic thing is the developer developed, gave it to the ops guy, the ops guy puts it up and says, “Wait a second, this stuff don’t run.” And he says, “Hey, developer, this doesn’t run.” And the developer says, “I don’t know, dude. It ran on my machine.” And so, there was that disconnect between what the developer wrote and ran it on or they tested it on versus the real life production environment. And one of the great things about cloud and virtualization and all of this stuff is that we can theoretically really duplicate our production environments and test environments and we can increase loads and we can do all those things theoretically so that there’s no or less surprises when we go live in production. And that – look, that’s – thank you, DevOps. That’s part of what this whole DevOps thing, I think, was.

    But I don’t know, is – Christine, is that really – does that dog hunt or is that just DevOps urban myth? You know?

    Yen: I think you’re on – right on the ball. I mean, when Charity and I started Honeycomb she came right – that story you told, I was that dev; she was that ops. I did the whole “It works on my machine; I don’t know what you’re talking about.” And when we started Honeycomb we thought honestly we were going to be talking to more of the Charities of the world. We were like “Oh, this is a tool for ops people. They’re the ones who understand the pain.” And as Honeycomb grew and as observability grew it became more and more obvious: “No, this is for the Christines of the world too.” This is for the people who need to understand what happens beyond that testing environment. This is – the boundaries are blurring or – I like to think of it as dev and production are coming closer together because there are more and more things we just can’t test in a test environment. As good as we make the test environment, we just can’t.

    Shimel: I totally agree.

    Yen: And there are so many things that can be learned – the same – by thinking of production as part of the development environment. With feature flags we can start to take code that is really not quite ready for production but test it out in a safe way and learn from it. And that’s so cool. It’s – there’s so much for developers to be able to learn when everyone kind of gets over this mindset of “Well, there’s a wall between development and production.” There isn’t. There shouldn’t be between people or the software. And that’s where all the exciting parts live.

    Shimel: I don’t disagree. I don’t disagree.

    Bruce: So, Alan, one thing that you said – you painted sort of the stage so that we could have part of this conversation. I’m not a big fan of setting up huge staging environments. In classic world it was like, okay, well, here’s production and it uses 36 Oracle back-ends and – if we were going to run a proper performance test of course we needed 36 on our side. And before the cloud that was incredibly expensive and you’d fax your IT person and they’d get back six months later with the right hardware. And I think there’s a myth that, well, yeah, you need to be realistic at some point, especially when you’re putting pressure on a system, to answer the final question, which is – what? – is it ready enough for me to be – what? – confident enough that this thing is going to transition like we talk about in standards, the transition process, that that’s actually going to go smoothly? And not in a waterfall way, just in a – to get away from this notion of “It worked on my machine” and now the ops person is putting out fires and doesn’t know how to operate the thing.

    But I’m not a big fan on spending a ton of money on this staging system which ultimately even if – even if at a very root level it’s exactly the same as the production system there’s always that jerk in the corner going “Yeah, but it’s not production.” And it’s like “Okay, you have a point but you don’t know what goes on.” And the point is I think almost like a – I’m going to do my idiot thing and pull in a mathematical and then probably get it wrong, a mathematical concept of the limit. You remember limits? And the idea is we need to be able to express are we talking about the very ends of things? No, it’s a continuum.

    So, there’s a lot of companies that I work with that actually do have requirements, that they go through a particular amount of testing and particular things before they can transition this to production. They don’t have the luxury of treating production like a dev system. There is a ton of people in the world, and it’s not their dysfunction – that’s not a dysfunction, just because the unicorns can fart rainbows and sneeze glitter and launch whatever they want. I see that happening in Boston all the time in some of the startups, and they do actually put themselves at risk. And even when you don’t do that, when you have an extreme amount of maturity and you’re working with relatively complicated technologies like Kafka things can go wrong pretty quickly. And the question is do you have the people and the process and the technology and the knowledge and the experience and the expertise to handle those when those things do come up in real time?

    How do you get there? How do you get to people who know how to use your monitoring and observability tools really effectively? How do you know what those systems, how close to your perceived architecture versus your actual in production, how do you know how much delta there is there? How often do you exercise the process of disaster recovery is one of those other classic questions you might ask yourself.

    And it gets back to who would be involved when there is a firefight or a last-minute thing like what we’ve done with some of the companies that I worked with very closely through the NeoLoad side of things, is when the education system, when colleges shut down and they finally said, “We are shutting our doors to the people that are paying us money,” that was a scary and real and significant flag for the rest of our US education system to go “Holy crap. We’re going – we have to provide virtual not as a stopgap for the past few months but this is going to be a serious reality for us for the next year.”

    And so, a lot of the vendors that help the education system have the right platforms in place. They go “Holy crap. We really need to test for 10X the size that we’ve ever tested before.” So, they’re testing in production on nights and weekends in various different places and doing it at a smaller pace. But who do they have on the call? Not just the Ghostbusters, but the devs, the ops. There’s people from infrastructure, the DBA teams. They have 20-plus people white-knuckled on the call, like [makes quivering sound] – white-knuckled on the call, and that’s a lot of money. And by the way, you’re asking them to do from 10:00 PM to 2:00 AM to 3:00 AM work. And so, they’re not going to be available for all those fancy meetings, architecture meetings that they should be stakeholders at.

    So, when you get to the point where you’re doing those massive things sometimes it’s necessary to go massive. But the vast majority of the exercises, you go to the gym – not so much me, but you go to the gym to exercise. You go and you get on your bike and that’s an exercise. You don’t expect to run a race without exercising first, without knowing that path a little bit before you just run a 5K race. So, why would you expect to do that with your systems and your teams?

    And that’s where some of the testing, the lower order performance testing comes into play. It’s systematizing the stuff, making a process that can be executed and re-executed no matter which environment it’s pointing to. And the telemetry that you’re getting out of it aligns in each of those environments. If all of a sudden we have really great telemetry in a pre-prod environment but we don’t have it in prod that would be a big problem. Why was it put in here and it’s not represented in production? What if we need that? Or vice-versa: We’re only doing things in production, and so now there’s only – there’s stuff that’s only in production that has no representation of how it would show up in lower environments.

    So, keeping those things in synchronous but also keeping the process and the exercised skills in place is why this isn’t just a big environment at the end kind of a situation.

    Shimel: Again, I think “Thank you, DevOps” where we have been able to say, okay, not only do we need those or can we use those testing dev environments, but as Christine said, with things like feature flags and some of the other technologies, processes that we use, it is possible to continue that – the feedback loops and iterations in real time while using the – while in production. And that again is one of the things that allows us to continually update, continually iterate, continually – and feedback loops was kind of an original concept as part of this DevOps thing. We’re going to have those feedback loops and we’re going to iterate and reiterate.

    But where we’ve gone with observability with that and with performance testing and these things with that have really just opened the floodgates in how we do these things now. I mean, just think about how – when I first started devopsy.kinsta.cloud eight years ago, I mean, there were the unicorns who were updating multiple times a day. But for many people in the world, for many organizations in the world, look, moving from once a year to twice a year, twice a year to quarterly, quarterly to monthly was huge. It was huge. It’s not so huge anymore. It’s common for people to be updating their code daily or more than once a day now.

    I saw – I did an interview this week, a recent survey of developers who they claim that they have sped up their deployments by over 100 percent in the last year and a half. That was – something like 70 percent of developers said that. Think about it. I mean, that’s – a billion here, a billion there, you’re talking real money. Seventy percent of developers say they’re going 100 percent faster. Wow. Wow. What a golden great time to be living. And it’s because of things like observability, DevOps, our better performance testing. Anyway.

    Guys, we’re coming up on our time limit here. I wanted to kind of – let’s wrap it up. Let’s – what advice – for our folks listening in, watching in here, what can we give them? What can we tell them about this nexus of observability and performance that will make their life better? Paul, I’m going to – if you don’t mind, I’m going to put you on the hot seat and ask you to go first.

    Bruce: Sure. Well, there’s a couple things I’ve been working on for a while and then there’s a couple things that I just want to give a shout out to. I’ll start with – Christine doesn’t get to do the pitch thing but I do. Honeycomb is awesome. You see that thing in play and it’s awesome because the team behind it is awesome. You know what I mean? It’s kind of the Conway’s law situation where – the version of it I hear most is the systems are a result of the teams that build them. So, definitely check that out.

    Same thing with some of the other tools around there. But don’t get too bought up into the whole observability – don’t just Google “observability” and look at the first one because most people are paying through the nose for SEO placement there. Really actually look at what’s available, and then also dig into the team, the blog, the spirit behind that thing.

    The second thing I’d suggest is we just released – I was one of the members of a working group for a standard on DevOps principles and practices that applies to highly regulated industries. It’s IEEE 2675-2021, which we’re hoping to get adopted in ISO so it’s global as well. And what it does is really align what is – how are each of the important processes that can be applied continuously through many different life cycles as they’re going along? You know, that DevOps eternity symbol means we’re all going to be stuck in hell forever, that thing is happening, all the things are happening all the time but there are precise things that need to go on in highly regulated industries, and even not. So, we’ve been working on that for four years. And you can reach out to me on LinkedIn, on Twitter – although LinkedIn is probably a better way to go – if you want to know more about that.

    But essentially it’s a body of work that a lot of people have been putting time and effort into to really say, “Hey, look, this is not about what DevOps is. This is about how to do this in these complicated situations.” And you know me; as a performance geek I tried to – I was involved in QM/QA, verification, validation, risk management process, those kind of things. And I tried to make sure that evidence-based decisions, that – which is a hook to basically say visibility, telemetry, the proper SLOs in place, those are definitely in the standard along with other things.

    So, definitely check those two things out: Honeycomb and the IEEE 2675.

    Shimel: Excellent, Paul. Christine.

    Yen: Thank you for that plug, Paul. The one piece of advice I’d like folks to internalize, we’ve talked quite a bit about – or, I’ve talked a bit about developers in production and developers in observability. An asterisk there is that that is not – the practice – the muscles and the practices should transfer well but there are a lot of things in the DevOps world in production that are, well, in some cases outright hostile to developers and in many cases just kind of scary and unfamiliar. And so, if this is something that’s interesting to you, if you’re like “Ah, yes, I would also like to bring development and production closer together,” take a step back and look for things like that. Do your production tools primarily talk about AWS instances and CPU and memory use? Those may be things that might scare your developers off. How can you make the vocabulary that your production tools talk about more familiar to developers? How can you help them bring the concepts and nouns that they’re used to in testing – customer ID or endpoint or logic, something that feels more familiar to the developer world, how can you have that exist in your production tooling as well so that developers can show up and be like “Oh – oh, this isn’t so different”?

    I think that there’s a lot of things that are encoded in certain practices because we assume that a certain persona is the one using them. And those walls are blurring – or those walls are coming down; those edges are blurring. There’s a little bit of work left to do to facilitate it.

    Shimel: Absolutely. Hey, Mitchell, you want to bring it home?

    Ashley: Yeah, I’m going to wrap it up this way because there’s some great practical advice – and by the way, both companies have fantastic products, so please check them out. I think we have this mental model, this habit of thinking of things in one state. Matter has four states – well, five states if you count Higgs boson – Bose higgson. It’s not just solid. It is also fluid. I mean, think of our systems. Don’t think of it as software tools, all the layers of it. Combined together they operate more like a fluid, in a state that’s changing, constantly moving. Things are happening. And that causes you to rethink developers and production, doing production – doing performance testing in a production environment. And the flow of software through that DevOps tool chain is really part of that – the fluidity of that state.

    So, I think we like to think things – of things like “Let’s make everything a solid so it doesn’t change, so we can look at it, observe it, do something with it.” It’s not really that way. That’s not the world we live in today. But if you think about it as something that’s under constant change like a fluid, then I think we have a much better chance of figuring out better ways, whether it’s through technology, new paradigms, new ways of working, of how to make our software the best it can absolutely be.

    Shimel: And at the end of the day that’s what we all strive for. Right?

    All right. What a great way to end this, then. This is a wrap. I think it’s episode 13 of DevOps Unbound. But it’s a wrap on whatever number this was because it’s fluid anyway. It’s a wrap on this episode of DevOps Unbound. Many thanks to Tricentis for sponsoring us on DevOps Unbound. We will be back in two weeks with another great episode. Stay tuned. We also have a big roundtable coming up this month; check that out.

    Paul, hey man, congratulations on joining the Tricentis team as part of the acquisition there.

    Bruce: Thank you.

    Shimel: Christine, they’ve all said great things about Honeycomb, but well deserved. Say hello to Charity for us as well.

    Yen: I will. Thank you.

    Shimel: Keep doing what you’re doing. I hope to see you all soon or a couple months from now in person. Maybe we will do a live DevOps Unbound at some time somewhere. But until then, this is Alan Shimel for MediaOps. You’ve just watched DevOps Unbound.

    [End of Audio]

  • How to Build an Options-Based Observability Strategy

    How to Build an Options-Based Observability Strategy

    The global pandemic forced companies to accelerate their digital transformations, pushing them toward new technologies and architectures as they struggled to adapt to a changing world. Companies wanted fast development and deployment and were happy to trade off efficiency, reliability and sometimes, security, to pursue their goals. Now that the pandemic is receding in many parts of the world, the priorities are rebalancing as companies grapple with choices they made under fire.

    Observability has emerged as a way for enterprises to better understand sprawling infrastructure and application environments. According to Gartner, “Observability enables organizations to reduce the time it takes to identify the root cause of performance-impacting problems. In particular, and in contrast to traditional monitoring, operators can freely interrogate data post-hoc without the need to pre-program dashboards.”

    This sounds promising and the market responded quickly, but predictably. Large and monolithic monitoring platforms embraced the term and added new features, making them even larger and more monolithic. These monolithic platforms represent a failed choice-based strategy. They assume that all observability data is collected, centralized, integrated and only analyzed by a single tool. Enterprises following a choice-based observability strategy find themselves locked-in to multi-year investments without the flexibility to react to evolving technologies.

    While this has been good for vendors in the incumbent monitoring space, end users haven’t benefited from these enormous platform deployments because the choice-based strategy is built on the faulty assumption that a single pane of glass serves all of your monitoring and observability audiences, from SREs to DevOps and SecOps.

    A choice-based strategy also forces customers into limited options in the future as technology continues to evolve and requirements change. Defaulting to choice-based strategies also leaves little leverage for contract negotiations, data integrations and data access.

    Infrastructure and operations teams need to take a different approach to their observability strategy. Instead of focusing on buying products and making choices, teams need to shift their thinking to creating options. The choices you make today limit your options tomorrow. Tomorrow is unpredictable and uncertain. Taking an options-based approach allows you to be flexible and adaptable today and into the future.

    An options-based observability strategy is built on three pillars:

    • Establishing your observability strategy principles
    • Building composable environments
    • Staging your commitments

    Let’s look at each of these.

    Establish the Principles of Your Observability Strategy

    When asked about their observability strategy, many often leap into detailed plans covering every imaginable use case. They talk about the current state of their infrastructure and how things will be at the end of three or five years, including the skills and functions they’ll need in that time. If you’ve read the above, you’ll recognize this as a choice-based strategy: All the choices they need to make over the next several years are already laid out. This leaves little room for adaptation and options as the world evolves around you.

    Instead, think of your observability strategy as a single principle, or a collection of principles, guiding your observability strategy. Let’s say your core principle is that observability is a key enabler of operational efficiency across SREs and DevOps. We can build on that operational efficiency principle to define what key elements of our strategy has to include:

    • Data sources have utility-like accessibility; always on and available across tools.
    • Metrics are primarily driven by total cost of ownership and optimization.
    • Governance is centralized to the team distributing data to downstream systems.

    These elements are different if your core principle is something like customer intimacy or risk management.

    With principles and strategy in hand, we can focus on the next phase: Composing the observability environment.

    Compose your observability environment

    In an options-based strategy, the key success factor is avoiding large ecosystems that limit flexibility. Many vendors take a “give us everything” approach to observability. These approaches appear to start and end at the destination platform, but they begin even earlier, at data origination. It’s common to see agents only sending data to one destination, limiting the usefulness of the data by locking it into a silo.

    Staying modular means selecting tooling that abstracts the data sources from destinations and puts the power back into your hands. By using an abstraction like an observability pipeline, you can send data from one source to multiple destinations, while managing that data in any way you see fit. For example, this is where your centralized governance can occur.

    When new tools are introduced, upgraded or deprecated, an observability pipeline insulates the rest of your environment and users from those changes. A modular approach also gives you more power in contract negotiations with your other vendors because you’re less reliant on one vendor for all of your observability needs.

    Stage Your Commitments

    A choice-based observability strategy is a large commitment, often taking years. Once you start, stopping becomes impossible. That’s simply unacceptable in today’s environment of uncertainty. Choice-based strategies limit your ability to test, experiment, and learn. At the same time, our infrastructure is critical and it must be reliable.

    An options-preserving approach may involve experimenting with freemium products; only paying once the product’s value has been proven. Cloud-based options are another consideration since they are commonly subscription-based and offer easy try-before-you-buy purchasing styles. Even better, cloud-based options don’t require using your own infrastructure to test new options.

    Every IT team feels the need to react and respond to demands from the business. That urgency to make choices, to solve the immediate problem, can have long-term implications for future flexibility and agility. By structuring your observability strategy around a long-term vision based on preserving options, your team can remain adaptable as technologies and business requirements evolve.

  • Logz.io Allies with Microsoft on Open Source Observability

    Logz.io Allies with Microsoft on Open Source Observability

    Logz.io this week announced an alliance with Microsoft that enables DevOps teams to deploy its observability platform—based on open source platforms such as ElasticSearch, Logstash, Kibana (ELK), Prometheus and Jaeger—on the Azure public cloud.

    Jonah Kowall, Logz.io’s CTO, said the multi-year effort enables those teams to deploy the Logz.io platform via the Azure Console with the click of a button. The Azure platform has a data collection capability that aggregates operating system events in a way that makes it simpler for the Prometheus monitoring solution to consume, he added.

    DevOps teams, however, will still have to collect data from the applications they instrument on the Azure platform, he added.

    Logz.io integrates multiple open source monitoring tools based on metrics, logs and traces within a single observability platform that otherwise would require considerable time and effort from internal IT teams on their own.

    Interest in observability is rising as organizations attempt to provide internal IT teams with more context when troubleshooting issues. Whenever there is an IT issue, most teams convene a “war room” where they attempt to discover the root cause of an issue by comparing analytics generated by a wide range of monitoring tools. Observability platforms promise to enable a DevOps team to replace many of those tools in a way that provides more context by integrating log data, metrics and distributed traces within a single platform.

    In many instances, existing application performance management (APM) platforms are being transformed into observability platforms by adding tools to monitor IT infrastructure. Conversely, platforms for managing IT infrastructure are adding support for tools to monitor applications. Elsewhere, a range of startups have emerged to offer observability platforms they have developed from the ground up.

    Regardless of the platform employed, the rise of microservices-based applications within many organizations is forcing the observability issue. The dependencies that exist within microservices-based applications are too complex to manage without a platform that provides some level of increased observability. Of course, most existing monolithic applications are not being retired any time soon, so the need for an observability framework for both legacy and modern cloud-native applications has only become more pressing.

    The Logz.io platform can, of course, be deployed on other cloud platforms as well as within on-premises IT environments. As hybrid cloud computing continues to evolve, it is apparent that observability platforms will need to extend their reach from the cloud to the network edge. Over time, artificial intelligence (AI) capabilities will be added to make it easier to, for example, streamline the number of alerts that are generated across complex IT environments.

    In the meantime, the most important thing with regard to observability may be simply getting started. Most IT teams start to analyze logs before moving on to metrics and then traces using the open source Jaeger agent software. After all, the only thing more difficult to instrument than an application before it is deployed is, arguably, one that is already running in a production environment.

  • EP 10: Observability & Continuous Improvement

    EP 10: Observability & Continuous Improvement

    Observability at enterprise scale brings with it additional application life cycle management requirements. Success requires knowing which changes result in improvements and which don’t produce positive results and how that information must make it back to the DevOps team through feedback loops. In this episode of DevOps Unbound, Alan Shimel and Mitch Ashley talk with Kurt Chase, senior director, global release management at Tricentis, Charity Majors, co-founder at Honeycomb and Ravyn Manuel, senior application manager at the Smithsonian as they discuss observability and continuous improvement. The video is below, followed by a transcript of the conversation.

    Alan Shimel: Hey, everyone. I’m Alan Shimel and welcome to another DevOps Unbound. We have a great panel in store for you today here on DevOps Unbound. Our topic is observability at a broad level. We’re going to jump into some of this. Let me first of all introduce you, though.

    First I want to introduce you, of course, to my cohost of DevOps Unbound. He’s the CEO of Accelerated Strategies Group, CTO here at MediaOps, my friend Mitchell Ashley. Hey, Mitch. Welcome.

    Mitch Ashley: Alan, thanks. Great to be here.

    Shimel: All righty. Let me introduce you to our panel for today. We have a great panel. I was so happy that this came together. First, coming at us from the mountains of Virginia by way of the Bronx, Ravyn Manuel. Ravyn, why don’t you introduce yourself and where you work?

    Ravyn Manuel: Absolutely. My name is Ravyn Manuel and I work for the National Museum of African American History and Culture, which is part of the Smithsonian. I am the Senior Applications Developer and DevOps Engineer. And thanks for not putting me in West Virginia. I appreciate that.

    [Laughter]

    Shimel: Okay. I don’t blame you. Next up we have the one and only Charity Majors, CTO and Co-founder at Honeycomb. Charity, a little bit about yourself, maybe introduce to the audience?

    Charity Majors: I am an ops nerd. I have been on call since I was 17 racking hardware. I no longer rack hardware anymore. Hardware doesn’t exist, as far as I’m concerned. Instead, I’m trying to save the world through better observability.

    Shimel: Excellent. And then, last but not least, we have Kurt Chase of Tricentis, Tricentis Releasing. Kurt, why don’t you introduce yourself?

    Kurt Chase: Hi, everyone. My name is Kurt Chase. I’m currently Head of Global Release Management at Tricentis, based in Northern California. Nice to join you all today.

    Shimel: Nice to have you here, Kurt. All right. So, team, panel, our topic this week is observability. And given that is the topic, I feel compelled to start with Charity because, Charity, in many ways you and the Honeycomb team are responsible for all this buzz around observability. Tell us about it.

    Majors: Yeah, a little bit. When we started the company a little over five years ago it was not a term that was really in use – used in tech. Now – which is not to say that we invented it. Far from it. But it has this long and impressive pedigree in mechanical engineering, specifically control theory. And in control theory observability is the mathematical tool of controllability.

    So, we started building this startup, Honeycomb, and we knew that what we were doing wasn’t monitoring. We knew that we weren’t reactively monitoring. We knew that we were – it was about instrumenting the code, getting at it from the inside. But for the first five, six months we couldn’t figure out what to call it. It was really hard to figure out how to talk about what we were doing. And then it was mid-July, midway through the first year when I remember Googling “What is the definition of observability?” And when I read it it’s all about “Can you understand what’s happening on the inside of the system just by looking at it from the outside with no prior knowledge?”

    And a lightbulb just started going off. It was like “Ding, ding, ding. That’s what we’re trying to build. That’s exactly –” if you translate that into software terms, what it means is can you explain any system state that – any state that your system can get into without shipping new code to handle that state because shipping that code to handle that state implies that you had prior knowledge. So, it’s all about the unknown unknowns instead of the known unknowns. So, yeah, that’s my story.

    Shimel: And you’re sticking with it. So –

    Majors: Yeah. I mean, it really encapsulates a lot of the problems that people are increasingly having, that there’s a lot that precedes from that definition of “unknown unknowns,” like you need to have high cardinality, high dimensionality, blah, blah, blah, all this stuff. But those are the things that speak to the problems of microservices and multiple storage systems, et cetera.

    Shimel: I get it. So, Ravyn, this is your life. How does this observability and what Charity has describe, the fact pattern or the problem pattern that she came to call observability, how does that in your life, day to day of what you’re doing, how does that kind of manifest itself?

    Manuel: Thanks, Charity, for actually providing a definition because I was like “Okay, are we supposed to define our own meaning of observability?” So, you’ve given a baseline. And I like that you said it’s not monitoring because I can actually feel the nuance. There’s a nuance between monitoring and observability. And it’s – what’s really interesting is that that’s a problem that I’m trying to solve today at work because we’ve got – and – because we’ve got the black boxes. So, you’ve got observability but when you have software there’s a lot of black boxes. You’re not supposed to be asking what’s going on inside the code because you’re not supposed to know what’s going on inside the code. But when you get a – you put a signal in – I was in the military, so I did electronic repair – so, you put the signal in and you don’t get the right signal out but you’ve got a black box. How do you know what went wrong there if you can’t actually observe what’s going on inside of there?

    It’s one thing to know the state of the software when you are the developer. So, as a developer, yes, I know. But when it comes to being the product owner or the project manager or a stakeholder and you’re trying to figure out what – “Why is this doing this?” or “This is not what I wanted,” actually is how that would come from that end, is “That’s not what I wanted.” So, how to get the stakeholders to get what they want when you can’t actually tell – I can’t tell what the code from my coworker is doing? So, in a way observability is a little bit – it is abstracted from monitoring because monitoring is telling you what it’s doing but it isn’t telling you the state. And so, it’s a problem that I’m trying to solve actually today.

    Chase: I was going to jump in here and say from my experience although monitoring, logging, reporting, alerting, they’re not observability, I think they are fundamental foundational pieces that you have to have in place. You can start observability without any of them, but I’ve found that the more you can get your monitoring and reporting and even get some alerting going, it allows you to then start observing the system. And for me, I know at Splunk and now here again at Tricentis I’m really trying to connect all the pieces because it’s not just about the applications, but I find that some of the DevOps engineers, they really help with observability, especially the ones that are super inquisitive, and they don’t just – when a result appears or something happens they don’t just take it at face value. They’re inquisitive. They dig in. They try and find the root cause.

    And I think that’s key with observability, is taking all the monitoring, reporting, alerting you have, taking the feedback from your customers, all of that comes together, I think, to really help you start to define those unknown unknowns that Charity brought up. I think it becomes very complicated. And then I think I’d love to talk about how AI and machine learning now can start to learn some of these things, because I think we get really good at repeatable incidences, observing those and then accounting for those in our systems, but it’s the unknown unknowns, how do we deal with those? That’s the real interesting part to me nowadays for sure.

    Majors: It is, I think, the interesting part. And I also think that AI ops is mostly bullshit and it will be for the foreseeable future.

    Chase: For a while. I agree, yeah.

    Majors: But I wanted to circle back to what you said about logging and everything, which is – so, there’s a technical definition for observability which has to do with high cardinality, all this stuff, and then there is just understanding your systems. And I absolutely agree: You need some alerting, you need some monitoring. I think there’s a question is – of – it log files? Is it metrics? That’s kind of irrelevant for just data. What’s important is can you understand what’s happening in your system when you need to understand it?

    And I do think it’s important to sort of differentiate the technical definition of observability from just the tendency that we have to, say, observing things because there’s a very rich and mature and well-established set of best practices for monitoring, which are in many cases completely mirror opposite from the best practices for observability.

    For example, with monitoring it’s like for years we’ve been saying, “You should not have to stare at graphs all day. The system should inform you when you need to – when there’s something wrong.” Super canonical best practice. With observability it’s exactly the opposite. It’s – we’re saying that most problems that happen are so subtle that you need to be looking for them. You don’t – you can’t page everyone at the threshold – you would drive them nuts if you were like “Oh, every little thing is going wrong. Bing, bing, bing.” You’re just – you would drive people nuts and they would quit. But when you’re an engineer, when you’re working on this endpoint or when you’re trying to solve this problem you should absolutely be looking through, asking questions, iterating on them, and looking for the trails in your observability tool at that very fine grain level.

    Chase: I agree.

    Shimel: So, I hear what all three of you said and it’s funny how everyone brings their own baggage to this issue.

    Majors: Oh, sorry.

    Shimel: No, no, it’s not – don’t be sorry. I love it. Here’s, I think, fundamentally – for those people out here who are watching this whole – I’ve got a lot of people out here who are DevOps people, who are ops folks, SREs, cyber folks, and their heads are spinning because I think there’s a little bit of what Kurt said to them, which is they don’t do – they do a shitty job monitoring, quite frankly. We don’t do a great job of it. People started throwing this AI ops word around, and there are a lot of companies raising a –

    Majors: Yeah, there are.

    Shimel: – crap ton of money around their AI ops stuff. And I never really understood what was real about it and many times it just sounded like another word for monitoring to me. But whatever. There is no AI in it.

    But – and now, look, over the last year, year and a half, two years we’ve seen observability come up here and they don’t get the difference. Ravyn, I think you do because quite frankly your black box analogy with electronic in the military, that is – you’ve got to figure out what the unknowns are from the unknowns. It’s not just getting all these signals that are known and then recognizing patterns and putting some automation behind it. That’s not observability. I’m sorry. Not in my mind, anyway.

    So, I think number one is we need to clearly define it. And Charity, you guys, you are a major kind of evangelist for this: “What is observability versus AI ops versus ALM,” which is before AI ops, and so forth. And there are SREs who are living this and DevOps teams who are living this every single day out here who haven’t got their heads around it. Ravyn, I always look to you as someone who gets it. Where do you fit on the – where do you kind of see it on the – let’s say there’s a scale of ALM, AI ops, blah, blah, blah, observability. What do you think?

    Manuel: I feel like I would be very – most close to observability because, again, all – anything with ops in it, when you start doing DevSecOps and DevOps, all of those ops just become marketing terms after a while. But observability is – because it’s not quite tangible it’s actually more real, because it’s real – because it speaks to exactly what’s coming, what’s going on when you’re trying to get continuous improvement, because you need metrics to show and prove that you’re doing continuous improvement. But how do you get there? What is it – what are the steps to get you there? How are you alerted that you are not improving or that you are going backwards?

    And so, when – I feel for me as far as observability I’m at the cusp, because I didn’t actually know that the word existed until I found out about the talk. I didn’t know that that had been defined. So, it’s really cool to know that I can now call it observability. It’s because it’s that thing that I can’t – there isn’t a tool to actually help me – actually help me know what it is that I’m looking at all the time. Not all the time. There are some tools that help me some of the time but not all the time. And it’s the times that I don’t know that’s when we are stuck, because it could be impacting the way – the system performance or the team’s performance.

    Shimel: Charity, I think you might have a customer there. It sounds like they need a tool.

    Majors: I feel like one of the key differentiators here between observability and AI ops and stuff is what it tries to center. With observability we are not – AI ops are like “Eh, we’ll tell you what to look at. You don’t need to understand your system. We’ll understand your system for you. We’ll tell you what to look at. We’ll tell you what it means. We’ll tell you what’s important.” With observability it’s the opposite. I think that we need to look to solutions that let computers do what computers are good at and let humans do what humans are good at. Computers are good at crunching lots of numbers but they can attach meaning to something. Only human beings can attach meaning to something. If I see a big old spike of red that could be good, that could be bad. You don’t know. There is no meaning until a human has attached them to it.

    And with AI ops, AI ops only really works if the corpus of data that you’re training it on doesn’t change. So, if you’re actually shipping software every day you’re fucking up your corpus. This – it’s kind of incompatible with modern software development. I have many thoughts and feelings on AI ops. God bless them, but mostly I think that what they’re trying to do is take the humans out of the driver’s seat. And I understand why, because the C-level, CTOs, CIOs, whatever – there’s something that kind of blew my mind when I realized it a couple years ago: They trust vendors over their own people. Their employees come and go; vendors are forever. So, whenever a vendor comes along it’s like you give them tens of millions of dollars; your people don’t have to hold all of the wisdom in their heads. You can replace them. They’re fungible. The tool will tell you; the tool will be the source of truth.

    And I just fundamentally reject – I’ve never seen that work well. I think it’s a shitty way to treat your people. And I would prefer to take the –

    Chase: And I would not agree with that statement, quite honestly. I’ve had leads that are –

    [Crosstalk]

    Shimel: All right. “Mr. Vice President, I’m talking.”

    [Laughter]

    Sorry.

    [Crosstalk]

    Majors: – and then using our tools to make them better, to impress them, to give them a better sense of where they sit in time and space in the history and what’s happened before and what they’re – they should be wearing grooves in the system as they wear – as they use it in the [inaudible].

    So, I think that it should – if you’re centering a person it’s observability and if you’re centering the – it’s AI ops. Sorry. Go ahead, Kurt.

    Shimel: It’s okay. Kurt, your turn.

    Chase: No, I was just – in my experience the leads, I’ve had – I’m a senior level director now; it was the same at Splunk – I did not encounter that where my leads trusted vendors more than myself or the people on my team. I was surprised to hear that, quite honestly, Charity. I have not experienced that.

    [Crosstalk]

    Majors: It’s not universal. But it’s – there – it exists quite a lot.

    Chase: Yeah, that’s too bad to hear that. That is seriously wrong and that’s going to go against everything we need to accomplish internally.

    Majors: Yeah.

    Chase: Yeah, if –

    Ashley: Have fun attracting great people with that mental model.

    Chase: Yeah, yeah, yeah. And the other thing – I’d love to hear your opinion on this, Charity – we have very complicated systems we’re running. The source code management, the build systems, the agents. I’ve found that it always is very helpful to distill it down into discrete parts, try not to blow the ocean at once. Let’s start with the source code management system. How are we observing that? What are we doing here? And would you suggest that’s a great way for people to get going? I mean, when you try and look at everything – you have to look at everything for sure, but to get started it seems like find some of the most important pieces. Source code management is a great one. The crown jewels. What’s your suggestion there for getting started and –?

    Majors: Source code management is important but it’s never – it’s almost – it shouldn’t almost ever be in the critical production path. And when people are rolling something out I always advise them to find something that’s – don’t waste your time instrumenting _____ observability, lights, and backwater to the system. Find the thing that you’re trying to understand and fix now. Find the thing that’s broken. Find the thing that’s causing you pain. Because it should be an order of magnitude better at answering your question, observability should, even than monitoring. I don’t think you can look someone in the eye and ask them to switch up what they’re doing and to use something else unless you can tell them it’s going to be an order of magnitude better than what they’ve got now because the costs of transition are so high.

    But with observability you should be able to go from instead of just the aggregate where it’s like “Well, I see a spike but I can’t tell you what it means or how they’re different from –” with observability you should be able to go exactly those rows, in which ways are those events different from all the baseline events, and very quickly go “Oh, I have a much richer view of my system now.” And if – once you’ve got that you should be able to explain way more about what’s going – so, we see this all the time when people are running out – when they’re rolling out Honeycomb. They start rolling – they roll it out to the service and they’re like “Oh, God, there are problems there. Did you know that this is broken? Oh, there –” and we’re like “Yeah, yeah, yeah, but you’re just picking up the rug. It’s been there – it’s been that way for as long as you know.” And they’ll pick up another service and the problems – I’m like “Yeah, but these problems have existed – you just had no idea because we were dealing with [inaudible].”

    So, I feel like the way to pick up momentum, the way to incentivize people to get excited about this is to look for the biggest pain point in your system and –

    Chase: That’s awesome.

    Majors: – then patch that with observability.

    Chase: That’s great advice. I agree.

    Manuel: Charity, a question. Does – can observability actually take in account process? Because you’re talking about if there’s something wrong in the system itself, but sometimes the thing that’s wrong with the system is the process.

    [Crosstalk]

    Majors: Well, everybody is not about process. And you’re totally right. That’s often – that is not something that you should ever ignore. A lot of the biggest problems are process problems. But observability is not the tool for that.

    Shimel: And that’s good to know too because quite frankly – and Mitchell knows this too – we live in a silver bullet world where people think the latest shiny trinket is the cure-all.

    [Crosstalk]

    Majors: – everything, you should –

    [Crosstalk]

    Shimel: No, observability, yeah, it’s not going to cure Covid either.

    Majors: No.

    Shimel: But –

    Chase: And that was the point I was trying to make initially. I think I said it wrong. It’s not that monitoring and reporting, logging aren’t foundational; they’re complementary. You kind of need them all. If you’re running modern stacks – I said that incorrectly at the start – it’s not foundational. There’s – you need them alongside each other.

    Shimel: They’re adjacent. They’re not –

    Chase: Yeah, absolutely. Absolutely.

    Shimel: They’re not – it’s not a pyramid per se.

    Chase: Right. Exactly.

    Shimel: I think it’s part of your stack horizontally.

    Chase: Yes. Yes. And I’ve found –

    Shimel: Can I – we haven’t’ – go ahead, Kurt, I’m sorry.

    Chase: I was going to say I’ve found with especially new individuals and new people to the DevOps team and the DevOps world, getting them involved in the monitoring and saying, “Hey, this is how we start monitoring,” that’s a great place to start. It’s almost entry level for observability, if you – I’d love your opinion on that, Charity, too.

    Majors: Well, I really think that everyone who writes and ships software should be on call for their code, no matter how –

    [Laughter]

    Chase: Yeah, me too.

    [Crosstalk]

    Majors: Software ownership. And so, yes, that’s very empowering, I think, to show them how to find the trail, the alert that’s paging them, trace it all the way to the system and fix it. That’s something that as engineers, we feed on that. That’s exciting to get to know how to run your ship better. Yes, absolutely.

    Shimel: Well, but – so, you know what? Mitchell and I started a company – or, were two cofounders of a company called StillSecure 20 years ago. And that was one of the things. Mitchell ran the engineering team and that was one of the things he instituted, I remember, was that every developer had to take a turn on the help support desk, level one, answer the phone. “Hello, Mr. Customer.”

    Majors: It builds empathy.

    Shimel: And try to explain it because they had to answer the alert. And even when they weren’t on that level one our escalation procedure was if it went to level two or three it was the developer who did the level two and three support.

    Majors: I will say that, yes, and I do think that every engineer should be on call for their work, but you have to couple that with it’s management’s job to make sure that that doesn’t suck, that it isn’t _____ for them, but it doesn’t just kill you with [inaudible]. It is management’s absolute fucking responsibility to make sure that they’re given the time to – away from project work to fix these problems so that they don’t recur, so that they get enough sleep. I think it’s reasonable to ask any engineer to be woken up two or three times a year for their code. That’s it. Because more than that, you’re burning people out hardcore.

    Manuel: Been there, done that.

    Shimel: You know, Charity, Ravyn –

    [Crosstalk]

    M : I have a question. I have a question I’d love to ask all of you. I’m thinking about observability has been elevated because of, in part, the world that we’re living in. Software architecture is changing. We’re dealing with microservices, all these much smaller things that are interconnected to make software. And at the same time as we’re changing the pace at which we release software, not only is it unknown unknowns, it’s like a river – Riven –

    Shimel: Ravyn.

    Ashley: – we’re in the river of the changing software. So, you’re trying to understand all of these things at the same time. It seems like it’s the right time for observability to be the thing to be working on because ops has to be elevated to the same level of the same kind of architecture and processes that we’re using across the – in the life cycle of software. Do you agree with that or not? It seems to me we’re in the right place, right time.

    Majors: Absolutely. I mean, I feel like the first wave of DevOps transformation was all about “Ops people, learn to write code.” And we’re all like “Eh, okay.” But I feel like the pendulum has swung. I think now it’s about “Okay, software engineers, your turn.”

    Ashley: You’ve got to do ops.

    Majors: I have to learn to write operable services and to learn to maintain them and get called for them and – because what microservices has done, all of that complexity and logic has to be bundled up in the app. The app.

    Manuel: Exactly.

    Majors: And now it’s like we’ve been thrown to the four directions of the map. And what that means is that so much of understanding and operating your application has been pushed into the realm of operations and systems. It used to be that if all else failed you could attach a debugger to your app and just step through, see what was happening. Well, you can’t do that anymore now because the process died and jumped to another service, and another service. And part – the way that we instrument for observability is all about packing up the context of the application and shipping it along with it from hot to hot, one event per request per service, so that you can slice and dice and reason about your systems in a way that you used to be able to.

    Ashley: Doing that really changes the design. I’m thinking about Alan’s story of what I did back at StillSecure. What prompted that was when a customer called in and said, “I’m sitting in – we’re using your project and this dialogue box popped up and it says ‘An unknown error occurred’ and that’s all it says. What do I do?” Well, nobody knows what to do with that. So, we all just said, “Look, everybody does support in that case. Everybody does ops.” And that changed: “Okay, we have to figure this out.” And suddenly that was the problem of “How do we make this easier to support and easier to resolve issues with?” So, it does affect behavior and design or product.

    Majors: Yeah, absolutely.

    Manuel: I think microservices is – will actually do good for observability because if you do microservices correctly then each service is atomic. It does one thing and one thing only. It does that thing good. So, if the unknown is not taken out of it because you know exactly what this thing is supposed to do –

    [Crosstalk]

    Majors: Oh, no, honey, the unknown is never taken out of it. The unknown is never –

    [Crosstalk]

    Manuel: In my ideal world it is.

    [Laughter]

    There are no more unknowns –

    Shimel: In Ravyn’s world, yeah.

    Manuel: – in Ravyn’s world. Exactly.

    Shimel: Yeah. But I’m going to tell you something. The flipside to this, though, too with microservices, and I think we’re starting to see this now, is can you have too many microservices running? Does it – is the complexity load in there such that observability almost becomes meaningless or impossible?

    [Crosstalk]

    Majors: I don’t know that complexity can every really be created – no, it typically is not meaningless. It’s your only hope to understand this shit if that’s what you’ve done to yourself. But complexity can only be moved around. It’s just a question of tradeoffs, like which set of tradeoffs – some folks have gone whole hog on microservices and then they’ve found the edges to those design _____. But –

    [Crosstalk]

    Chase: What I find – I was going to say what I find challenging is both at Splunk – Autodesk was interesting. So, to your point, Alan, we used to make engineers buy bagels. You break things; you have to buy bagels. And so, we had a lot of bagels brought in. But both at Splunk and here at Tricentis we have a world where we’re supporting large enterprise applications and delivery of enterprise apps. We’re also – obviously all the microservices – and trying to apply these techniques across the board is very interesting, very challenging.

    [Crosstalk]

    Majors: Oh, yeah. There’s no one-size-fits-all.

    Chase: There’s not. There’s not. And almost to the point you made, Ravyn, observability almost has to be customized for what you’re observing. It’s – I haven’t had a chance to run Honeycomb yet, but for me my experience has been there’s always those little idiosyncrasies about how we run our ops, how we –

    [Crosstalk]

    Majors: There’s no such thing as a perfect _____. No one else can do it for you. It can be – it can get you started. It can give you a boost. But at the end of the day somebody’s got to fucking understand your software and roll that into your instrumentation. Nobody else can do that for you, let alone _____.

    Chase: And that’s where with AI ops, I won’t say it’s complete shit. I think there is some value there. Some of it is just about automating common occurrences. And maybe that’s not valuable but –

    [Crosstalk]

    Majors: – it’s an AI but they’re just using that to make – to raise lots of _____.

    Chase: Oh, sure. Okay. Yeah.

    Manuel: Didn’t work.

    Majors: Like, “Oh, I have an AI too.”

    Shimel: No, but we – and you’re right, AI is a money term. But ML ops is something that’s caught on a bit, more than, I think, than AI ops. And I think that’s really at the heart of it, which was to recognize repeatable patterns or recognize patterns that we can respond to.

    [Crosstalk]

    Majors: Although, I would still challenge – I think in far too many cases people are reaching for the complicated solution instead of fixing it at the start. They’re like “Ooh, I’ve got 50 bazillion e-mails so I – and all of that disk space so I need AI to solve it” instead of turning off the fucking e-mails and setting up a different kind of alert or some automatic _____. Just – is this really a problem we need to solve? Or could we solve it better by just not having it?

    Shimel: There is that.

    Majors: Sorry. That’s my last bitch.

    Shimel: Do we need to solve every – and I think Ravyn – or, not Ravyn – Charity, you were getting at it before. Do we need to solve every problem?

    Majors: Is it the most important problem? Is this going to be the biggest bang for our buck?

    Shimel: Yep. I mean, we used to have a –

    [Crosstalk]

    Majors: – or the _____. Like, senior engineers write software but very senior engineers don’t need software.

    Shimel: Yeah, no, I mean, look, when Mitchell and I were doing the security company we had a product, “Vulnerability Assessment of Management.” VAMP. Internally we called it the Bad News Generator because that’s what it was.

    [Laughter]

    It was the Bad News Generator. And the problem was we would go to an organization like Ravyn’s and it would pop up a few thousand vulnerabilities, and the security or the ops people would be like “What am I going to do?” And “Don’t worry about 95 percent of them. Let’s just worry about the top five percent.” And it was like – it was employment insurance, was what it was, because there would always be more vulnerabilities for us to find next year.

    But that being said, it really was the case where you’re not going to fix everything. We don’t have the time to fix everything even if we wanted to.

    [Crosstalk]

    Majors: And it’s not really doing a great job of giving you differentiation, letting you know what’s really important and what’s just noise. So much of these tools, they just give you so much noise and it’s almost worse than nothing at all.

    Shimel: Well, that’s why with the Bad News Generator people used to – so, Mitchell got the lucky part of designing it. I had to go sell it. That was much harder.

    Ashley: I remember the –

    Shimel: Much harder.

    Ashley: – guy from the federal government called and said, “This thing is spamming everybody in the Defense Department.”

    Shimel: Yes, “We have all these vulnerabilities.”

    Ashley: “How do I turn it off?”

    Shimel: Because we had this automated workflow before we had terms like AI and ML. But it is hard.

    Hey, guys, we’re coming down the home stretch here. We probably only have five minutes or so left. I wanted to – let’s look forward now. I’m big into looking forward these days. I’m hoping we’re going to do conferences in person again; we’re going to – I don’t know if we’ll go back to our offices but…

    What’s next for observability? How does this continue to evolve?

    Majors: What’s next is I think really wrapping traces in as a first, best tool so that – right now too many people are like “I have one tool for metric, one tool for logs, one tool for servability, another tool for –” they’re spending just ____ data again, every time. And it’s worse than that because you can’t actually seamlessly break down a chain of events, so you’re just copy/pasting this idea into that tool or hoping despite – because it seems to line up timewise, it’s actually bees in the logs – you should be paying to store this data once and you should be able to flip back and forth between loads. Are you slicing and dicing? Are you doing aggregations at read time? Are you zooming in? Are you zooming out? Or are you slipping back so you can view it as a logger file by time?

    I think that observability tools like us and Lightstep – which are the only two observability tools out there by my technical definition – although, I will say I do think that this might be the year that that begins to change. I know that so many of the big players have been working as fast as they can for years on the back end. They’re trying to catch up to where we sit technically faster than we can get catch up to where they sit in terms of the business. So…

    Chase: And I –

    [Crosstalk]

    Manuel: I like that you said that. Sorry, Kurt. That –

    Chase: No, no, go ahead, Ravyn.

    Manuel: – Charity – I just wanted to say to Charity –

    Chase: No, no, Ravyn, go ahead.

    Manuel: – about tracing, because that’s actually the solution that I am actually looking for, that I’m looking for –

    [Crosstalk]

    Majors: It’s got a lot of rough edges.

    Manuel: – for organizations. Yes, to be able to follow –

    [Crosstalk]

    Majors: But there are lots of problems we can’t solve any other way.

    Manuel: Exactly. So, I feel good that I’m doing it inherently, like I know what I’m supposed to be doing.

    [Crosstalk]

    Majors: You’re on the right path.

    Manuel: I think I’ve actually found a way to do that. But yeah, tracing I also think is the way to go. That is the only way you’re going to be able to know, because it’s taking you from point A to point B to point C to point D and you’ll be able to see that all. And there will be no unknowns. [Laughs]

    Majors: Oh, honey. You keep saying that.

    [Crosstalk]

    Manuel: It’s my dream. That’s – let me live my little dream.

    [Laughter]

    Shimel: Kurt, what do you got?

    Chase: Yeah, well, where mind – excuse me – where my mind goes to in the future is what are we doing in the education system to really disseminate this information, how monitoring software is developed, how we monitor it. And then also “observability” is such a loaded term because I know at Splunk they would consider observability something much different, for running a SOC and things like that.

    [Crosstalk]

    Majors: Oh, no.

    Chase: So, I think it – I mean, at its core observability is what it is. But how it’s implemented for different disciplines and how they use it, I think companies would definitely take exceptions with some of the things we’ve said here –

    Majors: For sure.

    Chase: – and what observability means to them. And I would just say keep that in mind, that it is a huge field and I think we’re going to see further improvements. I love the tracing. And being able to have that in your tool set would be fantastic.

    Shimel: Charity, final thoughts before we wrap?

    Majors: Oh, I am just enjoying the fact that some people are so interested in this that they’ll show up and argue about it all the time. So…

    [Laughter]

    Shimel: It’s all good. Hey, you know what? It’s a living. Mitchell, as usual, I’m going to give you the last word.

    Ashley: Well, I’ve learned two things today. Don’t call my tool an observability tool or an AI tool unless it really meets the definition, or I’m going to get crucified.

    [Laughter]

    No. No, what – I mean, I love this conversation. I learned a ton. I always do when we have these – what’s so cool to me is that we’re talking about operations and we’re talking about this part of our world and we’re not talking about better ticketing systems. We’re talking about really meaty, interesting things that help us do our jobs better, do a better job for the company, for the customer. That’s exciting to me. It’s just really cool. I enjoy it very much.

    Shimel: Join us for our next show where we’ll be talking about better ticketing systems.

    [Laughter]

    No.

    Chase: And what argument did I miss? I was –

    [Crosstalk]

    Shimel: No, no, no, no. It’s all good. You know what? I enjoy having really bright, smart people who are willing to express their opinions. And when I knew we had this panel, it was the lineup, I knew there was going to be no shortage of opinions, nor any backing down. So –

    Ashley: We’re going to call the next one “The observability mix-up.”

    Shimel: Right.

    Majors: We’re going to have to call it “Observability AI.”

    Chase: I still want to see that sticker –

     Shimel: “AI Observability.” All right. Hey –

    Chase: We need to see the sticker Charity was holding up. We need to see that.

    Majors: Oh.

    Shimel: Oh, we never got to that. Yes.

    Chase: We have to see that.

    Majors: I’ve got a few of those. I’ve got “Release := deploy.”

    Shimel: You’ve got a lot of them here.

    Majors: I’ve got “Ship dangerously.”

    Chase: Yeah, I love that one.

    Majors: “Deploy on Fridays.”

    Shimel: You know what? You used to be able to get these things on conferences. Now we’re reduced to showing them on Zoom.

    Majors: Yeah, you have to.

    Chase: Yeah. Exactly.

    [Crosstalk]

    Majors: “Perhaps this is a good day to deploy.”

    Chase: Maybe.

    Shimel: Okay, yeah. Perhaps.

    Chase: It’s Friday. It’s not a good day.

    Manuel: No, Friday is not a good day.

    Chase: That’s the one, right there.

    Shimel: And there it is: “I deploy from Cron.”

    Ashley: That’s the one to end on right there.

    Shimel: That’s is. We’re going to wrap it. Hey, you’ve watched devopsy.kinsta.cloud. It’s sponsored by Tricentis. Many thanks to them for sponsoring. Just wanted to quickly mention Kurt is from Tricentis. Charity is from Honeycomb, and it’s Honeycomb.io. Go check that out.

    Majors: We have a very generous ____ here.

    Shimel: A very free _____. Ravyn, you can start playing with it now and see if it’s something that gives you tracing and so forth. Mitchell, thanks for joining us.

    Ashley: You bet.

    Shimel: We are back – actually, we are back with a roundtable next, which will be open to the public. Looking forward to having you on for that. But until then, this is Alan Shimel for DevOps Unbound. Have a great day, everyone. We’ll see you soon.

    [End of Audio]

  • Could Full-Stack Observability Help Lessen IT’s Burden?

    Could Full-Stack Observability Help Lessen IT’s Burden?

    The year 2020 was a landmark year for many reasons, other than the obvious. The IT world saw the first time that cloud service revenues dwarfed spending on data centers. Across the board, budgets have been increasing around cloud adoption. And in this ‘new normal,’ digital experiences are slated to remain just as crucial of a touchpoint as ever. In fact, new findings show that for 85% of users, digital applications are absolutely essential to their daily lives.

    Rising digital demands mean reliance on the cloud is here to stay. But if organizations don’t right-size their cloud workloads, expenses could get out of control. Plus, maintaining world-class user experiences requires a keen insight into the overall performance of apps, systems and solutions. If teams aren’t continually monitoring application performance and business KPIs, the bottom line could suffer.

    I recently met with Joe Byrne, AppDynamics Regional CTO, to discover what full-stack observability (FSO) means for today’s cloud-heavy applications. According to Byrne, DevOps and SRE teams should be maintaining a holistic view of the entire pulse of the application—including non-functional metrics (NFM) alongside traditional security and functional monitoring. Doing so could reduce time spent on root cause analysis and help ensure code is continually meeting business objectives.

    What is Full-Stack Observability (FSO)?

    In the classic definition, observability focuses on measuring the internal status of a system based on external outputs. Application performance monitoring (APM) typically tracks telemetry around logs, metrics and dependencies. IBM, for example, calls the observability trend “a natural evolution of APM data collection methods.”

    Full-stack observability (FSO), said Byrne, takes this one step further to track business-related key performance indicators (KPIs) alongside additional, more traditional software metrics. “FSO helps understand that software is performing optimally and that it is meeting business objectives,” said Byrne. In this way, FSO takes a holistic view to determine not only if an application is functionally sound but if it’s meeting its end goals.

    FSO would consider critical performance actions, such as user experience telemetry. For example, Byrne explains, an e-commerce website could find value in tracking performance levels such as login time, check out time and payment initiation. Tracking such metrics is necessary to pinpoint roadblocks and create actionable steps to remediate holes in the user journey, said Byrne. Increased visibility here could also help engineers quickly respond to issues to better optimize the user experience. In addition, aggregating information at a higher level—to view total products sold per day or total revenue per day, for instance—could inform overall progress.

    How FSO Could Reduce IT Stress

    “We’ve reached a point where people have moved away from brick and mortar and are going online,” said Byrne. These online spaces are more omnipresent — and valuable — than ever. The AppDynamics 2021 App Attention Index found that the average digital consumer uses 42 applications daily. Furthermore, 85% of people now say digital services are a critical part of how they get by in life.

    Mounting digital reliance has resulted in rising digital complexity. Therefore, said Byrne, companies have been moving to the cloud for the ease of scalability, elasticity and the capability of cloud functions. Cloud-native abilities like serverless, Kubernetes, identity and access management (IAM) and other add-on services are helpful perks to avoid reinventing the wheel.

    But of course, lifting and shifting all your current architecture to the cloud is costly; plus, it won’t necessarily eliminate application bugs. The user journey is increasingly vast, and broken touchpoints along the way could hinder performance. This is complicated by increasing third-party dependencies. Yet, more often than not, it is the application’s custom code that is having the issue, explained Byrne.

    Perhaps the most significant benefit of full-stack observability is a reduction of remediation time. “If you don’t have perspective, it can take a long time to run down an issue,” said Byrne. “The cost of finding a root cause can be so expensive.” Having a quick window into network, application and infrastructure hiccups is necessary to quickly address issues and save potentially lost revenue.

    Shifting Performance Monitoring Left

    An Amazon study found that every 100ms of latency costs companies a 1% loss in sales. Knowing the reality of high user expectations, software companies must be especially proactive in how they scale to meet the needs of consumers. As 72% of users believe application problems are the brand’s responsibility, the onus is on companies to avoid negative brand reputation.

    To spot performance hangups early on, Byrne encourages a shift-left attitude toward observability around business outcomes. To date, the shift-left mantra has focused more on code validation and security—necessary elements to rapidly deploy software updates. Now, adding performance testing could be the next iteration to further correlate each software push with end business outcomes.

    “You want to see and validate as much as possible before production,” said Byrne. “Performance testing is a key piece in the overall success of an application.”

    This could involve testing the load time for a specific endpoint—if a key action doesn’t meet a certain threshold, then it would not be promoted. Incorporating performance monitoring within a CI/CD process is a burgeoning practice also referred to as BizDevSecOps.

    There’s No Going Back

    The new normal is upon us, and it’s hard to imagine going back to any semblance of a world where there’s a decreased reliance on technology. From airline bookings to banking and grocery orders—software applications are now intrinsic to nearly every facet of modern life. To compete in such an economy, finely-tuned modular customer experiences that continually optimize business outcomes will truly set companies apart from the rest.

    In short, to maintain high software standards, it’s essential to break down operational silos and work together as a team—the DevOps creed. End-to-end ecosystem visibility could help enable that, ensuring, in Byrne’s words, that “applications perform in a way that meets the needs of the business.”

  • The New Norm for Modern Apps: Security Observability

    The New Norm for Modern Apps: Security Observability

    Observability has burst onto the scene across all types of operational and security-focused activities. Its need is being driven by increased demands for businesses to be more responsive to changes and more proactive when dealing with potential problems. In particular, security observability holds the promise to help reduce the time to detect a cyberattack. And going a step further, it can help detect security vulnerabilities before an attack even occurs.

    What is security observability?

    In the past, most operations relied on visibility into their systems and applications to manage security. Visibility would be achieved via monitoring applications, systems, and their logs. Monitoring solutions would collect and analyze information to detect suspicious behavior or unauthorized system changes. And having defined which types of behavior should trigger alerts, solutions would take action as needed.

    Perhaps more to the point, monitoring lets you detect a known set of problems or conditions. Thus, it is essential for alerting and analyzing long-term trends. Simply put, monitoring lets users know how their systems and applications are functioning and being used.

    However, the problem with security monitoring of complex distributed applications is that it is a passive approach to highly dynamic operations. And it often does not provide any insights into root cause problems or anomalies that might be precursors to problems in the making.

    Security observability expands on monitoring by enabling correlation and inspection of the data to provide much deeper insights. Observability typically requires logs, metrics, and deep tracing. All data is used for modeling and analytics. Companies can mine the data, look for patterns, use artificial intelligence and machine learning to remediate problems and proactively defend against problems.

    Why security observability is needed now

    The need for security observability is growing due to the way applications are developed.

    The general industry trend is a move to cloud-native architectures based on microservices. Such an approach brings many benefits. Applications can scale quickly. Companies can easily change or update a small aspect of a larger application without impacting the rest of the app. And businesses can make use of new technologies. For example, a business can add a new front-end or implement more sophisticated AI or machine learning modeling.

    Such a development approach can introduce potential blind spots and complexity. In particular, modern applications built using cloud-native architectures and microservices introduce new challenges. The loose coupling of such applications, their distributed nature, and increased complexity makes it harder to understand vulnerabilities. As a result, traditional cybersecurity approaches break down. They miss the interactions and inter-dependencies of the many elements that comprise modern applications.

    Furthermore, traditional security monitoring solutions can be limited. For example, visibility often must be split across tools resulting in insecure platforms or situations where relevant data is not even used in monitoring.

    Adding to the security challenges is the widescale embracement of low-code/no-code development methodologies. Such technologies open development up to business units and citizen developers. These groups can build sophisticated applications, often with little oversight or guidance. As a result, apps may be created by assembling building blocks that may be outdated, unpatched, or simply have vulnerabilities.

    DevSecOps needs security observability

    With all these trends, it is not surprising that businesses are exploring new approaches to security. Just as quality assurance was melded into development processes using automated testing, security ops are being meshed with development. Hence, the rapid implementation of DevSecOps methodologies in organizations today.

    While security issues can grow when using cloud-native development methodologies, there is a lesser-known security benefit. Applications and services constructed using APIs and microservices have an advantage over other systems because developers and security staff can more easily observe what’s happening inside them. In addition, businesses can add links to the APIs and microservices and use tools to collect the details of such operations.

    Given this wealth of data, security observability expands on monitoring. Rather than just detecting vulnerabilities and incidents that raise compliance issues in the development process, DevSecOps using security observability, seeks to identify issues and automatically take corrective actions.

    Moving forward, businesses should expect more adoption of DevSecOps and more automation based on security observability. This will only serve to strengthen security and compliance across systems and applications.

  • TraceAI : Machine Learning Driven App and API Security

    TraceAI : Machine Learning Driven App and API Security

    API security

    Modern applications are mobile first and are built around cloud-native distributed microservices architectures. These architectures have become the basic building blocks for complex and reliable distributed web and mobile applications. Many of these distributed APIs expose the business logic directly over the web; hence the attack surface and attack vectors are very different for these next generation applications. These next-generation applications demand next-generation application security solutions that need to stitch together a distributed application’s activity using techniques such as distributed tracing and then use next generation ML techniques to solve important application security problems.

    Proactive anomaly detection

    Anomaly detection approaches are a practical way to discover unseen strategies of attackers. However, these approaches are prone to very high false positive rates, thereby defeating their very purpose. Most anomaly detection systems flood analysts with false alarms resulting in a cognitive fatigue. Traditionally, the pitfalls of anomaly detection approaches have been addressed via false-positive workflows, better user interfaces and user experience tools. Analyst feedback is taken as a reinforcement on the algorithm and the algorithm tunes itself. However, the engineering cost of such an approach is very high and the product gets very complex leading to reliability and flexibility issues. Secondly, it still requires analysts in the loop to tune the back-end algorithms. Most practitioners think the issue lies with the anomaly detection algorithms, but in reality there is nothing much that the underlying mathematics powering these algorithms can really do in a cyber security setting. These very algorithms have been proven in domains other than cyber security.  At Traceable, we believe that the problem lies elsewhere. Our understanding of the nature of data shows that we need to support anomaly detection algorithms with something else. We need to marry specific application security nuances with the mathematics powering these anomaly detection algorithms. This understanding led us to build TraceAI.

    TraceAI and API

    TraceAI is the core engine that powers the application security functions of the Traceable Security Portfolio. The foundational principles behind TraceAI are:

    • To be able to dissect the AppSec requirement into the constituent entities that are root causes for application vulnerability
    • To be able to holistically observe the interaction behavior among these entities
    • To be able to discover anomalous patterns in this  behavior

    Using these guiding principles TraceAI implements a complex behavioral anomaly detector. To power this behavioral anomaly detector, we have identified five entities that interact with one another to result in security vulnerabilities. They are:

    • APIs – the basic building blocks of the distributed applications
    • API interaction – how these APIs are wired in order to provide the intended functionality
    • Actors – users, IP addresses or client-side applications such as mobile apps that use APIs to benefit from the intended functionality or in a malicious case, subvert the intended functionality. The actors may be assigned different roles such as admins, clients, managers etc…
    • API Data – inputs from actors required for the APIs to come to life. Outputs from APIs in response to the input.
    • Resources – back-end data or compute functionality requested by actors by calling APIs

    TraceAI combines APIs, API interaction, API data, resources and actors holistically to build an actor-centric and API-centric behavioral anomaly product. As a result, common behaviors, outlier behaviors, automaton behaviors (bots), and attack behaviors are discovered from trace data. These behaviors are API-centric as well as Actor-centric.

    False positives are eliminated by introducing additional security concepts commonly referred to as Trust-and-Risk models. TraceAI automatically identifies API risk and Actor-trust by observing data relative to a baseline which is again automatically built. The baseline in itself is not a piecemeal integration of various unconnected baselines, but is a holistic combination of various observations modeled using modern machine learning tools. We do not need teams of data scientists and security engineers to support the system as the underlying algorithms automatically learn from data. Once in production, the algorithms run in a self-drive mode, automatically building baselines and generating ML models.

    Machine learning algorithms under the hood

    The foundation of any machine learning is the depth and breadth of the dataset relative to the number of features used for detection purposes. Traceable agents, deployed inside your application, API gateways, and Kubernetes cluster, automatically collect all the necessary data and build distributed traces that form the data-layer foundation for TraceAI. Traces are continuously collected to become a learning set on logic and data flow from Edge APIs, to internal APIs to backends and third party services and thus generate the features that represent the application context. Having addressed the data challenge via the tracing platform our next challenge was to choose appropriate machine learning technology.

    The biggest challenge for machine learning in cybersecurity is having to deal with high-dimensional categorical data of sequential nature, combined with the need for explainability, causality, and attribution. Because the attackers’ strategy constantly changes, supervised learning has its limitations. Most popular ML algorithms fail miserably while simultaneously dealing with these two requirements. Taking these factors into account, we have engineered ML-based solutions by building algorithms ground-up (instead of fully relying on libraries) and adopting a self-supervised learning framework. Our unique way of representing multidimensional categorical information allows us to perform ML-based detection even on certain forms of encrypted data as well.

    A key component of the ML-based solution is the ability to discover the API endpoints, and to automatically generate the API spec via data analysis. As a result the expected request/response headers, body parameters and query parameters are not only identified, but are also characterized. This helps build the API spec, violations to which are flagged as anomalies. This completely automated process without the need for manually annotated data is feasible owing to the richness of data captured by the core distributed tracing platform.

    Complementing the ability to detect API data anomalies, TraceAI also detects anomalies in API interaction, and anomalies in users accessing these APIs. The User Behavior and Business Logic representation modules capture, represent and build baselines for regular user behavior and expected business logic. Unsupervised ML techniques are employed because these techniques are the only scalable alternatives. Once the baseline models are built, business logic abuse and behavior deviations are captured and surfaced as alerts.

    Extending behavioral anomaly detection to predictive threat detection, TraceAI introduces a novel exploratory learning paradigm for API security. This approach harnesses the fundamental principles behind reinforcement learning, adapted uniquely to application and user behavior representation. Using such an approach, we are able to generate potential anomalous patterns even before they occur. By comparing users’ activities against these generated patterns, we can identify users who are beginning to tread on a dangerous path. Hence, we can flag these users even before a full-blown attack is launched. As a byproduct, we are also able to quantify known and risky behaviors without manual intervention. Some of the machine learning techniques that we have used in order to power TraceAI are MinHash based embeddings, hierarchical user behavior clustering using LSH and OLAP-style sub-clustering, Bi-Directional RNN variants for time-series anomaly detection, and use of random walks with evolutionary algorithms for explorative learning.

    Anomalies in user behavior in the context of business logic

    Understanding application behavior and user behavior helps in:

    • Identifying violations to known user behaviors
    • Discovering novel behaviors
    • Grouping users based on their behaviors to create user cohorts
    • Determining how exactly APIs are being used in order to build a web application

    One can represent user cohort behavior as a summarized flow-graph as shown below.

    sample application flow
    Sample application flow.

    Each node in the graph represents an API that was called during an active user’s session. Two  nodes are connected if there is a transition from one API to another, and the flow between two nodes represents various statistics such as how many users exhibit such a transition or how often such a transition occurs across user sessions and so on.

    In the above figure, there are around 26 different nodes, each representing an API, and the flows connecting these nodes indicate paths of API access  based on monitoring users’ API call graphs. For a human analyst, this map is very difficult to comprehend and more so to detect that a particular user’s behavior has changed compared to other users’ behavior or to detect that a particular user’s behavior has changed compared to a baseline. Only machine learning algorithms can automatically interpret these kinds of representations and that too at the scale that we have to deal with.

    Behavioral clusters

    The figure above shows how TraceAI was able to create user behavior groups based on the pattern of API access. In essence TraceAI has peered into the complex flow graph shown above and then identified groups of users based on their respective API call flow behavior. The gray circles represent users who fall under commonly occurring behavior groups. These groups are low priority for an analyst as they are population characteristics. The red circle-A represents a user whose behavior is very similar to the gray circle-B. This means the user in circle-A is accessing the same APIs as users in  circle-B but managed to attack one or more APIs.  This further implies that the user in circle-A is following the same business logic as many other users but has managed to compromise one or more APIs. This is interesting information for an analyst, because one can now understand what led to the compromise in addition to knowing what was compromised.

    Tracking user behavior to detect API attacks

    Here, the figure above shows the user’s behavior and where exactly the attacks took place. There were authorization bypasses detected in two of the APIs (nodes) colored in red. The analyst now knows where the attack took place and how they got to this stage. The APIs leading up to the attacked API can now be analyzed for security vulnerabilities and code design flaws. In essence TraceAI has isolated and surfaced interesting behaviors from many possible behaviors so that security analysts can investigate further. By cutting down on possible candidates, TraceAI has reduced cognitive load and investigation fatigue by many orders of magnitude. TraceAI can also detect outlier behavior to flag groups of users who are not explicitly responsible for a known attacks, but are exhibiting suspicious behavior and not being like the rest of the users. Analysts can also dig into the outlier groups shown as “blue” circles, analyze few of these users, and then as a batch put all these users under a watch list. By working at the level of a group, multiple users can be tagged/flagged/watched without having to deal with each user separately.

    Summary

    Traceable combines the power of Distributed Tracing and TraceAI technologies to protect next generation attacks on Web Applications and APIs. By choosing the right machine learning technology, and focusing on addressing API security issues Traceable is pushing the boundaries of API security.

    We would love to talk to you further and demonstrate how our technology addresses API security issues in your environments.

  • Observe Seeks to Put More IT Metrics in Context

    Observe Seeks to Put More IT Metrics in Context

    Observe, Inc. announced today it has updated it observability platform to add support for metrics based on time series data. In addition, the company is revamping how the platform generates alerts as part of an effort to surface more actionable intelligence.

    Jeremy Burton, Observe CEO, said rival observability platforms require IT teams to sift through hundreds of metrics that are generated using elaborate tagging schemes that ultimately drive up the cost of storage. The Observe platform curates metrics by associating them with, for example, a customer, to provide more relevant context, Burton noted.

    That approach eliminates the need to present IT teams with overwhelming lists of metrics in addition to reducing storage costs by removing the need for a complex tagging scheme, added Burton.

    The latest update leverages that approach to metrics to only generate alerts based on curated metrics attached to customers, pods, shopping carts or containers. Rather than simply being alerted to a drop in response times, for example, the IT team can also easily see which customers or pods might be affected. That shift will reduce the volume of alerts that are already overflowing in email inboxes and across other communications platforms.

    Fresh from raising an additional $7 million, Observe today also revealed it has added 20 paying customers since launching the platform on top of the Snowflake cloud service residing on the Amazon Web Services (AWS) public cloud. Rather than reinventing the same core infrastructure, Observe is leveraging a data analytics engine that is already widely employed in IT environments.

    For now, Observe will continue to primarily focus on metrics as part of an effort to deliver insights in a form IT operations teams are prepared to consume today, said Burton. Over time, however, Observe will add support for distributed traces via tools such as OpenTelemetry and Jaeger as it adds additional application performance management (APM) capabilities, added Burton. Rather than telling IT operations teams they are managing IT in the wrong way, the goal is to meet IT operations teams where they are today, noted Burton.

    That strategy also enables the Observe platform to be employed to manage both monolithic and microservices-based applications running on Kubernetes clusters, noted Burton. The immediate goal is to provide IT teams with an alternative to legacy monitoring tools that provide more context at total lower cost by allowing IT organizations to rationalize tools that don’t tend to be especially well integrated, added Burton.

    In the longer term, Observe will also employ machine learning algorithms to collect data more efficiently. However, Burton said the company remains skeptical of visions of an IT future that depend on machine learning algorithms to continuously learn IT environments that are not only unique, but subject to frequent changes.

    Competition among observability platform providers is already fierce. Each IT team will need to decide what type of platform makes the most sense for them based on costs and their preference for specific capabilities one vendor might have that another doesn’t provide. One way or another, however, the way IT environments are managed will soon be changing for the better.