Tag: observability

  • Observability Matters. But Are You Observing the Right Things? 

    Observability Matters. But Are You Observing the Right Things? 

    It’s like clockwork. Every few months, a new buzzword descends on the tech industry, and soon it’s on everyone’s lips. Take your pick from the graveyard of buzzwords past: “Big data,” “internet of everything,” “hacktivism,” “gamification.” It’s not that these terms are meaningless—just that they go from relatively obscure to ubiquitous seemingly overnight. We can add a new one to the list in the digital monitoring space: “Observability.”

    Unlike some trendy buzzwords, observability captures something that’s actually quite important about how we monitor digital systems and how current approaches differ from those of the past. So, it’s a good and useful concept. But where I take issue is with the way many analysts, technologists and vendors seem to use it. Whether or not they mean to, they often paint a far too narrow a picture of what observability is or ought to be, and that linguistic oversight can have real-world consequences. If enterprises invest in observability without understanding what, exactly, they’re observing—and what they’re not—they risk leaving themselves vulnerable to some serious blind spots. 

    What is Observability and Why Does it Matter?

    Technically, observability is an approach with the goal of understanding how a system is doing. The distinction lies in what the system is and how it is being observed. The monitoring tools of yesterday typically focused on one or more domains to identify typical and known problems. Usually, that entailed collecting metrics directly from those domains and measuring them against predefined thresholds. For example, storage levels shouldn’t exceed a certain threshold; if they do, send me an alert so I can investigate what’s happening. 

    On the other hand, observability takes a more holistic approach, examining multiple outputs of the system to infer system health. For example, suppose you were trying to gauge a car’s condition. In that case, traditional monitoring might track engine temperature or idle speed RPMs, while observability would examine things like power output, engine leaks, transmission noise, emissions and fuel efficiency to infer the car’s overall health. 

    This output or outcome-focused approach to managing performance maps well to today’s complex and distributed digital systems. Even if you wanted to, you couldn’t pull real-time metrics from every relevant component of a system when those components consist of thousands of microservices running in any number of physical servers across multiple clouds. However, the bigger problem with more antiquated monitoring models is that they only capture the specific metrics they’re designed to track. If you’re encountering a problem you’ve never seen before, your monitoring dashboard might look perfectly healthy while actual system performance is terrible. 

    Observability and APM 

    So then, observability should give you everything you need to track the health of a modern digital business, right? Well, not so fast. Because for today, people seem to use “system observability” interchangeably with “application performance monitoring,” or APM. And they are not at all the same. 

    Yes, you want an observability-based approach to tracking your application environment, and modern APM tools provide a great way to do it. But knowing the health of your application environment is not the same as knowing the health of your overall digital systems as experienced by users. And at the end of the day, if you’re not gauging performance from your users’ perspective—whether that’s customers, employees or other devices relying on your systems—then what’s the point? It’s unfortunately not uncommon to forget that the most important key performance indicator (KPI) of any digital system is the quality of its intended output or outcome. In the case of any application, the most important KPI is the user experience.

    The outputs that APM tools track do contribute to the user experience—and you want to be monitoring them. But so do many, many other things. There’s the user access itself (browsers, virtual or physical user devices loading the application). There are local, regional and global networks connecting those users to your application environment. And then, of course, there are the dozens, sometimes hundreds of third-party digital services running between and among users and applications. Problems in any link of that digital chain can seriously impact the user experience—even if your application environment itself looks healthy. 

    Observing End-to-End, from User to App and Everything in Between 

    To get the full picture of the health and performance of your digital assets, you should be tracking outputs from across the end-to-end digital service chain. That includes telemetry (logs, infra metrics, traces) from your application hosting environment. It should include actively and passively observing at the point of consumption—that is, outputs from customer browsers and worker devices. It must include active and passive monitoring of network connectivity. And it should include continuous active monitoring of all the disparate services—APIs, content delivery networks (CDNs), DNS services, cloud-based security services and every other cloud and web service that contributes to what the user is experiencing. (And by the way, you should look for independent, objective telemetry whenever possible rather than taking what your various service providers report at face value.) 

    When you approach observability from this outcome-based, holistic perspective, you can capture a real and truthful picture of the performance of your full digital business, not just pieces of it. Just as important, when you do identify a problem, you’re in a much better position to do something about it. Because now you have outputs to measure from all the many systems and services that contribute to the user’s application experience instead of just a subset of them, which means it’s much easier to zero in on which piece of the puzzle isn’t behaving the way it should. 

    A Smarter Approach to Observability

    So, should you take all the hype about observability seriously? Yes. As tech buzzwords go, you could do a lot worse. This one actually means something important. But make sure you’re keeping the big picture in mind as you do. 

    Observability that ignores the outcome begins and ends with the application environment and is nowhere near sufficient. We need to expand our sense of observability, begin with the user experience and encompass every link in the chain of the end-to-end digital business. When we do, we create a much more holistic, useful and actionable picture of the health of our digital systems. And we can make sure we’re continually monitoring digital performance in the way that matters most: As experienced by users. 

  • Grafana Labs Expands into Incident Management Realm

    Grafana Labs Expands into Incident Management Realm

    During its online ObservabilityCON 2021 conference, Grafana Labs this week previewed an incident management platform in addition to making available an on-premises edition of its distributed tracing tool.

    Tom Wilkie, vice president of product for Grafana Labs, said the Grafana OnCall incident management platform is a natural extension of the observability tools the company already provides using the widely employed open source Grafana dashboard. The platform, which is expected to be generally available in 2022, is based on software Grafana Labs gained by acquiring Amixr earlier this year.

    Grafana OnCall unifies all the alerts created by Grafana, Prometheus and the Alertmanager tool the Prometheus community created to streamline the number of alerts generated by the platform. The goal is to reduce the alert fatigue a DevOps team might experience when dealing with an IT issue that can be traced back to a single root cause, noted Wilkie.

    Grafana

    At the same time, Grafana Labs made Grafana Enterprise Traces available for on-premises IT environments. It is based on Grafana Tempo, a cloud service that makes it possible to store and then analyze distributed traces using inexpensive object storage resources. The latest version of the core open source Tempo project has also been updated to add service graphs and the ability to search recent traces.

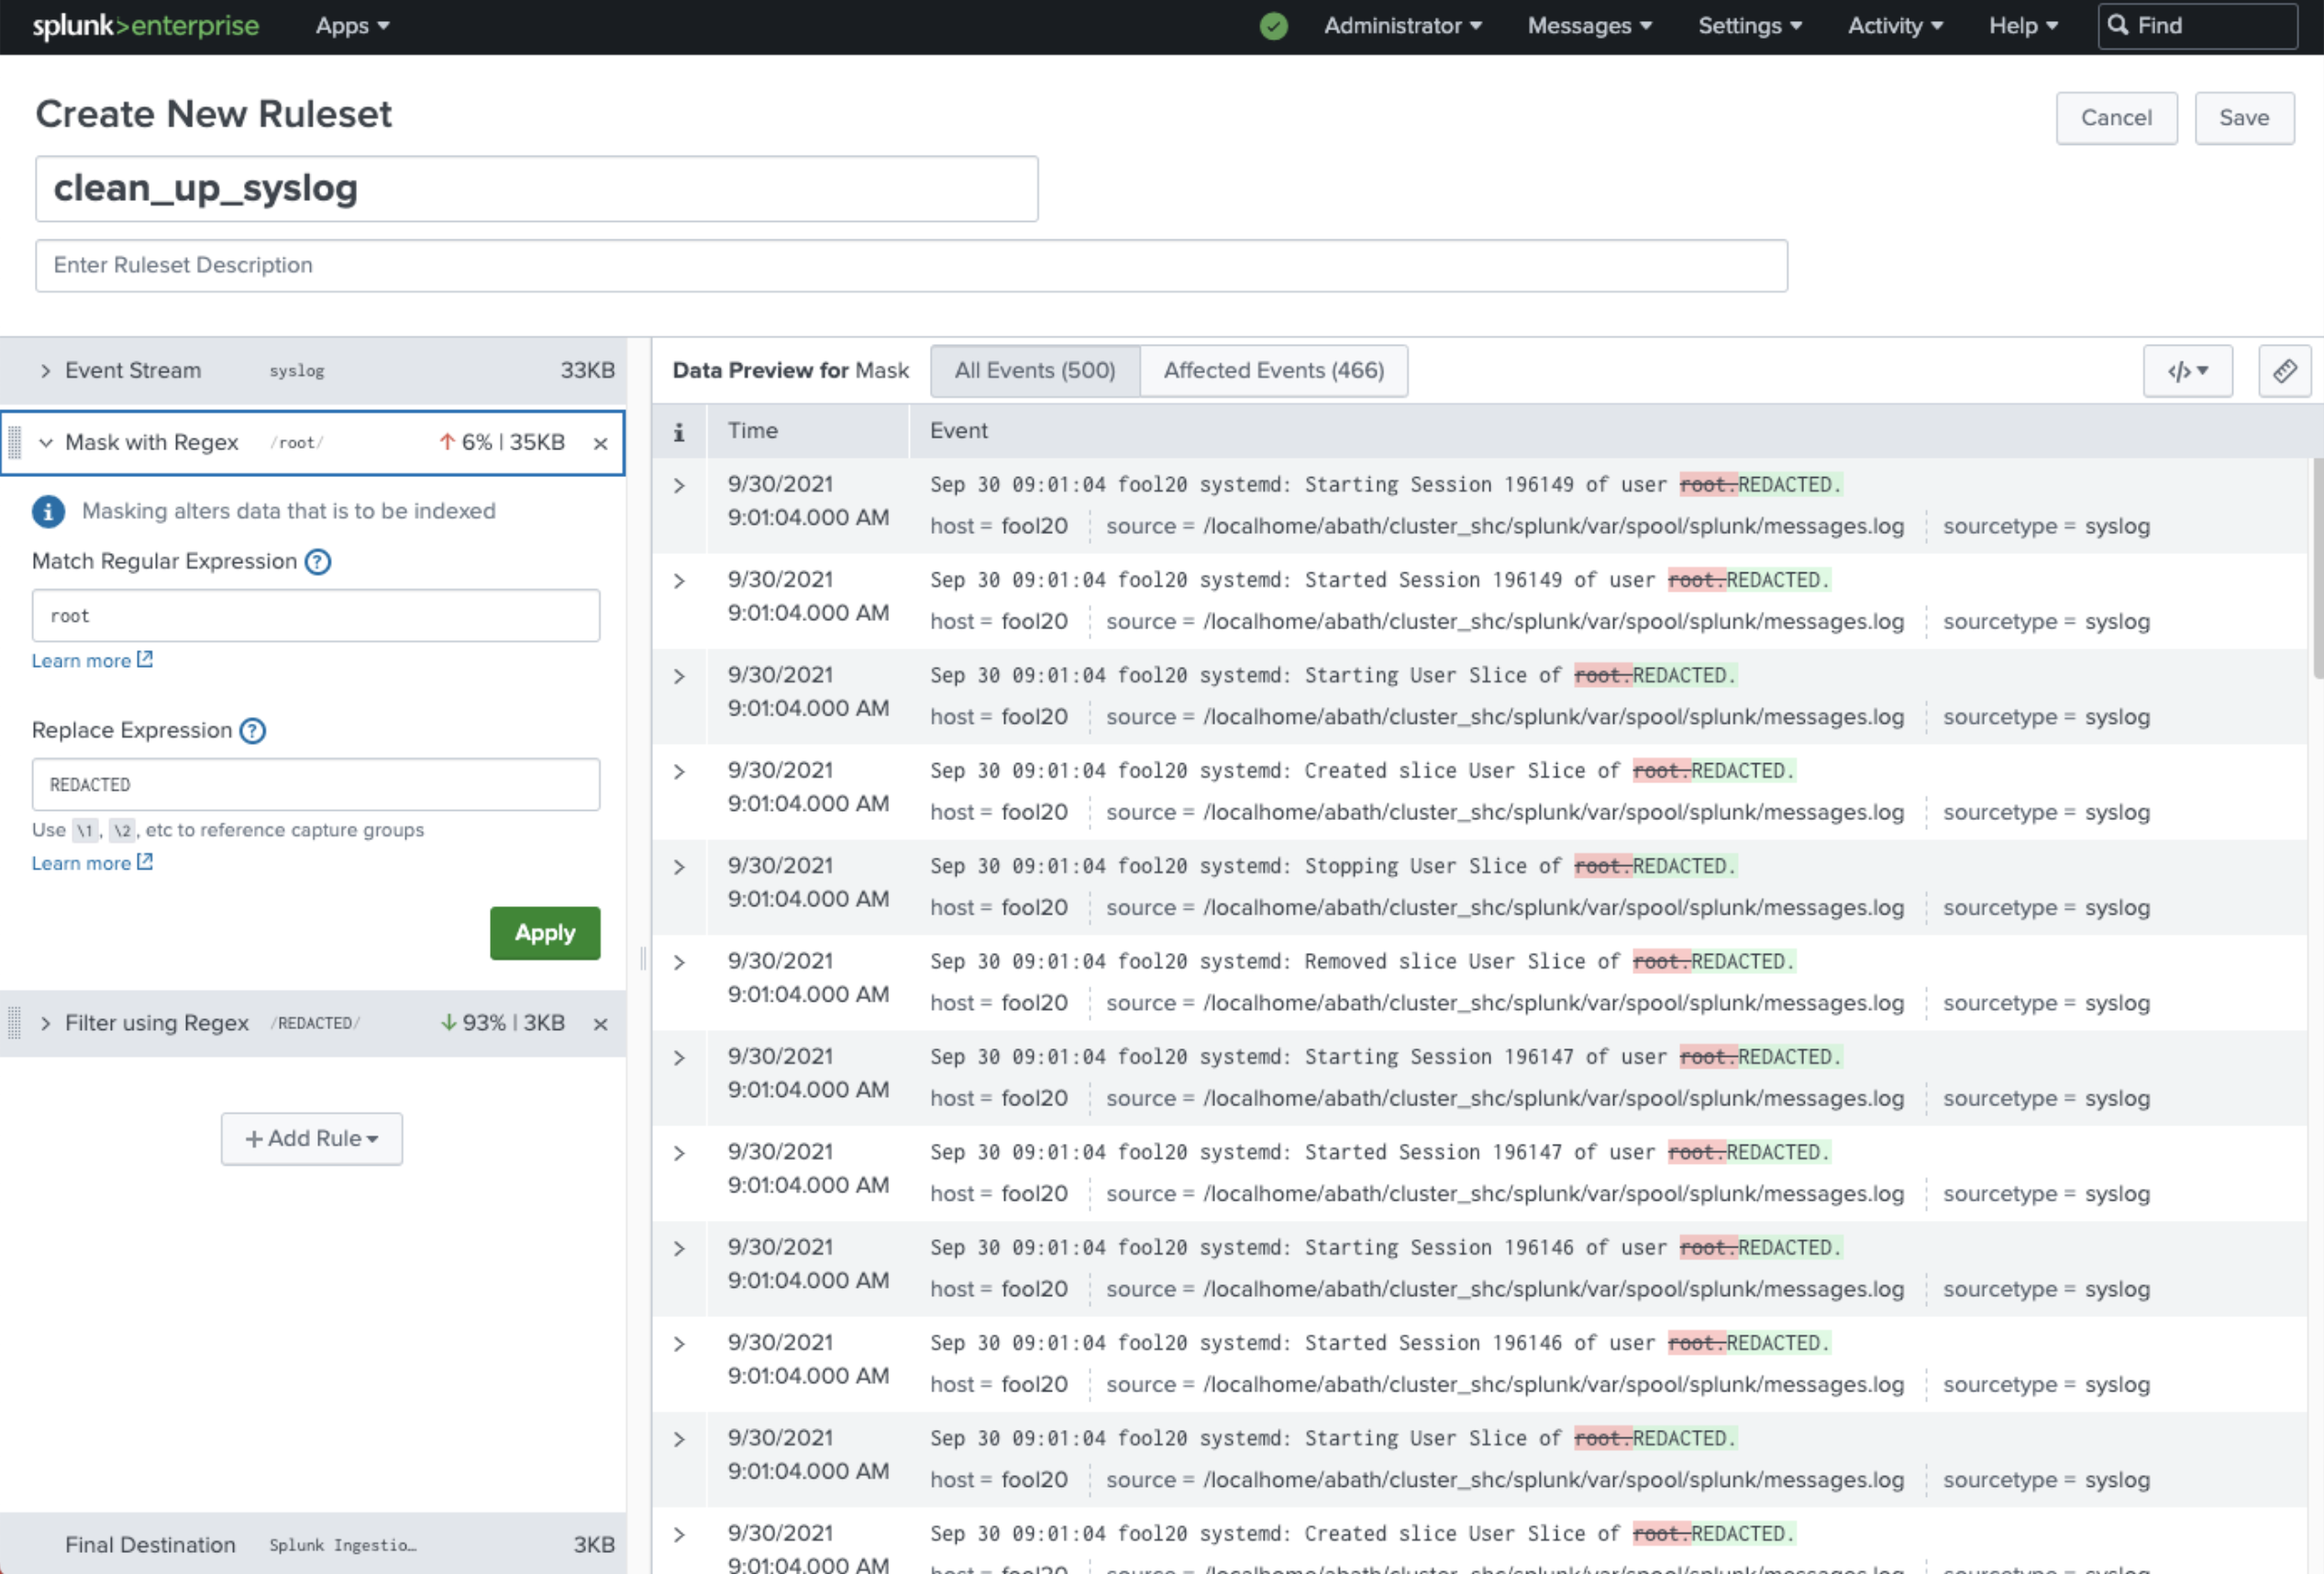
    Grafana Labs this week also updated Loki, an open source log management platform, to add support for out-of-order log lines, custom log retention policies per log stream and per tenant and a deletion API that makes it easy to scrub log data. Version 2.4 of Loki also adds additional high-availability capabilities.

    Other updates to the Grafana Labs platform include support for recorded queries, a set of pre-built dashboards that enable users to quickly drill into their Prometheus metrics data, the ability to consume metrics from the AWS CloudWatch service provided by Amazon Web Services (AWS), improvements to its ability to monitor Kubernetes clusters and updates to the open source load testing tool the company gained by acquiring k6 last year.

    Grafana Labs is also committing to expanding its integration with Microsoft Azure cloud service alongside its integrations with AWS, noted Wilkie.

    While competition among providers of observability platforms is already fierce, Wilkie said an observability platform based on an open source dashboard that can already collect data from more than 100 sources provides a unique advantage. At the core of the Grafana Labs platform is a centralized framework for collecting data generated primarily by the open source Prometheus monitoring platform being developed under the auspices of the Cloud Native Computing Foundation (CNCF).

    While Prometheus is used most often in Kubernetes environments, it is starting to gain traction in monolithic application environments as well; it provides an open source approach to defining a de facto standard for collecting metrics and other data that can be consumed by an observability platform.

    It’s not clear yet to what degree IT teams are distinguishing between monitoring and observability. Monitoring focuses on predefined metrics to identify when a specific platform or application is performing within expectations. Observability combines metrics, logs and traces to instrument applications in a way that makes it simpler to troubleshoot issues without relying solely on a limited set of metrics that are pre-defined and monitor a specific process or function.

    Regardless of whether IT teams view observability as being distinct from monitoring, it’s clear that the ability to manage IT environments is improving at a rapid rate. The challenge, of course, is the IT environment itself is becoming more complex with each passing day.

  • Open Source is the Engine for Observability at Scale – Observability at Scale TV EP 2

    Open Source is the Engine for Observability at Scale – Observability at Scale TV EP 2

    As today’s organizations seek advanced monitoring and observability to ensure the performance of their microservices and cloud native systems, issues of cost, complexity and tool sprawl have emerged as pervasive challenges. Join our hosts Alan Shimel and Mitch Ashley along with panelists Dotan Horovits (Logz) and Constance Caramanolis (Splunk) as they dive into the challenges that DevOps practitioners are frequently forced to compromise on and how they transform modern observability. The video and a transcript of the conversation are below. 

    Alan Shimel: Hey everyone, welcome to Observability At Scale, one of the latest video series or video show series, over here on TechStrong TV part of TechStrong Group. I’m your host, Alan Shimel. And let me just say that Observability At Scale is sponsored by our good friends at Logz.io, it’s L-O-G-Z and many thanks to them for sponsoring this. This is a great subject.  

    I recently in KubeCon about two weeks ago. And I will tell you, it was pretty much all Observability all the time. I did 40 interviews there in two days. And I wouldn’t be surprised if somewhere between a third and 40% of the people I interviewed were about Observability. And many of those being at KubeCon CNCF Cloud Native Con, many of them were about open-source Observability. 

    Whether we’re talking about Prometheus or OpenTelemetry or several of the other Observability-related open-source projects out there. That seems to be the subject of today’s episode: Observability and open source. And I think we’ve got a great panel to discuss this. Let me introduce you to them. First of all, we have Dotan Horovits. Dotan is with Logz. Actually Dotan, you introduce yourself. I don’t want to put words in your mouth. Go ahead.

    Dotan Horovits: Gladly. Glad to be here, Alan. And my name is Dotan Horovits, and I’m a developer advocate at Logz.io. Logz is a cloud-native platform for observability. And the nice thing that I love about Logz.io is that it’s all based on popular open-source tools that we’re going to talk about extensively today like the ELK Stack and Prometheus and OpenTelemetry and Jaeger and so on. So that’s about Logz and myself.

    Alan Shimel: Thank you, Dotan. Next up, we have Constance Caramanolis, and I hope I did that justice. Hey, Constance, how are you? Maybe a little bit about yourself for our audience?

    Constance C.: Good morning. I’m good. Hi, everyone. I’m Constance. I’m a principal software engineer at Splunk. Right now I’m on OpenTelemetry Governance Committee for I guess another five days until elections are over. But I’ve been involved in open source for about four or five years now, both on Envoy OpenTelemetry and on the product with Con community.

    Alan Shimel: Excellent. Thank you, Constance, for coming on today. We appreciate you having you here. And then last but not least, is my co-host of Observability At Scale. He’s also CTO here at TechStrong Group and a principal analyst at TechStrong Research. It’s Mitchell Ashley. Hey, Mitchell, how are you?

    Mitchell Ashley: Good, good, good. Great to be here and very thankful to Dotan and Constance for joining us. I look forward to a great conversation.

    Alan Shimel: Yep. Thank you. So guys, as I started the show off I was out in Los Angeles, I guess it was two weeks ago now for KubeCon Cloud Native Con. And first of all Linux Foundation did an amazing job creating as safe an environment as possible for us to do an in-person event. And it was great to be in-person they got. I don’t want to belabor it but this stuff is good on Zoom, it is better in-person. 

    One day maybe we’ll run this as a live panel from a KubeCon, and that would be just great. But it was all Observability all the time, it seemed. Several things with Observability. Number one, the hairs on the back of my neck stand up when I go to a major show. And there’s something that’s so hot, so hot, that I just feel I can never live up to its promise. And that is what I was afraid with you all. 

    Are we in a overhype cycle around Observability. And then secondly, so much of Observability is based on open-source underpinnings, if you will. Right. There’s a lot of great open-source programs. Maybe that’ll save us from the usual hype cycle that we get here, I don’t know. Anyway, I’m interested in your comments on that, is Observability being overhyped at this point?

    Dotan Horovits: If I may take the first pass on this one. I think that as many trends, and we’ve seen the quite a few of those thought out the years, you have so many vendors trying to piggyback on the trend and leverage that for the relevant offerings that it creates a bit of a blur and confusion about what exactly Observability is about.

    Is it about tooling or methodologies? Is login in its own right for vendors that just provide, let’s say, login of vendors just provide metrics is that Observability? And can you rebrand for Observability yes or no? You have two of these, is that enough? Is signals the whole story about Observability at all? Or is the discussion about Logz metrics traces do justice to Observability?

    I think these are the sorts of conflict and confusion that I see and sense in my conversations with the user community, with customers of ours, with partners of ours. And, again, lucky enough in my position as an evangelist, I use my time to try and clarify and try to separate between the tooling and the methodologies and the essence of things. But definitely, a lot of confusion around that.

    Alan Shimel: A lot of confusion. I did an interview or a panel discussion yesterday with some folks. And one of the things, there was a good line that came out of there was actually around the definition of DevOps, but it’s equally, I think, applicable here, which is, what is Observability? And all of these kinds of things you mentioned, Dotan is, where is the value? 

    Show me where the value is in and I’ll show you what it is, who’s using it, who’s doing it, who’s not. Where is the value? Constance, one might say you were into Observability before it was cool, before it was hyped.

    Constance C.: True. Yeah, right, because that was one of the selling points of Envoy, was making things transparent to the networking to everyone around. And one of the features that made people really love the project was that we would joke, there’s a staff for that. You would send a request, there would be staff for the connection, and everything related to it, and so that made things really easy to debug as a consumer of it. 

    Dotan, you’re definitely right in terms of so much confusion because observably can almost be like the block-chain. And no offense of block-chain, but that’s like the key word that gets thrown around in terms of getting really hip and cool. I think the nice thing about this attention is that it is forcing a lot of people to start thinking more about why they’re doing things.

    There’s a lot of just doing things because you’re either told to or your thought about and now sort of be like, hey, if you’re going to do something, we’ve always asked how do we know at work, but it’s like, oh, let me just write a test. Now it’s a little bit more like how do I systematically know it works by either adding instrumentation so I can consistently monitor it or observe it. 

    I think that is a really good thing that we need to start moving towards, because it’s a little bit more of a, we still check something in, throw it over our shoulders and be like, whoa, good day, everyone. And we’re starting to think a little bit more that sustainability. 

    And I also think there’s a second part too, especially when it comes to these projects that were mentioned earlier, we’re not just thinking about tools anymore, we’re sort of seeing them as products and starting to actually say why this could matter to you, why you should actually adopt them. 

    And that’s something that as engineers, it’s not in our normal toolset in how we think about things, we’re starting to get better at, because we need to start. We’re also selling things for open source, the currencies, commits and contributions and not necessarily money.

    Alan Shimel: I think that’s super important. To the question, is it overhyped? Will it be overhyped? Yes, yes. And whatever the next question is, yes. But I think what Observability has going forward is two big things. One is it started from open sources, it started from a community. Second was trying to solve a real problem around as we move to micro-services’ architecture containers.

    How do you manage this stuff? How do you understand what’s happening? I remember Constance, you’re on a podcast we did together, we were talking about how do you know what happened where, what’s doing what, and what do these things do, to use generic terms, but what is it? So we’ve created this flexible, malleable component containerized architecture. 

    Now how do we understand it? We operate it and improve it over time. I guess the other thing we were talking to, you said software engineers, developers, operations people, they’re not into marketing hype. They’re pretty real folks. They want to know, are you solving a real problem for me or is it a checkbox and you’re calling it monitoring observability?

    So we have a pretty healthy skepticism in the market too that will fair it out, I think in most cases, what’s real, what’s not. Where the value is, to your point, Dotan. Okay, go on.

    Dotan Horovits: If I may just add on that, one of the benefits of the open source tools that we’ll talk about and standards, by the way, it’s not just tools, it’s also standards, such as OpenMetrics and others, is that it’s usually driven by real needs of real companies. Actually, today, I had an episode with a gentleman, senior SRE, site reliability engineer, from Google in charge of the entire identity services package of Google. 

    So when you log into your Google account, it goes through their micro-services. And many of the tooling that they use, and they’ve been using for a couple of decades, is the predecessor of what we currently talk about at the CNCF and many others. So obviously, Kubernetes itself, the containerization is a successor of Borg, their internal containerization orchestration system. 

    And then you have Google sensors that evolved into open sensors that now is emerged into OpenTelemetry together with OpenTracing. And you have the Dapper project that very, very fascinating research paper about distributed tracing that was, I guess, the forefather of Zipkin open source and the Jaeger open source and many others in the industry. 

    The nice thing is that Google’s scale is such that where we are at today was where they used to be a couple of decades ago. So in a way, these are well rooted within realistic problems at scale in micro-service architecture, in containerized environment, cloud native environments and technology. 

    So I feel much more confident basing Observability standards, tools and practices on the open source rather than on some vendor initiatives that again, might be inspired by some strategy and might have some forecasting behind it. But much less solid ground around Observability practices hands on.

    Constance C.: Two things I want to add to that, one is like, I think, I guess this is one of the things I want to keep on advocating for, is that I think we should get more just for nitpicking by cognitive doesn’t actually mean containerization. I think it’s just —

    Alan Shimel: And it doesn’t mean Kubernetes necessarily either.

    Constance C.: Exactly. Yeah, that was actually one of the points I was trying to make is cognitive is like any of the things there. But it’s more just I want us to dump that because a lot of people when they think about, oh, let me modernize my stack, I’m going to go straight to containerization. But that might not be the problem that they actually dissolve. 

    And so that’s just one thing I want everyone to be aware of when people are talking about cloud native is like, what is the problem I need to solve when you’re upgrading your stack, remodeling your house, thinking about that problem there? And I guess, I don’t know, Alan, if you want to talk to us now, but the vendor influence. The vendor influence is really interesting.

    Alan Shimel: I was going to bring that up. Let me jump into that. So let me just also lead off with this stuff. Look, Gartner has been doing a hype cycle for as long as I’ve been in technology, 25, 30 years. And the hype cycle is real. That is the way our industry works. Things get really, really overly high, they do the trial, disillusionment, and then they become productive, or whatever that end stage is. 

    What’s a little different about Observability is it’s in this new foundational era of open source, where you have, as I said, several really good open source projects that are driving so much of the Observability innovation out there. None of those projects are controlled by a single vendor. 

    They’re owned and managed by Linux Foundation and maybe some other foundations, which creates this whole golden era of coopetition, to your point Constance, among all the vendors. And this is a very interesting thing. So everybody starts with that same base. When Mitchell and I were doing vulnerability scanners 20 years ago, you could use the open source that was Nessus.

    Nessus was still open source then. You could use the Nessus scanning engine but there were proprietary scanning engines that people were using, some of them really based on Nessus some not. Not the case here. Here, you got a company like Logz, and Dotan, I don’t mean this in a bad way. But you got a company like Logz, for instance, almost their entire value prop is built upon open source. 

    Built upon that open source. I spoke to the Splunk people, their observability stuff, built upon open source. I’m just made mentioning that because we’ve got the two of you here, but there’s a lot of observability vendors out there. And they’re all built upon the same open source foundational tools. 

    I don’t know if we’ve had this kind of coopetition in a market like this in years past and in times past where, look, everybody starts at that same level and what you do with it. Who makes the best observability solution? I don’t know, I guess it depends on really what your needs are. 

    But it’ll be very interesting to see how in the real world laboratory of market conditions, people all come from the same open-source base, and what the value add is on top of that.

    Dotan Horovits: I would challenge two points there. First of all, we started the discussion from the CNCF and from the Linux Foundation, and we can add on top of that, the Apache foundation and others. But let’s bear in mind that many popular tools out there still are controlled by vendors. We can talk about the ELK Stack, ElasticSearch —.

    We can talk about the Grafana that is highly popular, and it’s controlled by Grafana Lab that actually rebranded itself to Grafana to be synonymous with the open source. So there is another beast out there, open sources that are very popular and very well adopted and very mature, but then again, not controlled by a foundation and this various implications. 

    I guess the most prominent implications are when these open sources are then being relicensed to some degree. So users one day wake up to find that the open source on which they built the entire system around is suddenly being pulled of the open source [crosstalk].

    Alan Shimel: One day we woke up and Nusses was an open source anymore, it wasn’t like that. But that’s exactly the point that I was making with foundational open source and why CNCF and these kinds of foundations —, Apache, whatever, it’s so great. And I’m not picking on Grafana, I happen to like Grafana, I like Loki as well, which is another Grafana project. 

    But the very fact is, if you have one company that’s controlling an open-source project, other companies are very often hesitant to contribute. They may use it for now, but they’re hesitant to contribute. And so in the long run, and I’ve been in open source, Mitchell will tell you, we’ve been in open source 25 plus years. 

    Over the long run the foundational model where you can have coopetition among various vendors prove superior to what I call the big brother open-source model where you have one vendor who owns that, and can pull it at any time or calls the shot. If I’m a VC-funded company, a unicorn or a public entity, and I’m investing 10s of millions, hundreds of millions of dollars, I want to be very careful that I am not dependent on an open-source project that is controlled by a single company. 

    This may be getting off observability and I’m sorry for getting on my soapbox, but I think this goes to the reason why CNCF and that community is so vibrant. It’s so much vitality, why the projects coming out of there are so popular and really changing our game. I look at observability because companies feel like everyone gets dealt the same hand, what you do with it is up to you. 

    No one’s going to pull the rug out from under you. And Constance, you’re on these boards so I’m sure you probably feel that way, but I’m interested in what you all think?

    Constance C.: The vendor has such a dirty word in like CNCF like KubeCon, Cloud Native Con, and open source. Okay, I’m putting on my vendor hat. Well, I’m actually putting on both hats, the vendor hat and also the contributor hat. One thing that the vendors have is that there’s a little bit of superpower. 

    And maybe we don’t as vendors or as leverages, is that we actually get to see a broad spectrum of how things are used. And if we’re doing a good job in terms of like, hey, we’ve seen these things like 10 times over and over so that we think this is really important and bring this to the community that could really help the community. 

    I think sometimes the messaging gets lost, because we’re just like, hey, we need this thing here and not explaining why about there. I think that’s sometimes why vendors get a bad name. It’s such a dirty word within open source, because you feel like, oh, you’re controlling how we want to use things, you’re going to make us buy these things there. 

    If you look at our stats, I can’t remember what the stats are on top of my head, a lot of our talks come from vendor companies because a lot of things we use, they’ve contributed so much time into it. I’m only saying this because I’m trying to make it less of a forbidden word. Because they do have valuable insights, and they do contribute a lot. 

    Then there’s also the end user part who has a lot of different use cases that vendors wouldn’t necessarily see. I also think for like some of the examples you mentioned, it might just be a matter of time before they move over to more CNCF. Because a lot of like, OpenTelemetry is still new, two-ish years. I guess, everything within CNCF are about six, seven years, so really, really new. 

    I think it’s just more like continuation of time, as CNCF is, as you can still see, it’s so new that it’s like iron itself out. It’s starting to be, you could say, the de facto place where a lot of people look to, to donate their projects and be a part of that community. 

    KubeCon and Con keeps getting crazy, crazy numbers of attendees and participation, it’s going to become more and more projects start coming to it, because there’s more of that trust, and it’s a little bit more of a matter of time. I like your, what was it?

    Alan Shimel: Coopetition.

    Constance C.: Coopetition. I’m starting to see it less and less. My scope is OpenTelemetry, I will say I wanted OpenTelemetry be like, we’re all vendors, you’re little skeptical. And as I’m leaving the GC now is like, oh my goodness, just seeing so many different people’s, so many different companies’ perspectives on what customers are targeting, what problem we’re trying to solve.

    And start to view these people at first, I’m like, who are you? It’ll now be like, setting up one on one fairly regularly. Talk about careers and life. We go to open source to collaborate with others who are working on projects that are similar to us or probably they’re similar to us. And this was like another avenue to see the more people and get to know them.

    Dotan Horovits: It’s important to say I work for a vendor — that also contribute to OpenTelemetry and to Jaeger and to others. So definitely I agree with you entirely that the know-how within these companies and the broad perspective of different use cases across different verticals, industries, geographies, gives a very valuable perspective.

    It just requires the right mindset of the vendor, because even if you look at the evolution, specifically around observability, players such as Datadog, New Relic and even Splunk started off with a proprietary agent that did very intelligent things. 

    I agree entirely that the ability with a proprietary agent to fetch the right telemetry, to enrich it with the right metadata to do the right aggregations, to fine tune it to the backend tool, storage and analytics and visualization, that’s perfect. But then again, it is very vendor locked. You can’t correlate across different vendors across different signals, assuming that not the same vendor serves all signals. 

    And that’s what the driver that brought us to OpenTelemetry. And gladly is to say, and by the way, today OpenTelemetry is the second most active project under the CNCF according to the DevStats, CNCF DevStat. It’s really amazing to see. That essentially brought the vendor to their realization that the locking through agents is no longer the future path. 

    And they’re aligning with OpenTelemetry and even contributing know how around the agents back to OpenTelemetry. And now the differentiating factor is within the collector, doing intelligent processing, aggregation and the power of visualization based on that. And that’s the right play, and that’s the play that evens the playing field because everyone gets the same raw telemetry and the raw signals. Now, it is up to you to draw the most value out of that and bring it to the end.

    Alan Shimel: That’s exactly what I was trying to say.

    Mitchell Ashley: With your point, yeah.

    Alan Shimel: That was exactly. I’ll take it one step further. It’s not just the CNCF. We do another video show on here with the open mainframe project of all thanks. Another Linux Foundation project. And it’s really an umbrella for 26 different open mainframe-related projects. It’s the same thing. You got Broadcom and IBM and Rocket and BMC, and many others all working together to be able to do like DevOps on mainframes, project Zoe and stuff.

    The CDF, Continuous Delivery Foundation, same thing. You got all the CD vendors in there.  Yes, there are the Grafanas there. Are the big brother open source players left there? This is the foundational era of all, and mean no offense, why like foundation. 

    But this is the foundational era of open source. You just said, Dotan, that’s it. That’s it. You can’t beat that. And that is why the Splunk and the New Relics and the rest of the world have come around to recognize that as well.

    Mitchell Ashley: Maybe [crosstalk] Alan. May be just kind of fanboy for a minute. What’s really awesome about this conversation is that we’re coming to it from multiple points. It isn’t just about let’s start an open source project, and that grows up into its evolution and becomes popular, etc. That’s one point of entry. There’s other points of entry, the proprietary. 

    We started here, now this has sprung up and we need to, maybe in some cases, companies are forced to. You have to, to be competitive, because something like OpenTelemetry has really become so foundational, to use that word, Alan, that that’s critical. You have to be part of that community, and maybe even have to contribute to be able to do that. I’m referring into a genuine vendor here. 

    And of course, tomorrow, someone else will start. And they’re going to start from where we are today. So what’s cool about this open source, it isn’t one thing, it isn’t one way of starting and one place of starting. You may be, like you were contributing to some early projects when you were at Lyft Constance. 

    Or you may be starting the next company, Dotan, that you’re going to build on OpenTelemetry and maybe one or some other projects, you’re going to join Jaeger, whatever, starts something new. But my point is, it’s not one thread through it, it is multiple threads. 

    But having an underlying activity that is bigger than any one of us, that we are contributing to, that it sort of advances the scrum as we move down the field, so we’re heading in a direction that sort of the rising tide lifts all boats kinds of things, yes, we’re all going to compete. And some people are going to only be interested in sort of their pure open source work. 

    And that’s what I’m going to do. And that’s how kind of a developer I’m going to be or what I’m going to contribute to. Others are going to say, how do I productize? How do I commercialize? How do I build something on top of that? Because I have some great ideas too, to develop it. And that’s what’s cool, how far open source is come from, when Alan and I tried to build some products on earlier open source stuff and to where we are today.

    Dotan Horovits: And that’s the beauty. The beauty is that, many talk about open source in the context of community in the greater good and everything, but then it’s important to say it is also a viable business model. It’s [crosstalk] one that you can build a viable business model, unlike some that claim that they cannot sustain it going forward. 

    And use that as an excuse maybe to take it off the open source or things like that. Actually, just look now, last week, or this week that chromosphere became a unicorn raising 200 million with a one point something billion dollar valuation. And that’s all based on M3DB or M3 that spun out of an internal Uber project, Uber engineering that developed its own time series database, scalable Prometheus, if you’d like, database in terms of time series storage.

    And now it’s a company in its own right with its own open source, in addition to a commercial offering. Now they’re expanding from metrics to also distributed tracing, as far as I understand. So it is happening. It is accelerating, actually, innovation, including business innovation, including new startups. It has sprung up around observability. 

    And it’s a very exciting thing to see that as the open source by polar signals that there is now around a continuous profiling in observability. You see that from all angles, and you see startup and innovation. And I think it’s fueled by and facilitated by the open source. And that’s something that they think is great.

    Alan Shimel: Absolutely. So here for me was the key sort of switch that switched, that enabled this. There was a time when we used to talk about the only open source business model that ever succeeded was Red Hat. That was a common thing you used to hear. And why? Because you look at some of the early open source commercial models, and they were about what we offer support and training. 

    And that was like, how do I monetize open source? You do support and trainings really. Well, that’s not a great model. That’s been proven, not a very lucrative model. Then we started doing some open core, premium modules. So I’m going to give you bare bones and if you want the good stuff, you pay me for it. And that was the model. 

    And look, there’s still companies doing that sort of model, it’s viable. Some people have problems with it, is it really open source? I think it is, but another story. But today, what we have is, Dotan, what you’re talking about. And I think, frankly, SAS has been the great enabler of this. Because now, I can take this open source project, set it up as a SAS app that’s going to do it for you. 

    You know what? People understand that these things cost money to develop, maintain, and deliver. And if I’m getting it as a SAS app like that, and I’m paying monthly or subscription, whatever your subscription is, that’s the way business is done. That’s the way software is done today, whether it’s observability, or anything else in this cloud native world. That has been the enabler.

    Yeah, it’s open source, but I’m getting it as a SAS app, this is what it cost, and I’m good with that. I don’t feel like I’m getting something that I should be getting for free. Ron Gula, who started Tenable Network skewed. I don’t know if you guys know Ron. But Ron always used to say, look, with open source that’s free as in freedom and free as in beer. 

    We’ve concentrated on the free isn’t freedom with observability. It’s not necessarily free as in beer. And I think that’s a key mind view that we need that’s enabled, quite frankly, Logz success. Dotan, right? People say yeah, maybe built on open source, but I’m getting real value out of it. And they’re packaging it all up for me and building on top of that. I’m willing to pay for that.

    Dotan Horovits: I would like to even reiterate what Constance said before because when you look at the vendors, the vendors actually bring value here. The vendors, say, okay, I will make the open source accessible to you. But then again, open source projects, and Constance probably can say a lot about that from Envoy and others, very focused on the core functionality, the core value proposition.

    But for a much more mature organization, it needs an entire wrapping around it that provides DSSO and the authentication, the certifications and all the administrative aspects. The open source developers are not even bothered with that. Even a more powerful UI and an accessibility and user management control agents who are back whatever. 

    And this is the wrapping that vendor with again, vendor that serves enterprises and knows all these needs can augment the open source with these capabilities. I think Splunk is doing it magnificently with enterprises and Logz.io and many others.

    But the idea is that okay, you have the open source that you know and love but the open source beyond having it in a managed version also needs some additional layers to get it to be a commercial grade or enterprise grade. So it can actually be acquired that whatever you run is certified, meets the criteria that you need to run it within your organization at scale. 

    Constance C.: So I guess I’m going to say I’m very disappointed all three of you. I guess you didn’t watch my keynote.

    Alan Shimel: No, I didn’t. I apologize. But tell us.

    Constance C.: Okay, so I don’t necessarily know if it should be offered. Some things shouldn’t be offered as like the vendor implemented for you. But the main thing, one of the points I was trying to make that CNCF is more than Kubernetes. That’s why I was calling out the Cloud Native. We don’t think the — hold it. But the next thing for CNCF you have to keep.

    Actually let’s use it like the hype train. CNCF is on this hype train. And it’s great, because it’s celebrating all this hard work. I’m going to say as a community, we actually deserve quite a bit of attention, because we’ve done a lot of great work. But for us to keep on having celebrations like KubeCon Cloud Native Con, and community based, and just having these fun discussions, we need to make sure that we think of CNCF as a whole product. 

    And each project needs to think as a product. And we actually need to start thinking about integrations. Because as CNCF as a whole, we have great projects here. But there’s no glue between them. And so once you drop one project, sometimes you get some other project for free. But if you’re trying to integrate multiple things at once, you get a hard time.

    You don’t get any freebies once you implement, say Kubernetes and you’re trying to implement Envoy, both things there. No overlap, and so we need to start thinking about from a more together. I don’t honestly know that should be offered to SAS, I actually think that – I know, there’s a bit of debate about should there be CNCF Stack. 

    But I think that we should probably actually have something easily set up 10 projects that were really great together. All look great. And that can help things there. The thing that I really like about where observability space maybe for the value add as vendors, is like the key distinction. For OpenTelemetry, it’s about instrumentation data collection. That’s where our boundaries are specifically set. 

    We will never do anything about visualization. We’re trying to make you gather your data and then after, you can choose how you want to interact with that. There’s a little bit of that boundary that I think are being set around projects of where things go, because you can either try and almost be just kind of gobbling everything up, everything around you. Or you set your boundaries and then you have to let something else track there.

    Alan Shimel: Sorry, I think that’s a CNCF decision. They have to make, like for instance, how many service match projects do you are under CNCF.

    Constance C.: Well, so that’s a no kingmakers rule. Like we do have an explicit rule about there being no kingmakers, because we do want to offer things right. Because I’m biased that I love Envoy, but for some people Linkerd works great. And that’s amazing because there’s all these things there. Some people really love Prometheus, I think open source is great. 

    Metrics is not necessarily equal there. There should be different option because things work better for other there. But it doesn’t mean that we can’t maybe say have like, I don’t know, a few CNCF Stacks. Like these 10 things work great here, these 10 things work there. And this is actually going to be more on the engineers, because CNCF does have more of the model of the open governance so you choose your own adventure. 

    But then you see a little more of, it’s this great thing about open source, you choose your own adventure but we also need to think a little bit more like PMS, because marketers and salespeople are thinking about what the future will be. Because if we just implement the next thing, like go faster build all those things there, you’re not going to have sustainability to project.

    Because I think the thing that we’re taught, everyone’s like, okay. This is almost sold as this is the last big project you’ll ever adopt. 

    Alan Shimel: Agree.

    Constance C.: But we’re not. And if we don’t think about the future, sorry, everyone, you’re going to have another rewrite in 5 to 10 years.

    Alan Shimel: Guys, we’re about out of time, I got to ring the bell here as I said in the beginning of our talk. But you know what, look. I didn’t take the prerogative of taking the last word because I’m the host. We are in a golden age of open source innovation right now. And we have been for the last couple years. And I think CNCF in similar kind of foundations have ushered this golden aged. 

    And there’s a lot of companies including Logz and Splunk, and many, many others who are constantly innovating and pushing what we can do off of this foundation, and I mean foundation of open source. And I don’t know how long it’ll last until we go into a post-cloud native world, I don’t know. I may not be here, but I do think when we look back on this, it is a golden age.

    And it’s going to be very interesting to see what the next short-term, because who knows long-term, what the next short-term future holds and especially for observability. Observability is kind of the poster child right now for what we can do. That’s my poster post right there. Anyway, on that note, I think we’re going to close this one out. 

    Constance, thank you so, so, so much for joining with us today, this was great. I apologize, I had that little network outage there and I don’t have you guys up on my usual monitor. So I keep looking over here to my computer. But thank you for joining us. Dotan, as always, a pleasure to have you on my friend. I look forward to being able to see you soon. Yep. And then of course, Mitchell. You want to take the last word, Mitchell, and we’ll wrap it up.

    Mitchell Ashley: I’m going to leave it right where you said it. You just said it perfectly. Let’s end there.

    Alan Shimel: Okay, then. Hey, we’ll be back in just a couple of weeks, two weeks I think, with our next Observability At Scale. It’s a great series if you’re interested in observability. Check it out. But for now, this is Alan Shimel, TechStrong Group. Have a great day.

    [End of Audio]


  • Observability Vs. Monitoring: What’s the Difference?

    Observability Vs. Monitoring: What’s the Difference?

    As more and more IT organizations pivot from strategies rooted in monitoring to ones that aim to achieve observability, one of the first questions that teams need to answer is, “What is the difference between the two?”

    That’s a somewhat loaded question because there are some differences of opinion out there regarding what, exactly, distinguishes monitoring from observability. But in general, the differences can be distilled into two main points, as we will explain.

    What is Observability and What is Monitoring?

    The first step in understanding the difference is to understand what each term means on its own.

    The classic definition of observability is that it is the use of external data outputs to understand the internal state of a system. In the IT industry specifically, observability could be defined as the use of logs, metrics and distributed traces to understand the state of a complex software system.

    Meanwhile, monitoring is the process by which data is collected from a system. In IT, monitoring is how teams collect logs, metrics and traces and move them to a place where they can be analyzed.

    Similarities

    There are some obvious similarities between the two. Both involve (at least in part) the collection of diverse sets of data. Both also serve the goal of helping teams identify problems within their software stacks and deliver a high-quality user experience.

    Two Key Differences

    But the similarities end there. Ultimately, monitoring and observability are distinct concepts and processes, with two main differences that distinguish them from each other.

    Monitoring collects data. Observability interprets it.

    The first is that observability focuses on interpreting and understanding data, whereas monitoring is merely the collection of data.

    In this sense, you can think of monitoring as one of the processes that makes observability possible. But observability requires more than monitoring. In addition to collecting data, observability also involves the correlation of data from multiple sources and the identification of relevant patterns or anomalies within that data.

    Monitoring Tells you What is Wrong. Observability Tells you Why it’s Wrong

    The second main difference is that monitoring simply alerts you when something goes wrong. Observability goes further by helping you understand why it’s wrong and how to fix it.

    For example, a monitoring tool might tell you that your application’s response rate is no longer adequate. But you need observability to figure out which specific microservices within the application are causing the problem. Using that information, you can plan and execute an effective response to reliability issues using an incident management platform.

    With monitoring alone, you only know that something is broken, not how to fix it.

    Observability and Monitoring: Better Together

    Although it’s common to speak in terms of “observability versus monitoring,” the reality is that you can’t have observability without monitoring. (You could monitor without observing, but doing so would significantly reduce your ability to understand and resolve problems quickly.)

    So, don’t think of it as an either/or proposition. Think of them as concepts and practices that go hand-in-hand, even if they perform different functions.

  • New Relic Acquires CodeStream to Close Observability Gap

    New Relic Acquires CodeStream to Close Observability Gap

    New Relic today revealed it has acquired CodeStream as part of an effort to make observability data more accessible to developers.

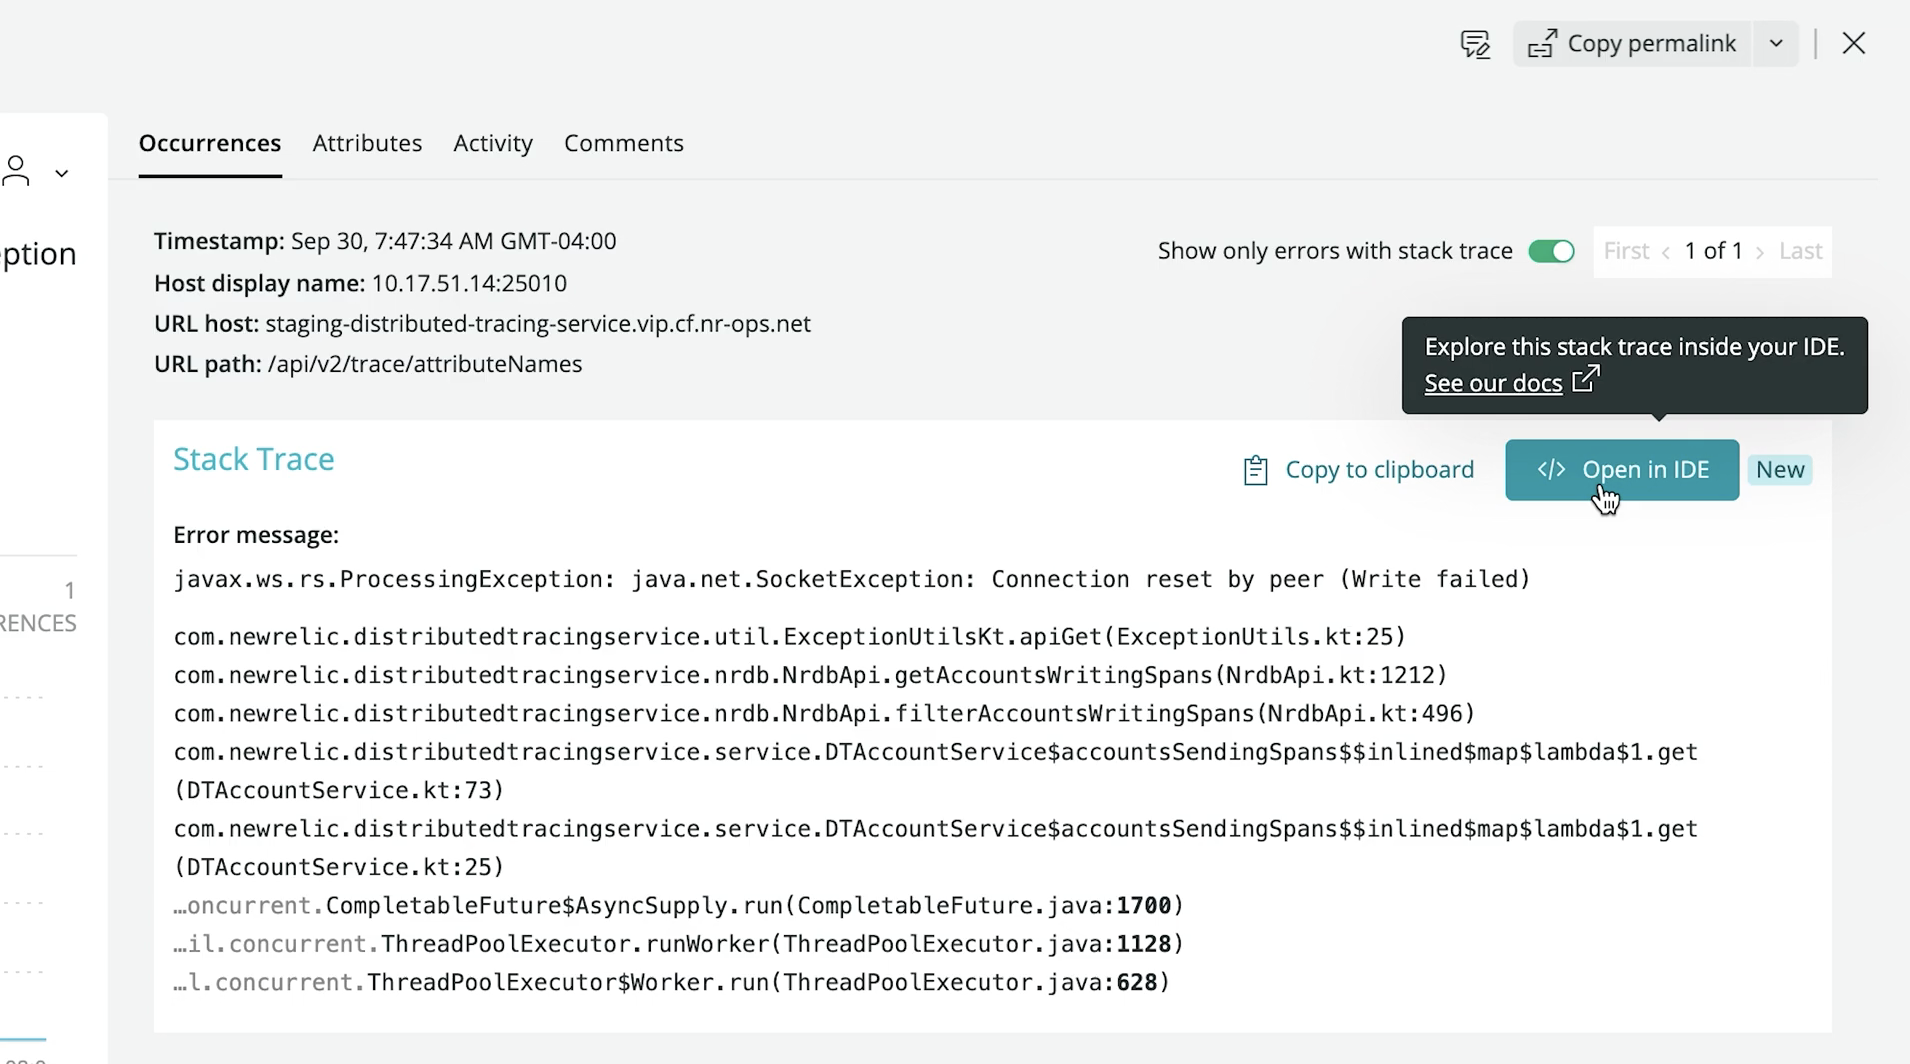
    Buddy Brewer, group vice president (GVP) and GM at New Relic said New Relic CodeStream makes application telemetry data collected via the New Relic One platform directly available within an integrated development environment (IDE), now including Microsoft VS Code. In addition, there are also integrations with Microsoft Teams and the GitHub repository.

    The goal is to close an observability gap that exists today between developers and IT operations teams that stems from a lack of developer visibility into production environments, he noted.

    Finally, New Relic is also announcing a core user pricing option for New Relic One that is aimed at developers. Starting at $49 per month, developers gain access to a core set of capabilities such as CodeStream integrations, errors inbox, logs, GraphQL application programming interfaces (APIs) and the ability to build and run custom applications on New Relic One.

    Peter Pezaris, CodeStream co-founder and CEO, now GVP and GM, strategy and developer tools at New Relic, said becoming part of New Relic will make it easier to bridge the divide that exists between most developers and IT operations teams by making it much easier for developers to see how their code is actually executing in a production environment. That capability will eliminate scenarios where code that runs just fine on a laptop executes poorly in a production environment, he added.

    Developers can also add inline code comments, trigger pull requests, request feedback and track issues directly from their IDE via integrations with a wide range of developer and communication tools. Developers also can switch from New Relic One into an IDE in a single click to navigate, triage and remediate production errors in the context of the code they wrote.

    New Relic is initially making New Relic CodeStream available for free—no credit card required—during a preview period that extends to January 12, 2022. Afterward, some of the more advanced features will require a paid user license once free tier limits are reached. Similarly, IT teams can also sign up for a free New Relic One account without entering a credit card to instrument their applications.

    As the responsibility for managing applications in production environments continues to shift left, Pezaris said it’s critical to give developers the tools they need to optimize code in a production environment.

    It’s not quite clear exactly how much responsibility for applications is shifting left toward developers; it differs from one organization to the next. Many are simply trying to reduce as much friction as possible between developers and their IT operations teams by providing more ‘connective tissue’ from New Relic that IT teams would have to otherwise write themselves, noted Pezaris.

    It may take some time to bridge the observability gap between developers and IT operations teams. Most IT operations teams are still coming to terms with what observability provides that existing IT monitoring tools don’t. Monitoring, at its core, focuses on predefined metrics to identify when a specific platform or application is performing within expectations. The metrics tracked generally focus on, for example, resource utilization. In contrast, observability combines metrics, logs and traces—a specialized form of logging—to instrument applications in a way that makes it simpler to troubleshot issues without having to rely solely on a limited set of metrics that have been pre-defined.

    In theory, at least, that level of observability should ultimately reduce the total number of incidents an IT operations team needs to fix by identifying issues long before they become an actual disruption.

  • What Does Observability Mean to You and How Does it Scale? – Observability at Scale TV EP 1

    What Does Observability Mean to You and How Does it Scale? – Observability at Scale TV EP 1

    Observability is evolving quickly as a concept and practice, but what does observability really mean to you and your organization? For many DevOps teams it’s all about speeding MTTR across complex infrastructure and applications. For others, the notion of observability-driven development is being embraced as a strategic business initiative tied to customer success. Where does your team stand in this process, and what are the keys to successfully scaling observability to meet your specific requirements? Join us for this thought leadership discussion. What does observability mean to you, and how does it scale? Alan Shimel is joined by Mitch Ashley, Tomer Levy, co-founder and CEO of Logz.io, Helen Beal of DevOps Institute and Brian Dawson of Linux Foundation. The video and a transcript of the conversation are below.

    Alan Shimel: Hey, everyone, I’m Alan Shimel, CEO of MediaOps, devopsy.kinsta.cloud, Security Boulevard, Container Journal, and TechStrong TV. Welcome to a new series that we’re launching here on TechStrong called “Observability at Scale.” I’m really excited to launch this particular series, because to me, it deals with one of the, you know, one of the biggest issues, I think, facing dev ops, SREs, development teams, IT teams, in general, today. And that is what we call observability. Now, yes, ten different people, you’re gonna get ten different definitions of what observability is, and that’s kind of a double-edged sword, it’s a good thing and a bad thing, much like, there was no official definition of dev ops. However, it’s too big, no pun intended, too big an issue, too big a topic for us not to really be able to put our finger on.

    And especially as it continues to scale, because scale is probably the biggest issue around observability. But before we jump into all of this, we’ve assembled what I think is an amazing panel for this first show, and I’m gonna introduce them to you here in just a moment. Before we do, I wanted to give a big shout-out to our friends at Logz.io who are sponsoring this series and making it happen. You know, we need to pay the bills, here, and we can’t do it without sponsors, so many thanks to our friends at Logz.io. Let me now introduce you to our panel. I’m gonna start off with my friend Brian Dawson. Brian’s a frequent contributor to TechStrong TV, has been for years, but I’m gonna let him kind of introduce himself. Brian, say hello.

    Brian Dawson: Hello, Alan. Thanks for having me on. I’m Brian Dawson. I currently am the vice-president of developer relations and ecosystem development at the Linux Foundation. I came here by way of, ah, god, I hate to say _____, a multidecade career in software, as a software professional. Starting with Console Game Development, where we launched the PlayStation, but I spent about the past decade with a focus on optimizing software development and delivery via CICD and dev ops practices.

    Alan Shimel: Fantastic. Thanks, Brian. Next up is our friend, the chief ambassador of the DevOps Institute [laughs], Helen Beal. Helen, welcome.

    Helen Beal: It’s lovely to be here. Thank you, as always for the invitation. As you just said, I am chief ambassador of DevOps Institute. I’m also chair of the Value Stream Management Consortium. I came to all of this via many, many years of being in dev ops in ways of working culture, mainly, in Europe, as you can probably tell from the accent. I’m also, bizarrely, quite a lot in the Middle East, as well. And, yeah, delighted to be here amongst lots of people _____ _____ _____.

    Alan Shimel: Very good, pleasure to have you, Helen. I didn’t recognize any accent. [Laughs] Our third panel member is Tomer Levy – if I mispronounced it, I know it’s Levy, Tomer? Or how do you pronounce Levy? Levy?

    Tomer Levy: Levy, Levy, anything goes, Alan, for you, whatever you want.

    Alan Shimel: Well, no, in New York, we say Levy, but I know in other parts of the world, it’s Levy, so. Anyway, Tomer is CEO, right, of Logz.io, but why don’t you give’em your background, Tomer.

    Tomer Levy: No, absolutely, Alan, thank you, this is an exciting show. I’m Tomer Levy – that’s how I say it. You have to guess where the accent is from, but I’ll leave it to you guys to guess. If you say which accent [crosstalk].

    Alan Shimel: Mm-hmm, what accent?

    Tomer Levy: Exactly, what accent, exactly. Good, so I’m Tomer, I’m the CEO, one of the founders of Logz.io. We’re a cloud observability company, you know, hence the discussion and hence why we’re so excited about this topic. For me personally, I live in Israel, so that’s the accent. I am a second-time founder; I built a company before Logz.io. This company was around containers and, you know, a little bit before _____, we built a really cool container technology, and observability was a huge challenge. And when I moved to my next role, I said, you know, “How am I going to solve this?” and one day I saw this amazing opensource and I said, “I am going to make sure every developer in the world can use this opensource the same way I wanted to use it but could never do it. I had to use other tools _____ _____ which I didn’t like so much. So this is where I’m coming from, this is why I’m passionate about it, and I’m looking forward to this discussion.

    Alan Shimel: Fantastic and welcome, and thank you for the sponsorship. Last but not least is my cohost of the show along with me, and it’s my friend Mitchell Ashley. Mitch, why don’t you introduce yourself.

    Mitchell Ashley: Always good to be here and always good to be amongst friends. Thank you, everyone, for joining. My name is Mitch Ashley. I’m CEO of Accelerated Strategies Group, which is _____ _____ firm that’s focused on dev ops, cloud-native, cybersecurity, digital transformation. And I’m also CTO of MediaOps, where I work very closely with Alan and team, and appear on TechStrong TV on a number of areas. I’m both a product creator as well as a practitioner, CIO, kinda lived with it, so, implemented dev ops on IT teams and on product teams. So, I know the observability challenges well. [Laughs]

    Alan Shimel: Absolutely. Thanks, and thanks for joining us, Mitchell. So, guys, as I mentioned, this is our first show in this series, and I think though we wanna get to the issue of scale, I think before we get to the issue of scale, we need to first define observability. We were talking off-camera, and Helen mentioned that they were chopping down a tree in front of her house out there in the UK, and was it interfering, did anyone hear it, was it a lot of noise. None of us heard it. So of course the issue raised, if no one hears the tree being chopped down at Helen’s house, has it really been chopped down. And, you know, I guess it’s a question of what we observe and what does observability show us.

    But that’s not a great definition of observability. I’d like to – who wants to take a first crack and kind of saying, “Well, what exactly do we mean when we say ‘observability’?” Now, Tomer, I don’t wanna put any pressure on you, but you’re the CEO of the observability company, here, so, I’m gonna ask you to kick us off on that, and then Brian and Helen and Mitchell and I can jump in.

    Tomer Levy: No, for sure, I mean, you know, it’s a good question, how do you define, because people define it as signals, they tell you what the software is doing, and it’s all true. For me, it’s Mitch without glasses is when you don’t observability, right? You take your glasses off and you’re half-blind, right? So, I know you can see well, but for me, it’s these new glasses that you look into software, right, software is there to run a business. It’s e-commerce, it’s gaming, whatever it is, if you have glasses which are really, really good, I imagine, like, you put it on and you see these, you know, especially with _____ architecture, like, hundreds of different cogs moving around. And just to find this one place where the cog is stuck or something in your business is failing, these are the glasses.

    And people need these glasses today more than ever, right, with microservices, with modern architecture, with cloud, there are so many moving cogs, and observability, for me, is just a way to understand how is your business performing on a technical level. And because if some tree fell down inside your, you know, operation, no one cares, but if it impacts the business, then it’s important. That would be my definition.

    Alan Shimel: I think that’s a good one. Helen, Brian, interested in [crosstalk]?

    Helen Beal: [Crosstalk], for me, it’s a characteristic of a system that needs to be instrumented into a system, so I kind of go back to the mechanical engineering roots of it and the control theory. Also, with my dev ops background _____ _____ _____ it’s telemetry everywhere, so, this idea that everything is emitting lots of data, but with observability, I think it’s a more conscious effort in terms of what we’re instrumenting, what data we’re looking to emit. And then, the monitoring part is what we do when we observe our observable system. So, slightly different view, but I think we’re all trying to achieve the goals with this. Brian?

    Brian Dawson: Yeah, well, and I think a key part of the sort of traditional control theory around observability is this concept that I can derive or identify the state of a system based on observing outputs. And I was thinking about it earlier, and seeing it as akin to these Ring cameras that everybody has, right. And, you know, initially, it’s just put up a video camera, see what’s going on around my home. That itself does not provide me, necessarily, with observability. I can observe an aspect, but now imagine, as I start to get 360 cameras around my house, and water sensors, and a smart thermostat, right, I’m establishing a number of outputs that allow me to observe the state of my home: is it empty, is somebody approaching it, what is the temperature. Then I think another layer is when we talk about integrating and extending it to provide for action, right? So when we look at another layer of observability that we get with modern smart home systems is I can not only observe that it’s too hot, but I can respond and quickly resolve that issue to bring my home, the system, into a state that I’d like it to be in.

    Alan Shimel: Fair, good stuff. So, here’s my issue, right, I consider myself a businessperson, right? I know a lot about technology, but I’m not a developer, I’m not an SRE. Truth be told, I’m a half-assed security person, even. [Laughs] But I know enough about this stuff to be dangerous, right? And if I can’t understand what it is that something’s supposed to do and put my finger on it, it’s very hard for me. For our audience out here, guys, right, where does the rubber meet the road on observability?

    Helen Beal: [Crosstalk] start with a crack on that one. 

    Alan Shimel: Go ahead, go ahead. [Laughter]

    Helen Beal: So, we are in a digitally disrupted world, so most organizations are trying to transform to take advantage of the opportunities that the Internet provides us, and that means that they need to leverage a couple of things. They need to leverage dev ops and they need to leverage cloud. Once they start leveraging cloud, they create distributed systems, so we’re moving _____ _____ to microservices to a much more complex environment. So this is one of the issues of scale. I think we’re gonna talk about a different issue of scale, as well. But once we’ve got those microservices environments, we can then apply dev ops principles, because we’re able to build, test, and deploy in very small pieces, so we can go much faster. But there’s always a tradeoff, right, and the tradeoff here is that we’ve now got thousands, maybe even more than thousands, tens of thousands, millions, perhaps, of little bits of things, microservices that we need to manage.

    And therein lies the problem, that now all our traditional monitoring systems don’t really work, because we’ve got all this other stuff to look at. And then, from the business perspective, okay, it’s complicated, but why is it a real problem? Well, it’s a problem when something breaks, ’cause if something breaks, it’s unplanned work, and if we’re doing unplanned work, that means we’re not doing the planned work we want to do, so we’re not innovating. So if we can fix the problems around unplanned work, we are able to become a higher-performing organization, because we are able to deliver more value to our customers. We can, you know, spend more time on technical _____, we can spend more time learning, and become a dynamic learning organization and take that way.

    There’s a whole other bunch of use cases, by the way, around observability, that aren’t about debugging and instant management, which we’ll probably come to, as well. But that’s my view on why this is important and people should be trying to invest in building an observability culture and figuring out what tools they need to implement to support that goal.

    Mitchell Ashley: And I’m gonna really build on that. Helen, I very much agree that it’s, our software architecture is cloud-native, that initially sort of kicked off the observability, how do I manage thousands, maybe millions of bits _____ objects containers with code in it. I think it’s, observability, to me, is sort of an onion, and, yes, it’s managing the complexity of our software architectures like cloud-native, but it’s a lot more than that, ’cause we have infrastructures code, we have multi-cloud, we have distributed applications, we have dynamic environments where software is ephemeral. Those clusters may be running containers _____ _____ now gone, and another five seconds later, how do we know what happened. _____ _____ _____ to get back to Brian’s point about what was the state of something that might have caused an error, so we can get to root cause analysis very quickly. I think, ultimately, to Helen’s point, also, is it’s our ability to operate at speed, just like we can develop software at speed. ‘Cause if we can’t operate it at speed, you know, all we’re doing is building really fast cars and smashing into brick walls. That’s not fun for anybody. [Laughs] So I think that’s what really, you know, if I had to kind of say, I think the most important thing that observability has to do is match and support the pace of the business, and at the _____ _____ rate, as well as the rate we create software.

    Tomer Levy: Yeah, Mitch, I completely agree. If I can piggyback on that, you know, companies today cannot compete if you’re not delivering code fast to production, if you’re not delivering changes, you’re just gonna lose. So there is this tension of, “I have to deploy fast, I need to make my engineering team independent, not fearful of making changes,” whether I’m a Pizza Hut or I’m a Walmart, I have to go [snaps] really fast. And on the other side of it, more and more portions of your business relies, you know, on online to work well. So if you deploy really fast [snaps], you might break the entire business. So there’s enormous risk and enormous opportunity, and I think, in a way, observability is that bridge that connects the risk and the opportunity, right? Because if you have an amazing level of visibility with these glasses, that see the microservices, that see all this complexity, and tell you, “Hey, you just broke something, but you can fix it in 60 seconds before anyone knows.”

    And then, it’s amazing, and this is where it works amazingly well and it’s really hard to get there, it’s an ongoing challenge, because the complexity explodes, Helen, as you said, microservices, serverless, this enormous amount of data and telemetry is just, it becomes a huge data problem rather than – you know, and someone really smart comes and tries to search the metrics _____ _____ _____ it’s really, it’s more of a machine problem than a human problem, and this is where I think the world is going to.

    Brian Dawson: Well, you know, and I’d love to add, I really actually see observability, and speaking as somebody that has asked people, oftentime, “What’s the difference between observability and monitoring?” you know, that said, as my understanding progressed, which I’d love for somebody to comment on, I’ve really started to get bought into the fact that observability is a key manifestation of the contract between dev and ops that a dev ops culture looks to drive or speak to, right. We have tooling technology, at another level process and practice, and also maybe we can talk about kind of the culture around observability. But effectively, building a real communication stream to manifest the construct between developer and operations, that enables us to move fast, right, and all have sort of a shared set of data.

    Helen Beal: I think that’s a really important point that you’re making, as well, that the observability isn’t just for IT ops. It’s for everybody in the value stream, so we have ODD for developers, we have the concept we’re testing, that testability is equivalent _____ _____ to observability. We have people like product owners that will understand about the value, which is a slightly use case that I kind of alluded to earlier, and that observability allows us to understand whether our system’s working, but it also allows us to understand customer behavior, which is a very kind of interesting value realization use case. So, yeah, I completely agree, observability is a culture for everybody to be involved in.

    Alan Shimel: Agreed. So, Brian, you opened a can of worms for me [crosstalk].

    Brian Dawson: Good, I like to do that, you’re welcome.

    Alan Shimel: Yeah, again, you know, we look at it from a business point of view, when I first started devopsy.kinsta.cloud, right, one of the important things was APM, right? App Dynamics was a big dev ops company, and they were all about APM. And then, good friend of mine, Dave Link, the CEO at Science Logic said, “Nah, APM – ” he told me, one day, “Alan, APM’s done. It’s AI ops. AI ops is what it’s about, right, and that’s replacing APM.” And, you know, and we’ve had this evolution of names and, you know, three-letter acronyms to describe, as Brian says, that intersection of dev and ops, to describe what to me is to observe, right? To observe and then to act on the data that, you know, the data stream that I’m getting from my applications, from the software I’m developing.

    So to me, at a very elementary level, that’s observability. I’m not sure where it fits in, though, to monitoring and performance management, and AI ops, and all of these things. Is observability the replacement term and the replacement for all of these things [crosstalk] something different? Yeah, is it an umbrella or is it –

    Brian Dawson: I think that’s a good discussion, you know, what is it, is it a component of it? Is it now an umbrella term, for all of the types of monitoring kind of activities, data [crosstalk]?

    Helen Beal: [Crosstalk] I was just gonna say, so one of our other work family, if you like, Eveline Oehrlich, who’s actually the research officer at DevOps Institute, she also does research and research in action. She recently delivered a new vendor matrix to the market, which was virtually an AI ops matrix, and it became an AIPA, so, a predictive analytics. So she’s looking to rename this whole market. And if you take a close look at the report, you’ll see she’s got an evolution curve. She goes from APM through AI ops and up into observability, so, she’s definitely heading in that direction. And some of the reasons that she wanted to move from AI ops to AIPA is that she sees these other use cases. So she’s seeing that there isn’t just instant management; _____ is customer experience and lots of other things, that aren’t just to do whether a system is performing properly.

    I think some of the movement from APM is that, when we think about observability, it isn’t just about the application; it is about the infrastructure and the network, as well. So it’s kind of like everything in the observability bucket, if you like. Just one more note on the predictive analytics that might be worth chatting about, as well. I do quite a lot of work in the AIOps space, and that was, of course, named Will Cappelli, then at Gartner, back in 2015. And that kind of really put it into the instant management slot. And when we talk about that, we then kind of end up talking about higher levels of capability around things like self-healing and predictability. And we always have this conversation about predictability, about whether we should be able to predict, because if we can predict, then we should’ve known about it and fixed it already.

    And I think this is gonna lead us further into the AI conversation, because part of what we’re doing with observability is trying to get to our unknown unknowns. So, in traditional monitoring, we had a pretty good idea about what was going on in our monolith, but in our distributed environment, there are lots of things happening that we just haven’t got a clue about. And this is where observability, particularly, the AI part of observability really helps. I don’t particularly like the term “AI ops,” ’cause I think it really narrows us into the ops side of the house, which for me isn’t very inclusive of everybody in the technology and business team. I’ll stop there.

    Alan Shimel: Tomer?

    Tomer Levy: No, for me it’s, you know, terminology is secondary, and personally, I’m not actually such an expert in that. For me, you mentioned the contract between dev and ops and – and the contract is not just, you know, what measures are you going to use, but this should be a part of this, this should work. What you’re building is gonna work, it’s gonna perform, it’s gonna be, of course, traceable, and it’s gonna generate the right metrics, it’s gonna generate the laws. So, someone on the other side, or you, preferably, can understand how your software works. For me, observability is about accountability, it’s about independence, it’s about unleashing engineering team to be – just to run forward and do things and without kind of, “Okay, I’m gonna take this piece of software, I’m gonna give it to someone else, and I’m gonna wish him all the best and have a great night supporting this software.”

    No, no, no, you own it, you build it, you run it, and you generate everything you need to run. I can give an example: our engineering team, they cannot push anything to production without metrics and laws and _____ without _____ _____ _____ before they write the code. As they write, before they deploy, it has to be read, right? Then you push it and then you’re done. You know, it’s gonna be reported, you know how it’s gonna perform, you know, the business impact of it. It’s pretty amazing the impact of that.

    Alan Shimel: [Crosstalk] I’m sorry, go ahead, Brian.

    Brian Dawson: Well, no, I was just gonna say, you know, an opportunity to disagree, but I think it’s an important topic. I know we often, you know, talk about terminology and how we name things doesn’t matter. I’ve actually found, if you look at our industry and what we invest in it, oftentimes, where we go in and we play to own given terms in the market and we create word soup, there’s a real dollar cost behind that. As people, I’d say, sort of chase red herrings, right? “Well, AI ops is what I need to do to have successful development and stable systems. I’m gonna go figure out what that is and tackle it.” Tomer, I agree, it’s not the end all, be all. At the end of the day, it’s the core principle in practice, but I do think discussions like these that we’re having, “What is APM versus observability? Where does it fit?” enables us to establish a common language, so we can start to share and propagate these practices, you know, across different companies, industries, departments, and teams within our orgs. Anyway, sorry, Mitch, I stepped on you.

    Alan Shimel: No, Brian, that was excellent. I’m sorry, go ahead, Mitch.

    Mitchell Ashley: I think you were spot on, ’cause you were playing into what I was gonna say, and kind of speaking as an analyst. Analysts love to create categories and have people _____ _____ the defined categories, so, you know, there’s the person who created whatever category. And so, to early entrance of companies in those markets, I think there’s a bit of the conqueror writes history, right, as the dominant players tend to help establish what those terms are. But what I would say is I think the fluidity of these terms represents both the pace of innovation and just how much innovation is happening, as we get more and more cloud-native applications into production, as we do more and more cloud, multi-cloud, hybrid cloud, all of that, software, infrastructures, code, I think that’s what’s driving these questions of how do we manage all of this, how do we operate all of this, how do we use this information to inform the business about what’s happening. So we can know that we’re achieving our objectives for the customer, for revenue, for whatever it might be.

    But I think this sort of word soup is gonna be with us for a while, while we still kind of sort out getting more cloud-native types of applications into the cloud.

    Brian Dawson: By the way, I’m trying to stake a miners claim, what is that bad analogy, to DevNL. That’ll be the opposite side of, the counter to AIO.

    Mitchell Ashley: Oh, that means you registered the domain, is that what that – [Laughs]

    Brian Dawson: Yeah, I’m squatting, baby, I’m squatting [laughter] [crosstalk].

    Alan Shimel: Right, you know, and it’s all good [crosstalk]. Interesting stuff, folks. We’re way more than halfway past, you know, our time limit, here. And there was another, on the abstract, for those watching, you maybe read the abstract for this show and said, “Oh, I wanted to talk about scale, I wanted to hear about scale.” Let us talk a little bit about scale, but before we do, folks watching this, look, this is gonna be a series, we’re gonna do this I think it’s every-other-week or so. And, I mean, I want to explore the topics of how opensource really has been driving, the driving force behind observability. How some of the opensource foundations, you know, Brian’s with Linux Foundation, how they’ve fostered this growth and helped create this market and opportunity.

    And also, finally, you know, what it means for you out here, right? Observability can be your best friend or your worst enemy, in some cases, and, you know, we want to help you make sense of that, as well. But let’s talk about scale, now. So, guys, and gals, in my mind, you know, what’s the single-biggest inhibitor to successful observability scale, right? The datasets we’re talking about, just the sheer mass of bits and bytes that we need to wrap our heads and hands and programs around, in order to at least, you know, to have that data feed of which then we have to, you know, do analysis and hopefully come up with something actionable. I think that’s what’s held, you know, up to this point, it’s been a real issue. Tomer, I have to assume that it’s one of the reasons you said, “Hey, we need a solution, here.”

    Tomer Levy: Absolutely. I think scale has so many different factors. There’s obviously the scale of the amount of data, right? If you take a monolithic application, you know, line by line, and it’s creating, you generate some logs, and maybe pick up some metrics. Or you take a monolithic application and move it into 50 microservices, now they all need to report where they are, what do they do. It’s almost 50 times more data, so the amount of data is enormous. Now, we used to be fine with just logs. Then, you know, the app D came to the world and said, “Hey, let’s do some tracing.” Now, you multiply this traceability by 50, so you have _____ data, and you have traces, and you have metrics to report kind of meaningful events, and now you have to collect all this telemetry into one place, and the sheer volumes are just ridiculous.

    I see customers and they’re telling us, “Hey, I’m connecting, you know, 300 terabytes, a day, of telemetry data,” and you know it’s 99.9 percent useless. But there is, like the tree that makes noise, there is a bit of signal there that is important, and they really need it. How do you get to it? So there’s the scale of data, there’s the scale of the types of data, used to be only logs, and then it goes to different types of data that need to be merged together. I think there was a scale of human capacity, right, how can humans actually understand machine-generated data. _____ so much data, so much volatility, you know, so many different messages and types, just, they’re so smart, these engineers, but it’s really impossible to process trillions of messages.

    So, this is where you’re trying to solve that with, you know, AI, machine learning, and _____ _____ _____ technologies, and we do the same. We solve the scale problem, we solve the different types of data problem, and try to solve the intelligence with predictive technologies. And I think there is one that people don’t talk a lot about, which is the scale of teams and people within the organization. Now, you go to an organization and it’s not 1 company; it’s like 50 different organizations within the same company. They do app number one, app number two, they do, you know, PI, they do whatever. Certainly, every one of them need observability, and someone needs a whole enterprise observability.

    So, this is a huge _____ that we have actually _____ focused a lot beyond the normal, “How do we level an enterprise?” to really take all these pieces and _____ continue to work together, independently, unleashing productivity, and then the entire organization working collaboratively. So these are the kind of scale that I’m thinking about.

    Brian Dawson: And if I may quickly, Tomer, just, you know, when we talk about the scale of teams in organizations, right, now you look within that as we look at the scale at which we’re delivering cloud-native applications across multiple containers, across multiple sort of agile pizza-size teams, more and more sort of supporting the micro-architecture approach, right. We have multiple teams delivering at speed to their component or their area of an overall system, which oftentimes a customer, the end user experiencing it views it as one system, right? And that sort of underscores the need, as you said, Logz.io is providing the ability for those multiple teams, those multiple areas of an organization to have a shared view, so they can quickly observe, earn, and respond, to provide a unified customer experience, right? So just, as we scale across teams, it gets harder and harder to provide a holistic experience to those end users. Observability helps enable that.

    Mitch Ashley: Yeah, I think it’s also, another way to look at this is, who is working on this problem? And to be able to scale. And I think one of the healthy things about this part of our industry is there’s a number of opensource projects that are part of consortiums like the Linux Foundation and elsewhere. But I know, you know, that Logz.io is involved with Prometheus, as a number of companies are, and there’s a lot of ecosystem of other opensource projects that have split up kind of alongside Prometheus. There’s also, of course, Jaeger and OpenTelemetry, so, different folks are working on this problem in different ways. And what I like about – one of the main things I like about opensource is it brings people together, and that’s what Linux Foundation obviously does, and CNCF, and folks like that.

    This is a problem that no one person, no one company alone can solve. You could take a leadership role in solving it, you know, like Tomer and Logz.io _____, but that, to me, that’s a positive indicator of where we’re headed. And which one of those or multiple of those or win or lose, it’s not necessarily the questions; it’s, we will figure it out and it will come to fruition. And it’ll be able to be something that can be shared across the industry, at least in the opensource form.

    Brian Dawson: Yeah, and I’m sorry to jump back in, Mitch, but I love what you called out, there, in regards to opensource and Linux Foundation. And what we talk about a lot is, you know, we talked about this word soup, which is oftentimes not only analysts looking to define markets, but vendors. There’s revenue attached to defining market and owning terms, and I know while at the end of the day we’re all going into this with good intention, kind of the natural economics of business risks, someone trying to stake claim or ownership to a shared and important concept in their space. So, what I do think is important, whether it’s Prometheus, Linux Foundation, or other foundations, is that we ensure kind of some unbiased, an unbiased impartial playing field, right? For people to align around and establish sort of the concepts and frameworks, which we can all then go build on as end users, practitioners, vendors, et cetera. So I love the fact that I get to be in an organization that is playing a hand in building those impartial playing fields around spaces like observability.

    Tomer Levy: If I can say one more word, here, which I agree, solving such a huge problem as one company, it’s almost impossible. You know, there are some giants who are able to do it, but we’re true believers in opensource, we’re, you know, contributing to Jaeger, we’re working a lot with Prometheus, it’s part of our offering, we’re contributing to OpenTelemetry, to OpenSearch, and other projects. And this is what we – we literally embraced opensource to say, “Hey, this is the way the community’s going to solve it. We’re, you know, as a commercial organization going to contribute and make it better and more accessible.” And I believe forward, just the sheer power of the community will help bring it to becoming much more common technology that hopefully _____ will be able to adopt more easily.

    Alan Shimel: I hope so. Helen, we haven’t heard from you in a little bit. Thoughts on this?observa

    Helen Beal: _____ just making me remember a presentation I did _____ about a year ago now, about community looking at things like the [crosstalk] _____ _____ talk about industrial revolutions and where we are. So, we’re on the precipice of this golden age and moving into this very sustainable way of work, and I think there is a mind shift _____ _____ it’s like a global human mind shift, that we’re moving away from thinking about shareholder value and really understanding that we’re working together for the good of the planet. And maybe that’s a little bit too highfaluting, but I do think, you know, I’m doing work as a consultant _____ _____ _____ _____ Foundation. I think there’s, increasingly, this understanding that we need to cooperate in order to do the best work.

    Alan Shimel: I agree, I mean, I think that’s been one of the catalyst or gatekeepers of this if you wanna call it golden age of software development and digital adoption has been the coopetition, right? The coopetition aspect of industry joining hands with potential competitors, for the common good, of the whole world, and in the industry itself. And I think you’re dead on, Helen, we could look at value stream management, for instance, right, where we are measuring the flow, we’re examining and analyzing the flow. And based upon the flow of that data, you know, based upon the data that we get from this flow, we make decisions on how to do better. You know, contrast that or compare it to observability, right? Where does one leave off and the other pick up?

    Helen Beal: Yeah, I mean, they’re very much together. Actually, in the value stream management foundation _____ consortium is gonna be releasing _____ _____ partnership _____ _____ _____ _____ towards the end of the month. There is a whole article from I think it’s _____ Nelson, which is about observability being the BSM superpower. ‘Cause it is about _____ to look into our invisible pipeline, and this is – it feels like we’re in some kind of like _____, ’cause value stream management’s been around for a really long time, and, you know, it comes from the 1950s _____ _____. And yet, here we are again, but there’s a big difference, because we’re now talking about digital value streams. And they’ve always been particularly challenging, because we make them out of code, which is pretty much invisible, and we can put some _____ on top and things, and dashboards, but there’s a lot of stuff we can’t see in software.

    So, observability really helps us, not just _____ _____ when something’s broken, to fix it, but we can apply it to our whole value stream, look at our entire dev ops tool chain, and understand how _____ _____ and how well that’s flowing. I keep on talking about the use case, which is about customer experience, which, to me, there’s a duality in value stream management. It is about flow, but it’s also about value realization. So we wanna know how fast we’re getting that value to our customer, but we also want to know how they’re experiencing it. Is it good? Is it bad? Do they like it? Do they want more of it? And that’s another thing that observability can really help us with.

    _____ _____ as we talked about, there’s so much data out there that we have a limited _____ _____ ’cause _____ _____ it’s human, so we do need to use our machines against our machines or with our machines, so turning them in on themselves, so using our AI machines to understand our data, and observability machines. And, yeah, I’ve made it sound very simple, so, why isn’t everyone doing it? [Crosstalk]

    Mitchell Ashley: [Crosstalk] [Laughter]

    Alan Shimel: Guys, we’re coming up on the end of our time. You know, I feel like for every one topic we are broaching, it’s revealing two, three, four topics that we need to dive deeper in on our future episodes in this series. So we have a lot, a lot to cover in this observability area, but we’re gonna need to wrap up today. I wanted to give each of you a chance, you know, maybe your final thoughts on today’s episode, you know, on topic. And, you know, give someone, people watching, out here, a reason why they wanna come back and get more of this. Tomer, you went last, I believe, so I’m gonna ask you to go first. You went last in the beginning of the show; we’re gonna ask you to go first.

    Tomer Levy: Sure, yes, you’re so generous, thank you. So, maybe I’ll start with a quick – because I didn’t really say what Logz.io is doing, so I have to do it, otherwise, my boss is gonna be upset with me. 

    Alan Shimel: Okay. [Laughs]

    Tomer Levy: We’re a cloud observability company. We help companies monitor cloud. We offer metrics tracing and log management in one solution, includes _____ and includes everything for observability. The way we _____ differentiate _____ _____ opensource, actually, as I mentioned, our solutions are based on Grafana, on ELK, on Jaeger, so it’s a fully opensource-compatible solution, delivered from the cloud. One of the biggest advantages is, around AI machine learning, we’ve built some really cool technologies, crowdsourcing, machine learning, and bringing together. This is why we’re excited about observability. We have more than 1,000 paying customers, some of the largest companies in the world. And I’m excited for the rest of this series, so I think we covered a lot. I think scale is just a big problem, but there are other aspects of observability I’m excited to talk about. So thank you for having me, Alan, and it was nice to spend time [crosstalk].

    Alan Shimel: My pleasure, it’s my pleasure to have you on, Tomer. Thank you. It’s good to even see you. Helen, you’re the lady in the middle, it seems, so, why don’t you go next.

    Helen Beal: [Crosstalk] the rose between thorns or something. Yeah, so I’m gonna perform the sin of talking about word soup. I do think, my entire career, that the IT industry has its own jargon, but I think most industries do. If you went and looked in healthcare, I think you’d find a lot of TNAs and things, there, as well. But as Brian said, without language, we can’t communicate, so we do need to name things. But one of the things we didn’t really talk about today, which I’ve been thinking about a lot, lately, is TDD, BDD, HDD, IDD, ODD. So we’ve got all these DDs, so I started calling them XDD. So just to try and make sense of what I’ve just said, we’ve got task-driven development, behavior-driven development, hypothesis-driven development, impact-driven development emerging, and of course observability-driven development emerging, as well.

    And I don’t think they’re mutually exclusive, but I’d love to have a chat, in the future, with all of you in this type of forum or separate, about how to connect all these XDDs and make sense of them, to help that contract between development and operations that we were talking about, earlier. And thank you [crosstalk], as always.

    Alan Shimel: Thank you, and there’s always an invite here for you, Helen, you know that. Brian, do you have anything to say?

    Brian Dawson: Yeah,

    being facetious. [Laughter] [Crosstalk] it’s early, went completely over my head, hm. No, you know, I think an interesting topic to explore, as we kind of hit on here, is gonna be the common lineage between some of these things that become part of word soup: agile, continuous integration, continuous delivery, dev ops, observability. Which, you know, at the core, they really all are about control loops and feedback systems, right? In order to manage, state, and achieve a certain level of determinism for the systems that we’re delivering, I think it would be really interesting to talk about where those overlap and where we could uncover common best practices, as we sort of strive to implement these things. And then lastly, you know, a big of a plug is, look, I think as we embark, as we identify these new spaces, these new practices, and we embark on growing and adopting them, it is important that we find a place to meet on common ground, and if we – what did you call it, competitors?

    [Crosstalk] Coopetition, excuse me, it’s still early. Right? So, do take a chance to look into the opensource solutions that Tomer spoke about, do take a chance to engage with the community around those spaces, so you can not only learn about what these things are, but so you can contribute. And Alan, hopefully, we’ll do some of that here, on this channel, in incoming weeks.

    Alan Shimel: Absolutely, Brian, and the same as I said to Helen, always an open invite to come join us and contribute and help out on this. Mitchell, you wanna bring it home?

    Mitchell Ashley: Yeah, happy to, Alan. You know, it’s such an emerging and fast-moving field, what it makes me think of is, I think what we can do on this show, on this series, is help bring some clarity, as well as kind of tease things apart. I kind of go back to the goal, constraint-based management, you know, what’s the constraint? Where do we need to focus on to help move this forward? What’s the signal? _____ I’m thinking Gary Gruver, he’s always talking about the signal, right? Getting clarity about the things that we’re talking about. And so, I think with the brain power here, the experience, and I know the other guests that we’ll have on over time, I think this is something that we can really strive for is let’s, in addition to explore, let’s see if we can elevate a few areas maybe with some clarity. So it’s a good goal to shoot for.

    Alan Shimel: Absolutely. Well, panel, thank you so much for kicking off our series on observability. You guys have been great. Thanks so much to Logz.io for sponsoring and enabling this. This is needed in our community. We need to explore this. We need to shine a light, here, on maybe some of the dark corners around observability and how it fits into the whole process. So thank you all. Thank you, out here, for watching this. As I said, this will be a reoccurring series, every episode delving into another aspect of observability, so, stay tuned for it. You could always catch it on TechStrong TV, techstrong.tv, or at digitalanarchist.com, as well as on probably devopsy.kinsta.cloud and Container Journal, et cetera. For now, though, this is it.

    This is Alan Shimel. I hope you’ve enjoyed our first episode of observability at scale. We’ll see you on the next one, but we’re out. Bye-bye.

    [End of Audio]

  • Splunk Expands Scope of Observability While Lowering Costs

    Splunk Expands Scope of Observability While Lowering Costs

    During its online .conf21 conference Splunk Inc. today revealed a bevy of updates that advance observability while at the same time reducing the total cost of deploying its platforms.

    As part of that effort, Splunk also announced it will now make workload-based pricing available to all customers.
    Previously, a select number of small customers had access to workload-based pricing while other customers licensed Splunk platforms based on how much data was loaded into the platform. That approach, however, tends to discourage IT teams from loading as much of their data as possible.

    CEO Doug Merritt said workload pricing was created to enable a value-oriented pricing model that customers could employ instead of a data-centric model that can discourage IT teams from analyzing as much data as possible to improve IT operations.

    To further lower total costs, the company is also previewing a Flex Index option for customers that choose workload-based pricing to enable longer retention for lower-value data at a lower cost. Splunk is also expanding its cloud storage to include a preview of SmartStore, which allows larger volumes of data to be stored more cost-effectively on Microsoft Azure Cloud initially with support for Amazon Web Services (AWS) and Google Cloud Platform (GCP) forthcoming.

    Other enhancements to the portfolio include a preview of a data manager, a revamped onboarding tool for data stored in Amazon Web Services (AWS) and Microsoft Office 365, and Ingest Actions, which enables IT teams to act on data in motion in addition to data at rest stored in Splunk or the S3 cloud service from AWS.

    The company is also now making it easier to find and explore data via a federated search tool and a Splunk Dashboard Studio offering, available via Splunk Mobile, that makes it easier to create dashboards.

    At the same time, the company is also making available Splunk Operator for Kubernetes to make it easier to install its platforms in cloud-native environments. There is also now Splunkbase, a curated catalog that makes it simpler to find or develop a Splunk application.

    In terms of observability, the company is providing a preview of AlwaysOn Profiling for its application performance management (APM) platform, dubbed Splunk APM. AlwaysOn Profiling extends existing tracing capabilities to provide continuous code-level visibility and analysis.

    In addition, there is now a preview of an enhanced version of Database Visibility for Splunk APM, which automatically uncovers slow queries that are causing transaction latency without having to instrument a database.

    The company also announced that its real user monitoring (RUM) for mobile applications, which makes use of open source, now is generally available alongside the Splunk Observability Cloud for Mobile platform. The company also revealed there are previews of integration between Splunk Log Observer and Splunk Enterprise and Splunk Infrastructure Monitoring AutoDetect, a tool that automatically discovers infrastructure anomalies. There are also now additional Content Packs for managing Microsoft365, third-party APM tools and synthetic monitoring.

    Finally, Splunk has expanded its security portfolio to include Splunk SOAR App Editor, which provides a way to edit, test and create security orchestration, automation and remediation (SOAR) applications. There are now more than 350 SOAR apps now available on Splunkbase. The company also launched Splunk Intelligence Management based on a platform it gained with the acquisition of TruSTAR earlier this year and that it is making available security services via a team of experts dubbed SURGe.

    It’s not clear to what degree these additions will enable Splunk to fend off what has become a larger number of rival providers of observability platforms. However, as one of the most widely used IT operations management platforms in the enterprise, it’s clear Splunk enjoys an incumbent leader status it is determined to maintain.

  • Splunk Donates eBPF Telemetry Data Collector to CNCF

    Splunk Donates eBPF Telemetry Data Collector to CNCF

    Splunk Inc. announced during the KubeCon + CloudNativeCon North America conference that it donated a data collector to the OpenTelemetry project run by the Cloud Native Computing Foundation (CNCF).

    Splunk’s data collector runs as a sandbox-level program at the kernel of a Linux operating system and takes advantage of extended Berkeley Packet Filter (eBPF) technology to make it simpler to collect networking telemetry.

    The OpenTelemetry initiative itself spans a range of open source tools, application programming interfaces (APIs) and software development kits (SDKs) that are used to instrument applications. Previously, Splunk contributed the SignalFx Smart Agent and Smart Gateway to the OpenTelemetry project along with more than 64,000 code contributions.

    Morgan McLean, a director of product management for Splunk, said that while OpenTelemetry is officially in beta, some elements of the project are more mature than others. For example, tools for capturing metrics and traces are already being employed, while another set of tools for capturing log data will be ready sometime next year, he said.

    The data collector contributed by Splunk is among the first that operate at the kernel level to collect data, added McLean. That approach makes it possible for some types of data to be captured by default rather than requiring developers to always instrument their applications using agents to enable an observability platform. It will also contribute toward the eventual convergence of network operations and DevOps processes.

    Going forward, DevOps teams should expect to employ a mix of open source data collectors that operate at both the eBPF and application level, said McLean. The eventual goal is to instrument every application by default by making it much simpler to collect data. Today, most DevOps teams are employing a mix of proprietary and open source agent software to collect data that then must be deployed and then integrated with all the applications they build. Given the cost and level of effort required, the percentage of applications that are actually instrumented is, not surprisingly, fairly low.

    However, as agent software becomes more readily accessible, the percentage of applications that are instrumented should increase considerably in the years ahead. For DevOps teams that depend on that data to optimize application performance, that capability should prove to be a boon for improving overall observability in IT environments.

    Observability, in one form or another, has always been a core tenet of any DevOps best practice. Initially, DevOps teams focused on continuous monitoring as the most effective way to proactively manage application environments. However, it can still take days, sometimes weeks, to discover the root cause of an issue.

    Monitoring focuses on predefined metrics to identify when a specific platform or application is performing within expectations. The metrics tracked generally focus on, for example, resource utilization. Observability platforms combine metrics, logs and traces—a specialized form of logging—to instrument applications in a way that makes it simpler to troubleshoot issues without relying on a limited set of predefined metrics focused on a specific process or function.

    Those observability platforms then make it possible to correlate events so that it is easier to identify anomalous behavior indicative of an issue’s root cause. Armed with these insights, it becomes a lot simpler for IT teams to resolve issues faster.

    It’s unclear when OpenTelemetry tools will become more widely employed, but as more tools for collecting data become available, the impact on DevOps will be nothing short of profound.

  • Why Observability and Monitoring Matter to SREs

    Why Observability and Monitoring Matter to SREs

    Site reliability engineers, or SREs, do many things. They help developers build reliability into applications. They manage SLAs and SLOs. They play a leading role in incident management and incident response.

    For all of these tasks, SREs draw heavily on observability and monitoring. Although other parts of the IT organization also typically help to manage observability and monitoring, it’s virtually impossible for SREs to do their jobs effectively in today’s cloud-native world without observability and monitoring tools and data.

    Here’s what observability and monitoring mean, why they’re so important for SREs in particular and how SREs can systematically measure the success of their monitoring and observability practices.

    Defining Observability vs. Monitoring

    Monitoring is the collection of data from applications, infrastructure or other IT resources to track the status and performance of those resources. Monitoring has been a core IT practice since the late 1990s when the first modern monitoring tools, such as Nagios, appeared.

    When compared to monitoring, observability is more intensive. Observability is the collection of discrete types of data from multiple systems and the correlation of those data sets to achieve actionable visibility into IT resources. One thing to note: Observability has a more technical definition in the field of control theory that has to do with using external outputs to make inferences about the internal state of a system; however, when people talk about observability in the context of IT and SRE, they usually mean the collection and correlation of broad sets of data in order to understand complex systems.

    The debate about the differences between observability and monitoring is ongoing, but the consensus is that they boil down to:

    • What versus why: Monitoring helps SREs determine that a problem exists. Observability goes further by allowing them to understand why it exists.
    • Context: Observability provides context around what is wrong with a system. Monitoring, for the most part, offers surface-level information about the existence of a problem.
    • Actionability: Observability empowers SREs to respond effectively to outages, performance degradations or other problems. Monitoring merely lets them know that something is wrong and that it may require intervention.

    In most respects, monitoring is one step in the greater observability process. But observability involves additional practices, such as the correlation of various types of data, to achieve a level of context and actionability that monitoring alone can’t deliver.

    Why SREs Should Understand Observability

    Again, observability has become a core practice for engineers in a variety of roles. Developers can use observability tools to help measure and optimize application performance before deployment. IT engineers can leverage observability to gain visibility into issues that exist in a production environment. Observability tools can help QA engineers determine why an application failed a test.

    But no group has more to gain from observability than SREs. Given that maximizing the reliability and performance of systems is the core mission of SREs, the ability to not just detect problems via monitoring but also to understand them through observability is critical for modern SRE teams.

    That’s all the more true for SREs tasked with managing reliability for complex systems, like those based on microservices. In complex applications, identifying the root cause of a reliability issue—such as which specific microservice contains buggy code or which type of request triggers a performance bug—can be very difficult. By maximizing context into reliability problems, as well as allowing teams to trace requests across complex, distributed systems, observability places SREs in the strongest position to find and fix reliability problems quickly.

    What’s more, beyond detecting issues in systems that have already been deployed, SREs can also leverage observability tools to help build reliability into applications before they are put into production. By observing applications in dev/test environments, SREs may be able to identify reliability risks and then use that insight to find ways to make the application inherently more reliable. Observability might reveal reliability weaknesses that stem from an application’s architectural design, for instance, or from the orchestration tool that manages the application.

    How to Measure Observability and Monitoring

    Getting the most from observability and monitoring requires systematic measurement of observability and monitoring initiatives. It’s only by collecting metrics about observability and monitoring outcomes that SREs can ensure they are improving reliability rather than merely collecting and analyzing data to no particular end.

    While a full discussion of observability and monitoring measurement is beyond the scope of this article, consider the following types of metrics for assessing these practices:

    • Incident frequency: How often do incidents (especially severe incidents) occur that impact production systems? Ideally, SREs will see a decrease in incident frequency that correlates with increased use of observability and monitoring tools.
    • Rollback frequency: The less often an application release is rolled back to a previous version, the more effective the SRE team’s observability and monitoring practices likely are.
    • Mean-time-to-remediate (MTTR): MTTR is a measure of the overall time it takes to resolve a reliability problem. It reflects how well you monitor (which determines how quickly you detect problems) and how well you observe (which is the key to resolving problems).
    • Total data analyzed: Tracking the total volume of data that you collect and analyze through observability and monitoring tools helps you assess the overall scope and scalability of your practices.
    • Total systems analyzed: In addition to tracking total data volume, consider measuring how many discrete applications, hosting environments, CI/CD tools and other systems you are managing as part of observability and monitoring workflows.

    The ultimate goals of SREs extend beyond observability and monitoring. However, observability and monitoring serve as essential means to the broader ends that SREs are tasked with achieving: Maximizing uptime and performance. And while monitoring alone was once sufficient for supporting the goals of SREs, it’s very difficult to imagine an SRE team today that doesn’t also make extensive use of observability, which takes monitoring to the next level.

  • New Relic I/O Aims to Simplify Instrumentation

    New Relic I/O Aims to Simplify Instrumentation

    New Relic today at the KubeCon + CloudNativeCon North America conference launched a New Relic Instant Observability (I/O) initiative through which it is making available open source tools to simplify application instrumentation.

    Marck Robinson, senior vice president for engineering at New Relic, said the catalog of tools will help DevOps teams instrument a much wider range of applications. New Relic will make those tools available as part of the free tier of its observability platform delivered via the cloud. DevOps teams will be able to use more than 400 pre-configured quickstarts to both instrument applications and create dashboards, Robinson said.

    New Relic itself is contributing quickstarts for cloud services, open source tools and platforms such as Kubernetes, Istio and Cassandra. Third-party vendors that have already contributed to the catalog include Cribl, Fastly, Gigamon, Kentik, Lacework and Trend Micro. Each contribution is being vetted by New Relic as part of an effort to foster the development of a larger open source observability ecosystem, noted Robinson.

    Robinson said overall, New Relic is trying to make it easier for DevOps teams to close an instrumentation gap that is impeding IT organizations from moving beyond monitoring to embrace true observability of their IT environments. The recent New Relic 2021 Observability Forecast report notes only a quarter of respondents (26%) have a mature observability practice, with the most commonly cited barriers to observability being a lack of resources (38%) and skills gaps (29%).

    As a result, DevOps teams often encounter a last-mile observability challenge when it comes to both instrumenting applications and then building their dashboards, said Robinson.

    As part of a larger effort to make it easier to instrument applications, New Relic has open sourced agent software, standardized on the OpenTelemetry tools being advanced under the auspices of the Cloud Native Computing Foundation (CNCF) and contributed the Pixie observability platform for Kubernetes environments to the CNCF.

    Observability in one some or another has always been a core tenet of any DevOps best practice. Initially, DevOps teams focused on continuous monitoring as the most effective way to proactively manage application environments. However, it can still take days, sometimes weeks, to discover the root cause of an issue. However, observability platforms are emerging that correlate events in a way that makes it easier for analytics tools to identify anomalous behavior indicative of a root cause of an IT issue. Armed with these insights, it becomes a lot simpler for IT teams to resolve issues faster.

    In contrast, monitoring focuses on predefined metrics to identify when a specific platform or application is performing within expectations. The metrics tracked generally focus on, for example, resource utilization. Observability, on the other hand, combines metrics, logs and traces—a specialized form of logging—to instrument applications in a way that makes it simpler to troubleshot issues without having to rely solely on a limited set of metrics that have been pre-defined to monitor a specific process.

    With the rise of microservices-based applications, the shift to the cloud and more end users than ever working remotely, the need for observability has never been more critical. The issue now is finding a way to make it much simpler to achieve.