Tag: observability

  • LogDNA Survey Surfaces Observability ROI Concerns

    LogDNA Survey Surfaces Observability ROI Concerns

    A Harris Poll of 200 senior engineering professionals suggests it may be a while before most DevOps teams are able to achieve true observability in their IT environments.

    The survey was conducted on behalf of LogDNA, a provider of an observability platform, and found nearly three-quarters of respondents (74%) are struggling to achieve their observability goals despite investing hundreds of thousands of dollars. In fact, well over a third (38%) said they are already investing $300,000 annually on observability tools.

    Despite those investments, less than half of respondents are very satisfied with their ability to use log data. Key areas of frustration include the challenges of collaboration with colleagues spanning multiple teams (67%), the fact that the tools are not easy to use (66%) and the routing of security events (58%).

    Nevertheless, the bulk of survey respondents said they are optimistic about observability. A full 85% of participants said they believe true observability is possible.

    LogDNA CEO Tucker Callaway said the core issue that many organizations fail to recognize is that observability is really a data literacy and management challenge. Organizations are collecting logs, metrics and traces from a wide range of tools and platforms without thinking through optimal data pipeline construction. The result is an aggregation of data that has not been normalized to simplify surfacing actionable intelligence, he said. In fact, many organizations quickly discover that all they’ve really accomplished is increase their data storage costs, said Callaway.

    In the absence of that data normalization, Callaway noted it becomes exceedingly difficult for cross-functional teams to query all the data being collected within a repository.

    At its core, observability promised to make it easier to identify IT issues before they cause a disruption. Observability in one form or another has always been a core tenet of any DevOps best practice. Initially, DevOps teams focused on continuous monitoring as the most effective way to proactively manage application environments. However, it can still take days, sometimes weeks, to discover the root cause of an issue. Observability platforms make it possible to correlate events in a way that makes it easier for analytics tools to identify anomalous behavior that might be indicative of the root cause of an IT issue.

    In contrast, traditional IT monitoring focuses on predefined metrics to identify when a specific platform or application is performing within expectations. Observability platforms combine metrics, logs and traces—a specialized form of logging—to make it easier for IT professionals to interrogate data being generated by a wide range of DevOps tools and platforms.

    Of course, the assumption is that DevOps teams actually know what queries to launch to determine what the root cause of an IT issue might be. In the longer term, machine learning algorithms should make it easier to identify anomalies within IT environments. In the meantime, however, achieving observability still requires a fair amount of DevOps expertise that is not always readily available.

    Eventually, observability will become much more automated than it generally is today. As that transition occurs, IT teams should find the ROI of observability is steadily improving.

  • The Future of OpenTelemetry for Observability

    The Future of OpenTelemetry for Observability

    The observability landscape is changing. Today’s digital transformation journey has highlighted the need for observability as organizations look to capture, analyze and correlate all data across every level of the application stack including logs, metrics, traces and events. With the rampant rise of data, collecting these signals is imperative to both business insights and system optimization.

    Over the last several years, open source data collection has given software and engineering teams the freedom to decide which technologies they want to standardize on for data collection and which vendors they would like data sent to. While open source data collection brought a lot of freedom and advantages, it also created some new problems. The lack of a single, comprehensive framework for all the critical signals observability tracked created a lot of friction for developers. As we move into the new year, businesses are taking the opportunity to reflect on how they can better use their data and apply intelligence to help customers make decisions and sift through all the noise. Enter OpenTelemetry. 

    What is OpenTelemetry?

    OpenTelemetry is a collection of tools, APIs and SDKs that instrument, generate, collect and export all machine data; it was born from the need to develop an industry-wide standard for software instrumentation. By leveraging a single cloud-native framework to complete observability, OpenTelemetry is becoming the gold standard for collecting machine data. 

    OpenTelemetry consists of three primary components: Specification, collector and instrumentation. The specification uses an API, SDK and the semantic conventions and protocol of OpenTelemetry to determine the cross-language requirements for all implementations. The collector removes the need for multiple data collection agents. It is a vendor-neutral method for receiving, processing, transforming and exporting data. The instrumentation libraries allow users to integrate their applications with OpenTelemetry using auto-instrumentation and support from multiple frameworks and languages. Together they provide a robust framework for companies to disrupt their existing observability practices and amplify them even further. 

    It’s All About the Customers

    Most modern enterprises have complex distributed microservices consisting of tens, hundreds or thousands of components that are all working together to deliver on customer experience. If organizations can’t correlate between those components or the different signals easily, it will slow down a business’s ability to effectively monitor, diagnose and troubleshoot issues. 

    For years, organizations have leaned into observability by relying on multiple infrastructure vendors to gather, enrich and ship data to vendors. Still, many still do not maximize observability’s most pronounced ability: Correlating complex systems and signals. 

    As end users desire deep insight into their data, they also expect vendors to offer the best experience to identify and resolve issues within their systems with the help of observability. With true observability, organizations can give customers back their time to focus on what matters, which is managing the digital experiences for their customers and empowering them to meet their customers’ needs. 

    A Similar Road to Adoption

    Much like Kubernetes has been essential for the growing adoption of software containers, the industry is already witnessing the same adoption approach around OpenTelemetry for observability. Kubernetes won the war for becoming the standard for container orchestration. Now, OpenTelemetry will bring the same standards needed for observability with comprehensive visibility into the health and performance of every layer of the stack. 

    OpenTelemetry has become widely adopted by the software development community, but it’s still at the beginning of its journey. The developer community made Kubernetes a success, and we will see the same with OpenTelemetry as customers demand better integration and less lock-in. For vendors involved around applications and software—from more traditional approaches like application performance management to software development pipelines and management tools and through to cloud-native services—supporting OpenTelemetry will be table stakes in the future. 

    With extensive portability, greater developer control and strong vendor and cloud provider support, OpenTelemetry has opened a new world to customers by helping to improve achievable results across the application infrastructure, from the software development process to areas like security.

    How can businesses continue to move the needle on observability while balancing growing customer demands? Quite simply: If organizations aren’t thinking about OpenTelemetry now, they are losing competitive advantage by lacking the proper visibility to deliver on the service level objectives that customers expect in this day and age. 

  • New Relic: Observability Tops 2022 DevOps Agenda

    New Relic: Observability Tops 2022 DevOps Agenda

    If 2021 was the year when IT organizations became aware of the need for observability, then the coming year should see observability aspirations realized.

    A report published by observability platform provider New Relic postulates that there are no less than 11 factors converging in a way that will make observability an absolute requirement for organizations.

    At the top of that list is a simple fact: Observability is now required to drive digital business transformation initiatives that typically span multiple processes. In fact, a global survey of 1,300 IT leaders, software engineers and developers conducted by New Relic found 90% of respondents view observability as critical to the business.

    Second, as a result, observability is now starting to be applied in both pre- and post-production environments as organizations take a more holistic approach to managing the software development life cycle, the report noted.

    Third, the report suggested that IT teams are looking to make better-informed decisions based more on facts than intuition. To do this, teams are using data collected from across the enterprise application environment. In fact, the fourth factor advancing observability in the enterprise is that the cost of instrumenting application environments is dropping, which the report notes is making it easier to collect relevant data.

    The fifth and sixth factors reflect a desire to rationalize the number of monitoring tools that IT teams currently use and the fact that usage-based pricing has simultaneously made it less expensive to leverage observability platforms as needed.

    The seventh factor is the overall shift toward open source software that enables observability platform providers to collectively leverage innovations faster. The eighth factor, closely linked to the open source trend, is the rise of more complex open source platforms such as Kubernetes that require much higher visibility to successfully deploy and manage.

    The ninth trend identified in the report is increased adoption of DevOps best practices that encourage IT teams to view observability as a core tenet of any IT management strategy. The tenth factor cited by the report is the need to drive increased collaboration among IT professionals.

    Finally, the eleventh factor driving further adoption of observability is the need for increased application reliability as more organizations appreciate their dependence on software to deliver essential services.

    Buddy Brewer, a group vice president and general manager for New Relic, said now that observability platforms are becoming more accessible, the next big challenge will be teaching IT professionals what questions to ask as they troubleshoot both legacy monolithic applications and a wide range of emerging microservices-based applications. The results of those queries then need to be easily shared with both developers and internal IT operations teams that must work together to maximize application performance and availability, he added. The latter requirement is why New Relic decided to acquire CodeStream to make telemetry data available with integrated development environments (IDEs), noted Brewer.

    There is, of course, no shortage of observability platforms for IT teams to adopt. In fact, the biggest challenge now is getting every application stakeholder to agree to standardize on an observability platform—no small feat, as many DevOps teams may already have a preference for one approach over another.

  • Speedscale Makes Free API Observability Tool Available

    Speedscale Makes Free API Observability Tool Available

    Speedscale today announced it is making a free edition of its observability tool for application programming interfaces (APIs) available to developers.

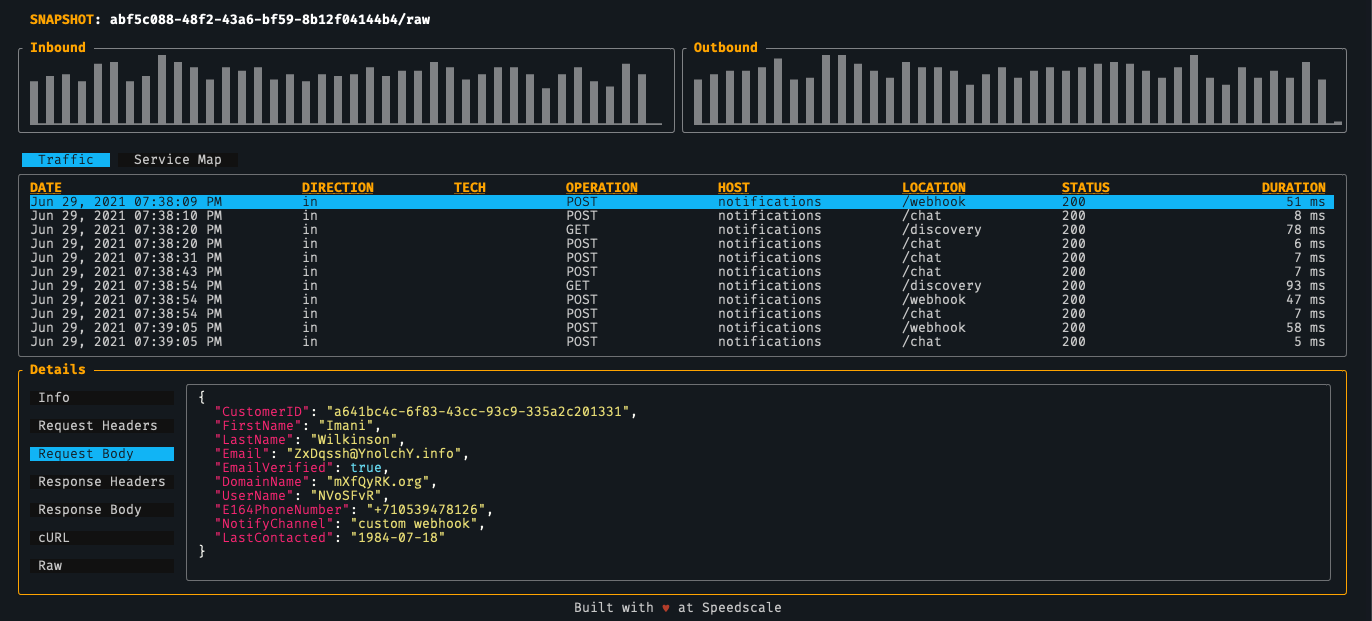
    Ken Ahrens, Speedscale CEO, said the goal is to expose more developers to the company’s API testing tool that can be accessed on their local machine via a command line interface (CLI). Dubbed Speedscale CLI, it is designed to enable individual developers to inspect, detect and map API calls on local applications or containers rather than having to subscribe to the company’s current API testing platform via a software-as-a-service (SaaS) model.

    That approach should reduce the number of disruptions DevOps teams are likely to encounter after an application is deployed in a production environment, noted Ahrens.

    Speedscale CLI features include service mapping, which enables developers to auto-detect and map external dependencies that could break, a traffic viewer for logging and tracing API calls and latency detection tools that show how code changes are impacting performance. In a forthcoming update, Speedscale also plans to include load generation capability to enable developers to run tests locally. The overall goal is to enable IT organizations to shift more responsibility for the management of APIs further left toward the developers that create them, said Ahrens.

    Naturally, Speedscale is also hoping that, as more developers are exposed to its observability platform for APIs, there will be increased demand for its SaaS platform among DevOps teams that need to manage and maintain APIs in production environments within their existing workflows. Speedscale exposes a set of APIs of its own to enable that integration, noted Ahrens.

    At its core, the Speedscale SaaS platform is designed to enable DevOps teams to replay how calls are made between APIs and external mock services to make it easier to diagnose issues.

    In general, there’s a lot more focus these days on APIs, thanks to digital business transformation initiatives that are dependent on APIs to integrate processes. The challenge organizations face is many of those APIs are built by separate development teams. In some instances, organizations can find themselves deploying redundant APIs. Other organizations will create APIs that, over time, are simply forgotten about or that go dormant when the developers that created them leave the organization. These “zombie APIs” often represent a security risk because cybercriminals now routinely scan IT environments for unattended APIs through which they can exfiltrate data without anyone noticing.

    One way or another, the management of APIs is becoming a distinct discipline within many organizations as they come to appreciate the level of IT flexibility they enable. Replacing backend services is a lot simpler when the APIs calls that invoke them both internally and externally remain relatively simple. The challenge is that building and maintaining microservices-based applications based on APIs is a more complex endeavor than building a monolithic application. The first step toward reducing that complexity is, of course, to provide more visibility into the application environment for all concerned.

  • Sentry Acquires Specto to Add Analytics Tool for Observability

    Sentry Acquires Specto to Add Analytics Tool for Observability

    Sentry this week announced it has acquired Specto, a provider of a set of tools for analyzing the performance of mobile applications.

    As the number of mobile applications being deployed continues to expand, developers are being asked to manage them as part of a general shift left that requires them to take on more accountability for how well their applications run in a production environment.

    Sentry CEO Milin Desai said today the Specto tools are focused on making it easier for developers to determine how mobile applications are running, but that the plan is to expand that analytics capability to a wider range of applications.

    As the responsibility for applications continues to shift left toward developers, the need for observability and monitoring tools that developers can easily use is becoming more acute. Sentry already provides a JavaScript software development kit that enables developers to insert a small amount of code in their application to track, for example, how many times an application failed. The Specto tools will take those observability capabilities to a deeper level by enabling developers to analyze a wider range of metrics collected, said Desai.

    Of course, DevOps teams are already collecting metrics, as well. Sentry has worked with partners such as GitLab and GitHub to provide a plug-in that makes it possible for DevOps teams to see the same metrics that developers are now using to manage applications. The goal is to make it easier for developers and IT operations teams to collaborate around a common set of metrics, said Desai.

    The rate at which responsibility for the management of applications is being shifted left, of course, varies widely. Some organizations continue to prefer to have developers mainly focus on writing code. However, Desai said Sentry is encountering more instances where site reliability engineers (SREs) are providing Sentry tools to developers as part of an effort to provide them with more insight into how their applications are running in a production environment.

    Historically, IT operations teams have relied on application performance management (APM) platforms to manage IT operations. Those platforms are now evolving into observability platforms that promise to provide more context by correlating events as they occur across both applications and IT infrastructure platforms. That approach, however, typically requires developers to insert agent software into their applications. Once inserted, that agent software needs to be maintained and updated within the context of a larger DevOps workflow.

    The Sentry approach provides developers with a tool for collecting data from an application that, after being embedded in the application, consumes just tens of kilobytes of memory. That approach eliminates the need to rely on much larger agent software to achieve observability.

    Regardless of how developers go about instrumenting their applications, the overall state of observability clearly needs to improve as application environments become more complex. The issue now is determining how best to achieve that goal in a way that benefits both developers and DevOps teams alike.

  • Sumo Logic Extends Observability Reach to AWS Lambda

    Sumo Logic Extends Observability Reach to AWS Lambda

    At the AWS re:Invent conference this week, Sumo Logic announced that in addition to collecting log data, metrics and traces, it now can collect telemetry data from the Lambda serverless computing service provided by Amazon Web Services (AWS).

    In addition to collecting telemetry data, Sumo Logic also revealed that the Sumo Logic Continuous Intelligence Platform hosted on the AWS cloud can now analyze how functions used on the AWS Lambda service perform during transactions.

    That data can then also be correlated against the performance of other AWS services that Sumo Logic tracks via integrations with the AWS CloudWatch and AWS CloudTrail monitoring services.

    George Gerchow, chief security officer for Sumo Logic, said the company is making extensive use of the OpenTelemetry agent software created under the auspices of the Cloud Native Computing Foundation (CNCF) to make it simpler to instrument IT environments. That data is not only being used to improve application performance but also to surface anomalies indicative of a security breach, he added.

    As part of this ongoing security effort, Sumo Logic this week also added Sumo Logic AWS Quick Start integrations for rapid access to security and compliance insights along with support for Amazon Inspector, a vulnerability management service provided by AWS.

    AWS this week named Sumo Logic as its independent software vendor (ISV) partner of the year. The two companies have a longstanding relationship that began with Sumo Logic’s decision more than 10 years ago to build a monitoring platform hosted on the AWS cloud.

    As IT monitoring tools continue to evolve into observability platforms, Gerchow said it’s becoming much easier to leverage machine learning algorithms and open source agent software to identify the root cause of an issue before it results in a major disruption.

    Most IT teams today are still relying on legacy monitoring tools that only tack a set of predefined metrics to identify when a specific platform or application is performing within expectations. The metrics tracked generally focus on, for example, resource utilization. In contrast, observability combines metrics, logs and traces—a specialized form of logging—to instrument applications in a way that makes it simpler to troubleshoot issues.

    Observability, of course, in one form or another, has always been a core tenet of DevOps best practices. Initially, DevOps teams focused on continuous monitoring as the most effective way to proactively manage application environments. However, it can still take days (and sometimes weeks) to discover the root cause of an issue. Observability platforms promise to make it easier to manage IT environments even as the overall complexity of those environments continues to increase.

    It’s not clear at what rate IT organizations will be transitioning to observability platforms. However, it generally takes only one major outage before IT organizations start looking for better tools to manage their IT environment. As those IT environments become more complex, the probability that there will be a significant disruption is now higher than it’s ever been. The challenge and the opportunity is to find a way to instrument applications more widely; the expectation being that an observability platform will be able to analyze telemetry data to reduce the number of issues that lead to service disruptions.

  • Logz.io Extends Open Source Observability Platform

    Logz.io Extends Open Source Observability Platform

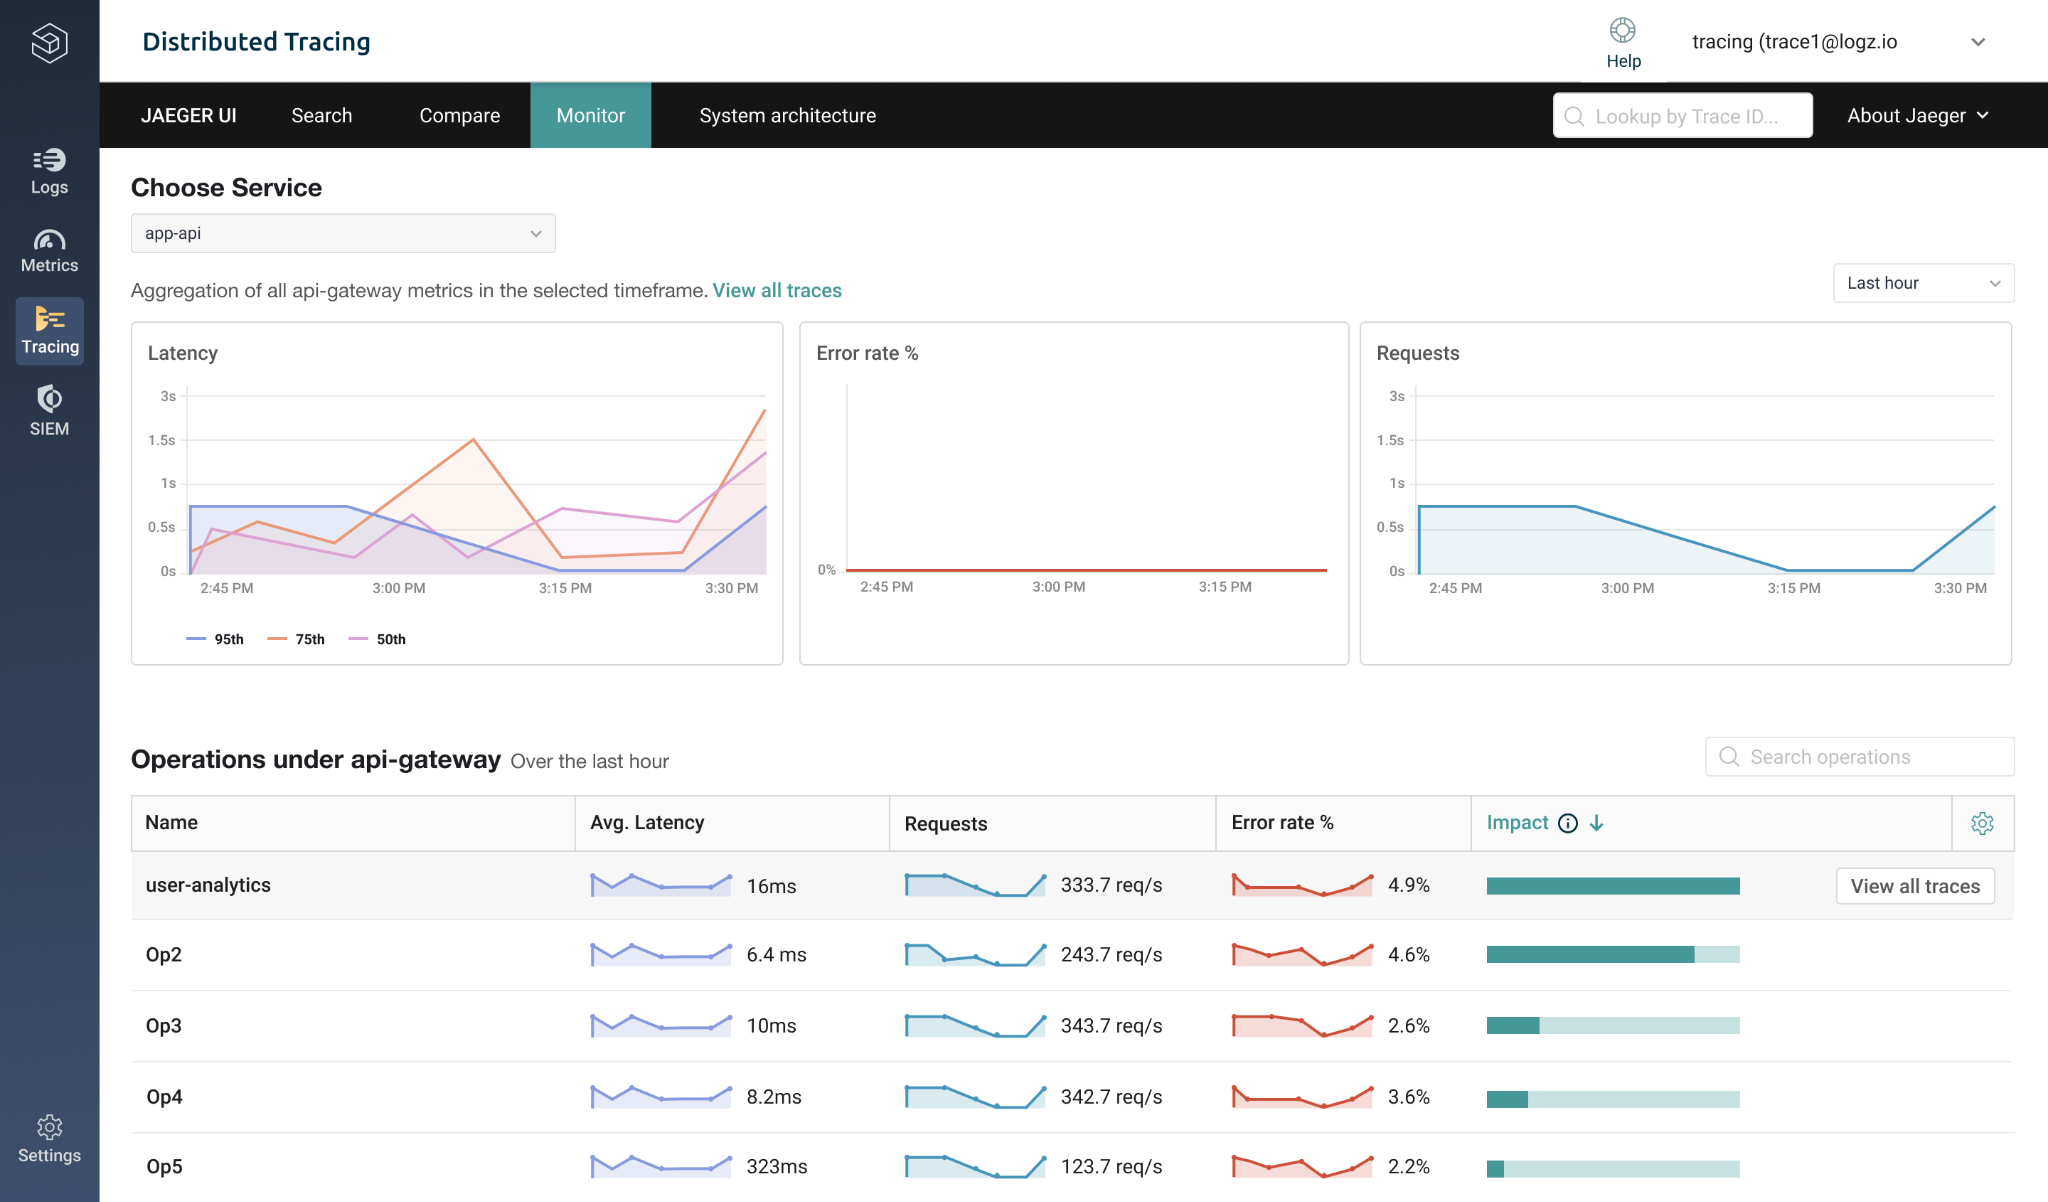
    Logz.io has enhanced its observability platform to include both unified dashboards and support for distributed tracing to monitor service performance enabled by the open source Jaeger agent software being advanced under the auspices of the Cloud Native Computing Foundation (CNCF).

    At the same time, Logz.io is making available a preview of an anomaly detection capability that leverages machine learning algorithms to build an artificial intelligence (AI) model to monitor data.

    The company has also added support for OpenSearch, a fork of the open source ElasticSearch software project that is no longer available via an Apache license. OpenSearch was created by Amazon Web Services (AWS) and Logz.io as an alternative search engine.

    Finally, Logz.io has added a security event management capability that makes it easier to classify, prioritize and collaborate on mitigation of cyberattacks as they are discovered.

    The Logz.io observability platform is entirely based on open source software. In addition, the company has made contributions to enhance both Jaeger and the OpenTelemetry project, including contributing an OTEL Span Metrics Processor that makes it easier to aggregate metrics.

    Logz.io CEO Tomer Levy said that, in general, it’s still early days as far as observability is concerned. As a concept, observability traces its lineage to linear dynamic systems. Observability at its most basic level measures how well internal states of a system can be inferred from knowledge of its external outputs. The overall goal is to make it easier to query machine data in a way that enables DevOps teams to proactively discover the root cause of issues before they cause further disruption. That’s a major advance over monitoring platforms that typically only provide predefined metrics to identify when a specific platform or application is performing within expectations. The issue, however, is most IT teams really don’t know what questions to ask to take full advantage of an observability platform, said Levy.

    However, as more organizations are exposed to observability platforms, it will become easier to advance both DevOps and DevSecOps as more platforms continue to leverage AI to provide remediation capabilities and automate processes based on the massive amounts of data collected via these platforms, said Levy. There is simply no way the average IT team will be able to manage all the microservices being strewn across a distributed computing environment without the aid of an AI model trained using observability data, he added.

    As DevOps continues to evolve, it’s more than likely that the best DevOps engineers are not going to want to work for organizations that have not invested in some form of observability. The odds of being consistently successful as a DevOps engineer decline sharply as IT environments become more complex.

    On the plus side, it should soon become a lot easier as the overall level of application instrumentation increases to manage those complex environments and to do so at a level of scale that doesn’t require a small army of DevOps engineers.

  • Top 10 DevOps Things to Be Thankful for in 2021

    Top 10 DevOps Things to Be Thankful for in 2021

    Thanksgiving has been observed in the U.S. since 1861 and was officially designated as an official holiday in 1863 by president Lincoln. Of course, the tradition itself traces its lineage to the early days of the Pilgrims.

    This past year, of course, has been one of recovery from a pandemic that caused the deaths of millions of people around the world. Vaccines have saved the lives of countless more, so there is much to be thankful for despite all our recent trials and tribulations. In that spirit, there are more than a few things for DevOps professionals, in particular, to be thankful for this year starting with:

    Digital business transformation: Organizations of all sizes have had to adjust their business models because of both major changes in buyer behavior and an ongoing supply chain crisis. DevOps teams are at the core of any major digital business transformation initiative, so the demand for DevOps expertise continues to outstrip the available supply. Going forward, it’s been predicted we’ll see more digital transformation in the next 10 years than in all the last 40 years combined. The vast majority of those initiatives would never see the light of day if it were not for the expertise of developers and engineers working hand-in-hand to build and deploy applications faster than ever.

    Low-code platforms: As the demand for applications to drive digital workflows spiked in the wake of the pandemic, professional developers relied more on low-code platforms to decrease the time required to build an application. While many complex applications will still be built using procedural code, it’s clear not nearly as many applications could have been deployed without relying on low-code platforms to build them. It remains to be seen how many of the next generations of low-code applications will be built by so-called citizen developers that may soon be flooding DevOps pipelines with application code.

    Microservices: As an architecture for building applications the core concept of employing loosely coupled services together to construct an application goes all the way back to when service-oriented applications (SOA) were expected to be the next big thing in the 1990s. Microservices have, of course, been around for several years themselves. However, with the rise of containers as a software artifact for building microservices, it’s only now becoming apparent that building an application constructed using microservices not only takes less time but is easier to maintain and also more resilient.

    Observability: As a concept, observability traces its lineage to linear dynamic systems. Observability in its most basic form measures how well the internal states of a system can be inferred based on knowledge of its external outputs. In the past year, a wide range of IT vendors introduced various types of observability platforms. These make it easier for DevOps teams to query machine data in a way that enables them to proactively discover the root cause of issues before they cause further disruption. That’s a major advance over monitoring platforms that typically only provide predefined metrics to identify when a specific platform or application is performing within expectations.

    Biden’s executive order: In the wake of a pernicious attack against IT service management software from SolarWinds, the Biden administration published a sweeping executive order that requires federal agencies to implement a wide range of security best practices. Foremost among them is guidance concerning the security of software supply chains; which resulted in many organizations reviewing their entire software supply chain to make sure similar breaches will not occur.

    DevSecOps: As an extension of any DevOps best practice, DevSecOps generally describes an overall shift left in terms of making developers more responsible for application security. While still in its relative infancy, DevSecOps is starting to gain traction as DevOps and cybersecurity teams look to bridge a cultural divide that is as wide as any in IT. The ultimate goal is to deliver more secure applications without reducing the speed at which they are being built and deployed.

    GitOps: At its core, GitOps is an operational framework that takes DevOps best practices used to automate application development and extends them to infrastructure. The basic idea is that the configuration software created to manage infrastructure-as-code is just another software artifact to be stored in a Git repository. The approach provides a means for IT teams to achieve a continuous delivery goal that, more than a decade after DevOps best practices were defined, remains elusive. It’s still early days as far as GitOps best practices are concerned, but this has been the year when GitOps become part of the mainstream DevOps conversation.

    Kubernetes: Simultaneously one the most powerful and most complex IT platforms ever to come down the proverbial enterprise IT pike, Kubernetes has emerged as a de facto standard for building and deploying container applications that can more efficiently scale up and down as required to consume IT infrastructure. The challenge (and the opportunity) now is to make Kubernetes much more accessible to mere mortal IT administrators that typically don’t have the programming skills of a site reliability engineer (SRE) and which are both hard to find and retain.

    GraphQL: Employed as a query language for application programming interfaces (APIs), GraphQL provides a more efficient means of accessing data than the REST APIs that have been employed by developers in the past. Originally developed by Facebook, GraphQL adoption is still in its infancy but it’s clear APIs based on GrapQL will one day be as plentiful as REST APIs. That’s especially critical for microservices-based applications that rely on APIs to access data across a highly distributed computing environment that requires a more efficient means for transferring data.

    Venture and Wall Street capital investments: Investment firms are helping fuel DevOps advances as they continue to make capital available for companies vying for their share of a market that is expected to see compound annual growth rates of 24.7% through 2026. There will, of course, eventually be a wave of consolidation as merger and acquisition activity inevitably ensues. In the meantime, however, there is a wide range of DevOps technologies that might not otherwise be as broadly adopted if it were not for all the cash being poured into DevOps companies.

    The most important thing, of course, is that so many DevOps professionals are still here to build and deploy applications. It’s been a trying year for all concerned; however, as the pandemic crisis continues to recede, we can all be thankful for the opportunities that lie ahead.

  • LogicMonitor Introduces Unlimited Log Data Retention

    LogicMonitor Introduces Unlimited Log Data Retention

    LogicMonitor today announced it will provide an option that allows IT organizations to retain an unlimited amount of log data on its software-as-a-service (SaaS) platform.

    Tej Redkar, chief product officer at LogicMonitor, said one of the issues that is holding back advances in observability is the cost of storing log data. LogicMonitor has decided to remove that issue by allowing IT teams to store log data on its LM Logs service for as long as they require, Redkar said.

    That data will also always be readily available as hot storage with no need to wait for data that has been stored offline to be rehydrated, he noted. Instead, that data is readily accessible alongside the metrics and distributed tracing data that LogicMonitor also collects, said Redkar.

    In general, LogicMonitor is making a case for centralizing observability for the entire IT organization via a SaaS platform infused with machine learning algorithms that automatically surface anomalies in real-time based on millions of events captured via log data. The issue many organizations encounter today is silos of decentralized observability data that are more complex to maintain while providing less visibility at a higher total cost, said Redkar.

    The LogicMonitor platform, in contrast, is designed to be equally accessible to, for example, a network operations team as it is to a DevOps team, he noted.

    Not every organization needs to store log data forever, but Redkar said as IT management continues to evolve, more organizations are moving toward storing metrics, traces and logs for longer periods of time. The rise of open source agent software is also making it less costly for organizations to capture that data in the first place.

    It’s not clear to what degree other providers of observability platforms will provide unlimited retention of data, but as the cost of storing data in the cloud continues to drop it’s apparent that billing IT organizations for storage costs is becoming untenable. There is always going to be some cost associated with storage, but it’s not enough to charge extra beyond the core cost of the service. The only thing accomplished by billing separately for storage is discouraging IT teams from storing the data required to both attain observability and better train the machine learning algorithms that surface anomalies.

    Observability, in one form or another, has been a core tenet of DevOps best practices for years. Initially, DevOps teams focused on continuous monitoring as the most effective way to proactively manage application environments. Observability platforms infused with machine learning algorithms make it possible to correlate events so that analytics tools can more easily identify anomalous behavior in real-time. Armed with those insights, it becomes a lot simpler for IT teams to resolve issues faster.

    In fact, there may even come a day when the so-called “war room” meetings that are convened to identify the cause of an IT issue via a painstaking process of elimination are no longer required. In the meantime, however, the total number of IT incidents that actually lead to disruption should steadily decline, even as IT environments become more complex.

  • Data Theorem Adds Runtime Protection Enabled by Observability

    Data Theorem Adds Runtime Protection Enabled by Observability

    Data Theorem, Inc. this week added an Active Protection offering to its portfolio of application security services that makes it possible for DevOps teams to embed observability and runtime defenses in their applications via a software development kit (SDK).

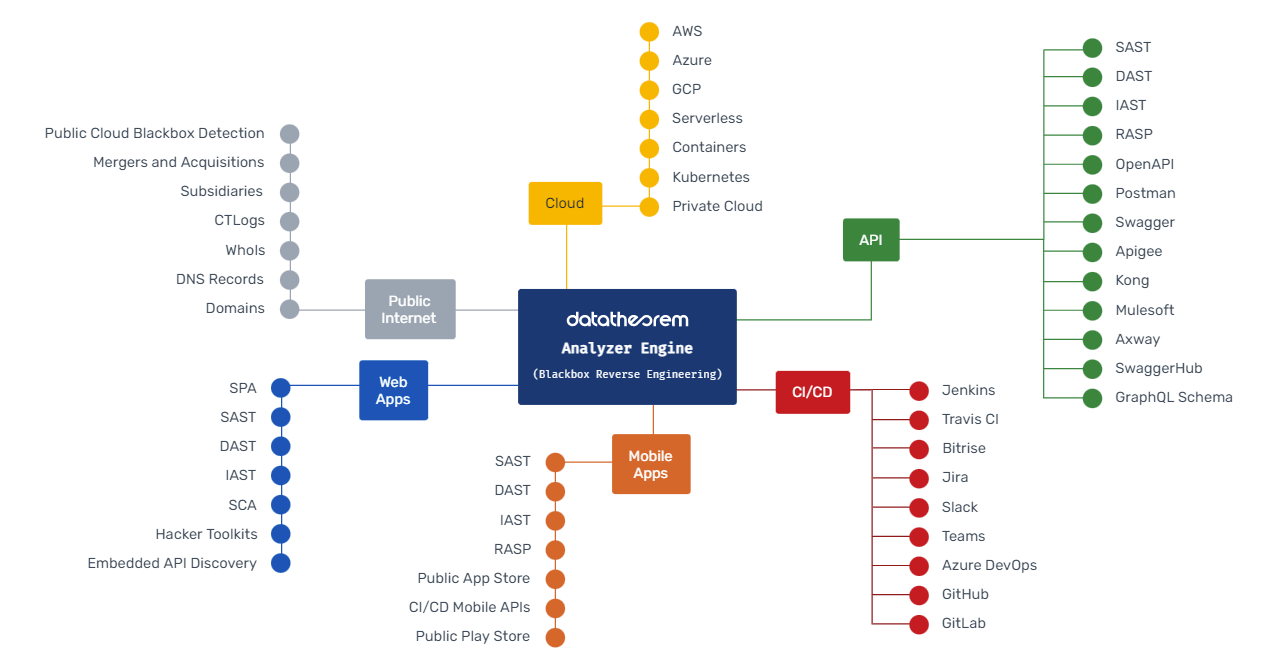
    The Data Theorem cloud services are based on Trustkit, an open source framework the company created to make it easier to employ secure socket layer (SSL) to encrypt connections and Analyzer Engine, its runtime analytics engine.

    The company is now extending its services to make it possible to embed observability capabilities by collecting logs and traces. Those logs and traces are then used to enforce runtime security policies that protect applications from known attacks from malicious sources and other common attack vectors as defined by the Open Web Application Security Project (OWASP) Foundation. It also prevents violations of encryption levels, authentication types and authorization rules along with a variety of custom rule checks, including preventing broken object-level authorization (BOLA) attacks.

    Doug Dooley, Data Theorem COO, said Active Protection can be applied across any application stack, including microservices applications based on cloud-native frameworks. In contrast, existing approaches to securing application runtimes based on web application firewalls (WAFs), runtime application self-protection (RASPs) or endpoint detection and response (EDR) agents cannot be applied to cloud-native applications based on containers and serverless computing frameworks.

    Active Protection solves that issue because it is designed to be applied via the Data Theorem software development kit (SDK) or using application extensions made available via a serverless computing framework or as a container sidecar.

    Dooley noted that the Active Protection service is also designed to be fully integrated with DevSecOps workflows that are increasingly being driven via continuous integration/continuous delivery (CI/CD) platforms to enable continuous, automated security inspection and remediation. The company claims to have detected more than one billion application incidents and is currently used by more than 8,000 applications.

    Developers don’t generally set out to build and deploy insecure applications. The issue is most developers don’t have a lot of security expertise, so it’s easy for mistakes to be made. Organizations looking to embrace DevSecOps best practices need to find a way to achieve that goal in a way that developers can easily embrace. The more automated the checks for security issues become during the application development process, the more likely it is developers will make additional efforts to remediate vulnerabilities long before an application is ever deployed in a production environment. In effect, DevSecOps is easier to achieve when addressed from the bottom up rather than via an edict from above without any real implementation plan in place.

    It’s still early days as far as DevSecOps is concerned, but as best practices for DevOps continue to evolve, there may come a day when security is just another gate that needs to be passed within the context of a larger DevOps workflow. In the meantime, DevOps teams and cybersecurity teams should put aside their differences and work together as the number of attacks launched against applications increases.