Tag: observability

  • Survey Surfaces Observability Challenges in the Cloud Era

    Survey Surfaces Observability Challenges in the Cloud Era

    A recent cloud observability survey found nearly two-thirds (64%) of respondents reported the adoption of public clouds has made it more difficult to achieve observability. Nearly half of respondents (48%) said they now consider providing real-time insights into application/infrastructure environments to be a top priority.

    The survey polled 357 IT professionals and was conducted by Enterprise Strategy Group (ESG) on behalf of Yotascale, a provider of cost optimization tools for cloud computing environments.

    Yotascale CEO Asim Razzaq said that attaining and maintaining observability becomes more challenging with each new cloud platform adopted. The survey found that 71% of organizations now rely on more than three cloud infrastructure providers.

    A full 84% of survey respondents also noted that tracking costs and cloud cost allocation is burdensome and time-consuming, and 61% admitted they lacked sufficient visibility into which teams own what cloud resources. Nearly a quarter (24%) are considering making changes to their monitoring and observability practices as infrastructure costs rise.

    Observability has always been a core DevOps tenet, but achieving and maintaining it is challenging. Most DevOps teams today aspire to be able to maintain some level of continuous monitoring. However, as it becomes easier and less costly to instrument applications, interest is rising in observability platforms that simplify the investigation of anomalies indicative of an issue that could disrupt an application environment. As that shift occurs, more organizations will seek to correlate events with costs as part of an effort to rein in the costs of IT, said Razzaq.

    In the immediate aftermath of the COVID-19 pandemic, the number of workloads being deployed on public clouds increased sharply. In theory, many organizations signed enterprise licenses that reduce cloud costs if they consistently consume a certain level of infrastructure resources. In practice, however, individual developer teams are showing a preference for one cloud platform over another based on the attributes of their workloads. As a result, however, it becomes more challenging to not only consistently observe diverse platforms but also to control costs.

    It’s still early days as far as the adoption of observability platforms is concerned, but it’s apparent that as application environments become more complex the plethora of monitoring tools that DevOps teams rely on will need to be streamlined. It’s not uncommon for DevOps teams to have multiple monitoring tools that surface a set of pre-defined but often conflicting metrics. Observability platforms unify logs, metrics and traces in a way that makes it simpler to launch queries to identify the root cause of an issue.

    The rate at which DevOps teams will embrace observability will naturally vary. In 2022, the biggest obstacle might not be the technology as much as it is simply understanding what queries can help DevOps teams better understand the root cause of an IT issue before there is a major disruption. In the long term, it’s expected that machine learning algorithms will leverage the data collected by observability platforms to automatically identify issues that might lead to a disruption long before it actually occurs. Regardless of approach, however, the ability to manage complex IT environments in the months and years ahead will continue to steadily improve.

  • ServiceNow Launches Incident Management Platform Infused with Observability

    ServiceNow Launches Incident Management Platform Infused with Observability

    ServiceNow added an incident management platform based on the Lightstep observability platform it acquired last year to its software-as-a-service (SaaS) portfolio.

    Ben Sigelman, general manager of Lightstep at ServiceNow, said Lightstep Incident Response gives DevOps teams access to observability tools that, via a self-service portal, enable them to determine the root cause of any incident much faster. It combines the ability to orchestrate on-call escalation, alert grouping, incident analysis and remediation with a set of collaboration and incident management tools.

    That approach will make the Lightstep observability platform much more accessible via a cloud service, noted Sigelman. The Lightstep observability platform itself is based on a time-series database capable of processing one trillion events each day.

    Lightstep Incident Response manages an organization’s on-call rotations by synchronizing schedules via a shared calendar, with specific tags that indicate who needs to be looped in based on the nature of the incident and the service that is impacted. Team members are invited to a dedicated channel based on prebuilt collaboration integrations for quick remediation. Over time they can create automated processes that self-triage and self-remediate problems as they reoccur. The platform also integrates with monitoring, observability and collaboration tools such as LogicMonitor, Postman, Slack, Sumo Logic and Zoom.

    Lightstep Incident Response is generally available now in both free and paid versions. Pricing is based on the use of active services being managed rather than by seat license.

    Lightstep Incident Response also natively integrates with the Now Platform that ServiceNow created for IT service management (ITSM). That integration will enable organizations to more easily meld ITSM and DevOps workflows, noted Sigelman.

    Observability platforms aggregate the collection of logs, metrics and traces in a way that makes it possible for DevOps teams to query that data. The goal is to make it easier for DevOps teams to identify anomalies that might disrupt an application environment. Those same tools, however, also allow DevOps teams to identify the root cause of an IT incident much faster. Today many organizations routinely convene “war rooms” that require IT teams to painstakingly identify the root cause of an issue by a process of elimination; this can take days—sometimes even weeks—to complete.

    With more applications becoming instrumented—thanks, in part, to the availability of open source agent software—Sigelman said observability platforms will play a critical role in helping to automate incident management processes. Prior to being acquired by ServiceNow, Lightstep team members played a role in the creation of both the OpenTracing and OpenTelemetry open source projects for collecting traces, metrics and logs. Today, OpenTelemetry is a sandbox-level project being managed under the auspices of the Cloud Native Computing Foundation (CNCF).

    With the deployment of more microservices-based applications, the percentage of applications that are instrumented will soon increase substantially. It’s not feasible to manage these highly distributed applications without some level of instrumentation. The issue now, of course, is determining to what degree to also instrument many of the monolithic applications that are already running in those same environments.

  • Best Practices for Modernizing App Modernization

    Best Practices for Modernizing App Modernization

    Modernizing legacy systems to embrace a loosely-coupled microservices architecture is the biggest predictor of success for continuous delivery, according to Google Cloud’s 2021 Accelerate State of DevOps report. Studies continue to show that the most elite DevOps performers enjoy more frequent code deployments, faster lead times to deploy, low change failure rates and faster time-to-recovery. 

    Leading enterprises like Netflix, Tesla and Starbucks proved that a microservices architecture minimizes fine-grained dependencies between services, which can then be independently tested, deployed and scaled. Combined with DevOps best practices, this reduces technical debt and allows for modernization based on a factory model approach that incorporates automated analysis and deep observability. 

    That said, application modernization to date has been a manual process requiring multi-year projects that suffer a high failure rate. How can we apply modern tools, known DevOps best practices and desired business benefits to improve and accelerate a company’s modernization efforts? In other words, how do we make modernization more modern? 

    By using automation, AI and data science, building repeatable pipelines and shifting architecture left, architects can get in front of technical debt before it becomes unmanageable. In this article, we’ll explore these practices in more detail.

    Intelligently Automate Everything Possible

    DevOps methodologies have taken manual steps and applied automation to create repeatable processes that scale. Modernization teams today are in dire need of these methodologies, as they are stuck with manual approaches that don’t scale across an entire application estate. Thus, applying intelligent automation, AI and data science to modernization—and creating a repeatable pipeline for refactoring—is a natural extension of DevOps successes over the last decade.

    Continuous Integration, Continuous Deployment, and Continuous Modernization

    CI/CD methodologies are a core best practice for DevOps teams and are already familiar patterns that development organizations are using for their application life cycles. But, there is no continuous delivery without continuous modernization. Elite teams continuously monitor technical debt accumulation and address it at every application release cycle, thereby implementing continuous modernization in their application life cycles.

    Deep Application Observability

    Observability, defined as monitoring, logging and tracing, is a foundation for cloud-native architectures. Modernizing an existing monolith requires deep observability beyond simple static code analysis to include deeper domain-driven behavior analysis and dynamically tracking dependency interactions. This is also the secret to uncovering dead code that is no longer used.

    Ensure Architectural Parity

    You must understand your infrastructure architecture to inform your application architecture and your modernization options. Lift-and-shift causes headaches for many organizations because the traditional three-tier architectures of monolithic applications have a completely different topology than cloud-native applications, which are designed from scratch to leverage the efficiencies of the cloud. 

    Whether it’s a hybrid approach (part on-premises, part cloud), public or private cloud, it’s important to ensure that your modernization strategy ensures architectural parity between the target application and its ultimate destination in the cloud. Also, it’s important to understand your modernization options: Rehost, replatform, refactor, rewrite, etc. What can you lift-and-shift and what needs more attention? 

    To find the answer, incorporating data science-driven analysis, automated service extraction and, more importantly, people, to help you understand the possibilities is critical. 

    Get Executive Support for Your Modernization Project

    This isn’t about simply churning through your backlog; your executive sponsors for a project of this scope need to understand, in business terms, why this is crucial for the organization. There are plenty of metrics showing the financial and opportunity costs of maintaining mission-critical applications that are aging and problematic. 

    To get executive buy-in for your modernization initiatives, you need to formulate a business case that communicates the cost of maintaining the legacy apps, both in time and resources to maintain, but also the negative impact on innovation, customer acquisition and retention and speed to market.

    DevOps practices emerged to improve how IT organizations reliably and efficiently deliver software from development to operations and out to customers. Applying these emerging technologies of automation, pipelines and deep observability to application modernization initiatives will enable teams to accelerate how they deliver application transformation projects. By investing in training application teams in these methods and providing modern tooling to support that training, organizations more reliably and more efficiently move both people and projects forward into the next generation of cloud applications.

  • Service Level Objectives – Techstrong TV

    Service Level Objectives – Techstrong TV

    Service Level Objectives (SLOs) are being more widely discussed as they provide a clear path to delivering exceptional results by defining clear reliability goals. Kit provides updates on the community, use cases and best practices. The video and a transcript of the conversation are below.

    Recording:              This is Digital Anarchist.


    Alan Shimel:            Hey everyone. Welcome to another Techstrong TV segment. I’m really happy to have my friend Kit Merker all done up in his Seattle Kraken hat and his winter beard for the pacific northwest up there joining us today. Ken of course is the COO of Nobl9, a recent winner of the devops dozen awards as best new company on the devops space. Hey Kit. Welcome to Techstrong TV.


    Kit Merker:             Hey Alan. Great to see you.


    Shimel:            It’s good to see you again my friend. I’m thinking Kit we may actually see each other in person soon. I’m hoping.


    Merker:             Wouldn’t that be great? Hopefully somewhere sunny and I can get rid of the beard.


    Shimel:            Well I’ll tell you. I was just looking at airfare for Valencia, Spain for Cube Con in May. I don’t know if you guys are planning on being there for that one, if that’s like a CNCF thing you go to or what or – actually we have a road show coming up in Seattle at some point. I’m not sure when. We’ll talk about that.


    Merker:             Well in May I’m not sure about Cube Con but we will be having SLO Con and we’re doing it online again this year in May so that’s what I’m looking forward to.


    Shimel:            Yes. I think I saw that. What are the dates?


    Merker:             It’s May 9th through 12th. And that will be completely online and asynchronous and attend while you work just like last year. So we’ll have tons of speakers and all the fun from last year that we had and hopefully even bigger. The CFP is open right now so if you go to slowconf.com you can submit a talk. And it’s going to be exciting. And you guys covered the, were a media sponsor last year so hopefully we’ll have you back.


    Shimel:            Yes, we were.


    Merker:             Not to put you on the spot.


    Shimel:            I remember. We’ll talk about it.


    Merker:             All right.


    Shimel:            So that works out well because I think Cube Con if I’m not mistaken is like May 16th.


    Merker:             Yeah. We intentionally didn’t put it the same dates so.


    Shimel:            Yeah. So that will work. Cool man. Let’s talk a little Nobl9 though.  I guess we really shouldn’t. I’m assuming everyone knows who Nobl9 is. But I forget you’ve still only been around two, what, two, three years and at most. And not everyone may be familiar. Why don’t we back up and start there?


    Merker:             Sure.


    Shimel:            Tell people about Nobl9.


    Merker:             Of course. Yeah. So Nobl9 we make a service level objective platform, SLOs. And the whole idea of SLOs is about measuring your observability system and bringing new context, shared context so that you can make better decisions and better automation within your organization. So if you think about how you’re pulled in all these different directions, right? Some people on your team say we’ve got to ship features. Some people say if we don’t make it reliable and perfect then we’re going to hurt our reputation. If we don’t fix our tech deck we’re going to burn out all of our employees and we’ll have the great resignation to deal with. They’re all getting pulled in all these different directions.


    And what’s interesting about this is that we have actually more data about our software than we’ve ever had before. We have source control. We’ve got our AWS Cloud. We’ve got our Kubernetes cluster. We’ve got all these observability tools. We have so much data and yet we come to these different conclusions about what we should work on. And this is a big problem for so many organizations. So what Nobl9 is doing is we’re bringing some additional context. This is what’s really missing is people need to understand in an organization what are the risks to the system. What are the expectations that customers have and what are the tradeoffs we have to make in order to deliver the right kind of service to our customers?


    So what we’re doing with service level objectives in Nobl9 d is we collect all this observability data, we add this context and we drive automation and decisions so that whether you’re on call, you’re planning your future roadmap or trying to justify your investments you can see exactly what the impact is on the business and everybody can start pulling in the same direction. And that’s really what we’re doing. And like you said we’ve been around for a couple years. We now have a product in market. We both have kind of an entry level thing called Hydrogen, an enterprise class product that’s being used by some of the world’s largest enterprises and it’s very exciting and we’re having a great time.


    Shimel:            Very cool. Kit when we look over the evolution of the last couple years, right, ‘cause I remember with Nobl9, right, we first thought of it around well this is an SRE kind of thing. Right?


    Merker:             Yeah.


    Shimel:            And SREs early on were inherited a world of SLAs. Right? Where it was perform or a quick bullet to the back of the head will work.


    Merker:             Metaphorically speaking.


    Shimel:            But that wasn’t a very forgiving model or a model that would really kind of foster cooperation and team building and a lot of the principles behind devops, right, about how we get stuff done. It’s very hard to have a blameless postmortem when if you blew an SLA someone’s job is on the line. Right?


    Merker:             Well it’s really interesting because I think definitely in the sort of earlier I would say IT service model, right, where you have SLAs, especially if you have maybe outsource contracts. Right? SLAs became really a form of punishment. Right? One of the interesting things that I learned from sort of the Google SLA model is that there’s an assumption of reliability at Google, an assumption of infrastructure investment that’s not actually there in most enterprises. The SLOs that are prescribed by the SREs in the Google model are really trying to hold back over investment in infrastructure and this sort of gold plate infrastructure problem. Well most companies in the real world.


    Shimel:            It’s the other way.


    Merker:             It’s the other way around. Their issue is they can’t keep up with the reliability needs and the feature pressure is really the issue that they have. And so with this SLO model and being able to define them in fine grained ways across multiple data sources, being able to use it with automation. What changes is that you can start to put guardrails around these different conditions that people care about. You start to model the business. And this is really what we’ve got to get to. It’s about building the technology for digital business because all the businesses are digital now. Right?


    Shimel:            Right.


    Merker:             So you’re point about kind of like how you adopted sort of like devops method and bring this to the table, I mean really devops is trying to get better at building software, become more kind of diligent and efficient and make the right tradeoffs. It’s about ownership, right, a sense of responsibility but not punishment. And I think once people realize – actually I just had this customer from Flexera. We just did this testimonial video together. And he said it’s like once people realize that they weren’t building SLOs to point blame at them or punish them, that we were trying to do it to help them so that the people in the organization could see when they had problems, right, when they needed help.


    Then people really got open to this idea. This to me this is the game changer. If we can help organizations become more transparent, to be able to do more through APIs instead of meetings if you know what I mean. Right? Like using the data and the systems to help make these better decisions. This is what changes culture. A lot of people want to talk about reliability culture and devops culture and agile culture but that’s such a scary idea. The way I like to think about this and what we’ve talked about with our customers and community members is it’s about how you make decisions together. Right?


    And if you can make lots of decisions in a way that is supportive of the strategy, supportive of the business and also the realities of the pressures that we’re on as humans. And let’s not forget that everybody is going through a hard time and maybe not totally happy being on call and all these other things. Taking all that into account and making a decision together this is what becomes culture, not the other way around. Right? You don’t change culture first to get the decisions. You start making good decisions and then the culture emerges from that. And that’s I think a really important idea.


    Shimel:            I agree with you 100 percent. No doubt about it. And it is. But when we focus on devops being about delivering software and clearly that’s the goal. Right? Delivering software better, faster, higher quality. In order to do that you need just that whole culture thing. And some people say oh culture is BS. It’s not. Having a team that works together, having goals that are clearly enunciated, right, we’re all trying to do – you understand what the guy or gal next to you is doing. Right? And why they’re doing it and how you fit into it. That’s all part of that. All of those things help you get software better, faster, higher quality. And that’s where it is.


     What’s interesting about Nobl9 Kit from where I sit, right, because I sit – I mean beyond being on different sides of the continent I sit in a different chair than you. I get to look at the whole market without a horse in the race so to speak. You guys have done a really great job of defining and owning SLOs. Right? I think for a lot of people in the marketplace, right, SLOs aren’t necessarily synonymous with Nobl9. But you’ve probably done more to promote SLOs and their use and why they’re beneficial than anybody else in market.


    Merker:             Well first of all I appreciate that a lot. Personally I think it’s a reflection of the community. I think it’s a reflection of a nerve that we hit at some level. Because to your point, right, goals that are well enunciated and it’s funny to me because I think oftentimes we think of goals as things that are kind of squishy. Right? We set stretch goals – oh sorry. I thought I muted everything.


    Shimel:            It’s never all muted.


    Merker:             We’re all muted. We want to set goals. Sometimes they’re a little squishy is what I was saying. So it’s like maybe you have OKRs. Maybe you have stretch goals. Maybe you have some different perception of what the goal is for your service. And what SLOs are doing is turning it into pretty much the most precise type of goal you could imagine which is code, right? Like actually describing it in code and something that’s checked in where it’s the truth. There’s no arguing about what it is. Now we can change it, right? We can always change our minds about what the goal is. But at any given point in time there is a goal that’s described and there’s a set of actions associated with that goal. And to me this is exactly what is so attractive to people in the market about SLOs because they’re no longer guessing.


    They’re no longer sending each other Slacks and emails and writing documents and putting it in dashboards. They have a very precise way of describing what they want and expect from their service that takes in account the risks and tradeoffs and customer expectations that they have for the service and then allowing the team to engineer to that goal, allowing the business to understand the tradeoffs. Right? Hey. If you want the service to be faster we’re going to have to spend more to buy more computing power. Right? Hey. If you want these features we’re going to have to put these other reliability concerns on hold and vice versa. This is something that brings visibility to all the little engineering decisions that are made on a daily basis and then aggregates them up to the size of an entire enterprise ‘cause it’s birds eye view of how the enterprise functions and doesn’t limit them to a prescriptive way. ‘Cause I think this is one of the other big challenges.


    When I look at the observability space or anybody’s infrastructure space is trying to bring a prescriptive guidance. I think today’s world is about the right tool for the job. Right? You’ve got to fit inside of an ecosystem whether that’s what language you use, what CICD system you use, what package manager you use, what source control you use. All these things are choices that engineering teams have to make for themselves. And you can’t necessarily dictate that Team A and Team B are going to agree on that stack if you will. Right? You give them some flexibility. But what you can get them to agree on is the concept of the service level objective. Like what should my service provide to customers in terms of availability, latency, performance, throughput, whatever the characteristics are that deliver that end to end service.


    This is what becomes almost the contract because if I know that I’m using your service and you’re going to give me x number of latency over y number of nines then I can build my system to account for it. I can decide what my retry strategy is, what my caching strategy is. Right? I can design and engineer a system that takes into account what your service says it’s going to do. Well that level of clarity allows engineering teams to operate in a completely fundamentally different way because now they aren’t guessing and they’re not hoping and they’re not wishing. Right? They’re working toward a clearly articulated goal. And I think this is what’s so important. So now the whole idea of us promoting this concept. I mean we’re just like we’re in love with SLOs. I mean I don’t know how else to explain that. Like we’re just like losing our mind about how amazing it is.


    But it is really about the community. We now have literally thousands of people that are involved in the SLO, the SLO Conf community. We have the monthly meetups. The conference as I mentioned will be in May. And we’re expecting hopefully about 5,000 people to show up this year. Last year we had 2,200 registrations. So we’re pushing hard for this but based on what we’ve seen in the market and the companies that are literally deciding if they’re going to build or buy an SLO platform right now.


    There is a huge groundswell of interest in this concept to take their observability systems, their operation systems, reliability systems to the next level. And all the practices and tools and techniques and tricks everybody wants to share it and learn together which is I think the most exciting thing. And it fits in with so many other areas, incident response and chaos engineering and how we do monitoring and logs. All this stuff kind of fits into this whole story about SLOs. Even finops, right, even like cost management, all this stuff fits into this same story. So yeah. It’s kind of overwhelming to be honest how much the market seems to have appeared and materialized over the last couple of years with SLOs.


    Shimel:            Cool man. Hey Kit, we’re up on the clock here. So you mentioned SLO Con and SLOconf with an F dot com. Right?


    Merker:             That’s right.


    Shimel:            Right.


    Merker:             Yep.


    Shimel:            For people who want to maybe submit a talk or just find out more about attending this year’s virtual conference in early May. And then for people wanting to get more information on Nobl9 is it Nobl9 dot com or IO? I forget.


    Merker:             Nobl9.com. Yeah. N-O-B-L number 9, dot com.


    Shimel:            That’s it. Hey Kit, man. It’s great seeing you. I hope to see you in person sooner than later here. But keep doing what you’re doing man and congratulations on the devops dozen award as well.


    Merker:             Thank you so much Alan and hopefully we’ll catch a hockey game together.


    Shimel:            Come on down. Actually I don’t have Seattle Sounder tickets when they’re playing the Panthers but we’ll look into it. I’ll talk to you later man.


    Merker:             All right..


    Shimel:            Great seeing you.


    Merker:             All right. Take care Alan.


    Shimel:            All right. Bye bye.


    Merker:             Bye.


    [End of Audio]

  • IBM Automation Insights: Improving Observability and App Performance

    IBM Automation Insights: Improving Observability and App Performance

    Observability offers deep visibility into the internal state of complex systems in order to quickly identify and troubleshoot performance issues to keep up with customer expectations and business requirements. Observability enables better application performance monitoring (APM). So, how can DevOps teams gain full observability into modern applications? 

    On Feb. 23, experts from IBM and GitLab will come together at the IBM Automation Insights virtual event to discuss how to effectively observe, manage and maintain applications across platforms and how to improve application performance.

    The virtual event has been curated to create interactive sessions, led by DevOps experts who will deep dive on the latest innovations, conduct demos and share approaches that tackle challenges.

    IBM Automation Insights features a speaker lineup of distinguished engineers, IT leaders and executives, including:

    • Cosmo Schillaci, DevOps business leader at IBM
    • Jennifer Velasquez, Americas DevOps leader at IBM
    • Laurel Dickson-Bull, product manager at IBM
    • Kurt Dusek, senior solutions architect at GitLab
    • Jamie Coleman, software engineer at IBM

    Attendees will learn how Instana and GitLab can enable DevOps teams to accelerate CI/CD pipelines and how to build applications easily using cloud-native Java applications and microservices locally, with containers, and for OpenShift/Kubernetes.

    There will be a cross-platform panel discussion in which attendees will get a chance to interact with the speakers, ask questions on any of the strategies presented and discuss several topics, including cybersecurity, optimization for observability, vulnerability tool proliferation and more.

    For more information and to register, please visit the IBM Automation Insights website.

  • Will Splunk be Gobbled up by Cisco?

    Will Splunk be Gobbled up by Cisco?

    Word on the street is that Cisco and Splunk are in discussions about a possible acquisition. Splunk, the technology monitoring, search and analytics company could be acquired by Cisco—originally a networking company but now a complex hardware and software conglomerate.

    Splunk has generated quite a reputation as a ‘dealer’ over the years. The company, much like a drug dealer, gets you hooked and then, when you can’t live without what they’re selling, makes you pay. The difference is that what they’re selling is insight and visibility into your own data.

    For many years, Splunk’s pricing model was simple—customers paid for the amount of data that was ingested. Splunk didn’t invent this type of pay-for-what-you-use-and-consume model. For mainframe workloads, IBM has long charged clients based on millions of instructions per second, or MIPS. Likewise, the entire cloud computing business model is based on a pay-for-what-you-use model. If, for example, you leave an AWS experimental instance running over the weekend or while you’re a vacation, you’re going to pay for it (many of us have learned that the hard way).

    So why am I picking on Splunk for being a dealer? The whole value proposition of Splunk is that the more data it ingests, the more useful the software platform can be. Splunk can help operations and security teams connect disparate data points to uncover potential emerging problems or greatly reduce the time it takes to resolve an incident. However, to unlock the power, you need to push more and more (and more and more) data into Splunk.

    But here is where Splunk gets down and dirty: Like any dealer, Splunk will give teams free trials and the ability to ingest data from new areas of your business for free. Once a team starts to see the value and is hooked on the software, the Splunk sales team is right there to take your money.

    Splunk now offers other pricing models, but the stigma sticks.

    Splunk Customers are the Company’s Best Salespeople

    Splunk has done an excellent job at creating evangelists out of their existing client base. I’ve attended a lot of vendor conferences, and my experience is that Splunk’s customers are some of the most enthusiastic I’ve ever encountered. What does user enthusiasm tell me about a vendor’s product? It is either that the product is making that employee a superstar within their company or making that employee highly desirable across the broader technology market.

    At Splunk events when I have candid conversations with customers, the adoption pattern follows a fairly standardized script. The IT operations team adopted Splunk. IT operations had a ton of success and shared that with the rest of IT. Security saw ops’ success and wanted to try Splunk out for themselves. In many cases, the cybersecurity use case within the company became the bigger Splunk deployment once the platform’s capabilities were understood.

    So Why Would Splunk Sell?

    Customers like Splunk and they’re obviously seeing value. So, why would a company like that ever sell? Well, first of all, the SIEM 2.0 market vanished; security log data analysis is table stakes. What do I mean by that?

    So Long, SIEM

    The idea of security information and event management (SIEM) hasn’t gone anywhere, but now security vendors need to do more than just SIEM.

    It wasn’t long ago that those of use following the security industry tracked RSA Netwitness, Logrhythm, IBM Qradar, HPE ArcSight, RSA Archer, Carbon Black and other SIEM vendors. The reality is that all of these companies have gone through massive transformations. Those of you reading this article might be surprised by the companies that now own many of these SIEM vendors!

    Splunk is no longer unique in its approach to applying machine learning and artificial intelligence to security log data.

    AIOps—The Company Lost its Focus

    Splunk cut its teeth with operations teams. The company helped ops teams quickly find the root cause of disruptions and spot problems before the pain was felt by customers. However, operations isn’t sexy. Rather than doubling and tripling down on operations, the company expanded to security. It made sense; security organizations deal with huge amounts of complex data.

    However, as DevOps rose to prominence, Splunk has been widely left out of the conversation. DevOps teams need software tools that can normalize data across job function-specific software platforms. This would have been a perfect opportunity for Splunk—however, new competition stepped in to fill this gap.

    The World Evolved—Businesses Need Observability

    SIEM 2.0 was hot—“was” being the operative word. Today, DevOps and DevSecOps teams are looking for observability offerings. Observability tools provide teams with the ability to understand and see what is going on within systems and software from a variety of perspectives. Observability platforms can view system and cloud health and resiliency, but can also give operations teams container-level data.

    Enter the Observability Vendors

    By no means is this a comprehensive list, but my colleagues at Techstrong Research and I have come up with a list of observability vendors you should be paying attention to. Some of these vendors are pure-play observability companies while others, like Splunk, have a variety of offerings.

    •   Splunk
    •   Sumo Logic
    •   Logz.io
    •   StackState
    •   Lightstep (acquired by ServiceNow)
    •   Dynatrace
    •   App Dynamics
    •   VMware – Tanzu
    •   AWS CloudWatch
    •   Azure 
    •   Honeycomb.io
    •   Grafana Labs

    Acquisitions

    •   IBM acquired Instana for observability and Turbonomics for AIOps
    •   Cisco acquired Epsagon
    •   Cisco acquired AppDynamic for $3.7B for application performance management/monitoring
    •   VMware acquired Mesh7
    •   GitLab acquired observability distribution Opstrace 
    •   NewRelic acquired CodeStream
    •   Splunk acquired SignalFX, FlowMill and Omnition
    •   ServiceNow acquired Lightstep

    Within the observability space, there is also a tremendous amount of open source. Many vendors are coalescing around the OpenTelemetry project, for instance, that focuses on collecting data. This type of open source use makes sense—vendors should focus on areas of differentiation and customer value rather than just data collection.

    Open Source related projects

    • Prometheus
    • OpenTracing and OpenCensus from Google (folded into OpenTelemetry)
    • Zipkin (Twitter) one of the first open source tracing projects

    Why Would Cisco Want Splunk?

    Splunk’s stock has been in decline since its CEO left in Q4 of 2021. Like other technology companies, inflation and a general technology sell-off is further impacting its stock price. In addition, the company is transitioning clients to cloud-based offerings, which is often a painful process for public companies (many companies have gone private to eschew Wall Street’s prying eyes).

    Cisco has, historically, occupied the network layer. Splunk understands network data and can offer many benefits to Cisco clients.

     Splunk is an enterprise software vendor that can scale in a non-linear way if Cisco can add stability to Splunk’s leadership and vision.

    Now, will the deal for Splunk get done at $20 billion? No. But a possible acquisition is very possible, especially given the fact that Splunk’s runway is short and getting shorter.

  • Dynatrace Advances Application Environments as Code

    Dynatrace Advances Application Environments as Code

    Dynatrace, at its online Perform 2022 event, launched a bevy of updates to its portfolio that make it easier for DevOps teams to programmatically embed observability and other software intelligence capabilities within applications.

    At the same time, Dynatrace also revealed that it has extended the reach of its observability platform to now include all the major serverless computing platforms.

    Additionally, the company extended its existing Application Security Module to provide the ability to detect vulnerabilities and block attacks against application runtimes in real-time using the framework defined by the Open Web Application Security Project (OWASP). That module is based on Dynatrace Smartscape topology software and a Davis artificial intelligence (AI) engine to provide real-time visibility into IT environments that enables DevSecOps teams to better prioritize which vulnerabilities to remediate first based on their severity.

    Dynatrace CEO Rick McConnell told conference attendees that all these capabilities are enabled by agent software that can be programmatically embedded within applications as code using application programming interfaces (APIs) and templates to automatically surface software intelligence. Rather than having to deploy multiple agents, McConnell said, IT teams can deploy a single agent to drive a wide range of analytics.

    That capability makes it easier for IT organizations to achieve service level objectives (SLOs) for performance, quality, and security at a time when more responsibility for the management of applications is shifting left toward developers, he added.

    It’s not quite clear how far responsibility for the management of applications after they are deployed is shifting left toward developers. It tends to vary widely by organization. The one thing that is certain is more applications are being instrumented. Adoption of application performance management (APM) platforms was previously limited by cost concerns and the challenges associated with embedding agent software in applications. As it becomes easier to instrument applications the data that can be collected and analyzed from logs, metrics and traces are now considerably greater. As such, APM platforms are now being positioned as observability platforms that can correlate analytics collected from applications and the underlying infrastructure upon which they depend.

    Much of that need for greater instrumentation is being driven by digital business transformation initiatives, noted McConnell. Many of those applications are being constructed using microservices that have dependencies on each other. A single agent makes it easier for IT teams to instrument cloud-native application environments, he noted.

    There is no shortage of options when it comes to instrumenting and observing applications. The issue now is turning all the data being collected into actionable intelligence. As a result, observability platforms are being imbued with AI engines that make it possible to analyze massive amounts of data. Armed with those insights, it then becomes possible for an existing IT team to manage a much more complex IT environment at scale. In fact, it’s now no longer a question of whether AI engines will be injected into DevOps workflows as much as it is to what degree.

  • Techstrong Research DevOps Radar Report 2022

    Techstrong Research DevOps Radar Report 2022

    You can’t control the pace of change; instead, consider that we are in a process of reinvention—both with regard to the way organizations use technology and how vendors position their offerings. At the same time, it’s never been more important for IT organizations to have complete visibility into the way technology is used from both a security and operations perspective. 

    This need to embrace reinvention while continuing to have broad and deep insight across all technology platforms led me to create a 2022 DevOps Radar Report. In this article, I highlight three near-term priorities that must be on every technology team’s radar. In addition, I’ll point out some long-range radar trends that should be on your agenda.

    Collision Warning! Your Current Radar View

    API Security

    APIs are the lifeblood of the cloud-native and app-based economies. Increasingly, poor API security across a variety of applications and systems puts your organization at risk. A compromised API or the use of unsupported or outdated APIs can prove to be an easy attack vector for cybercriminals. In addition, API vulnerabilities are calling into question how organizations approach application security and the usefulness of web application firewalls (WAF) and encryption protocols. Therefore, API security is rapidly becoming a top security priority for enterprise security teams and software professionals. 

    Failing to adequately manage the security of APIs creates a host of new challenges and questions that you must consider. For example, who is using which APIs? Are your APIs updated? Did your DevOps team evaluate the security of your APIs during their selection process? Have you formalized the way your organization is evaluating API security?

    It is increasingly clear that an API breach can lead to the downfall of your entire digital software strategy—but it doesn’t have to be this way.

    At Techstrong Research, we segment the market into “pure-play” API security vendors and larger security vendors with specific API security offerings. Our team will be publishing a Market Vista report on the API security landscape soon, so if you want to share your opinion or thoughts, please reach out.

    Below is a brief list of some of the vendors we are tracking in the API security market. Of course, expect consolidation—some of these pure-play vendors will likely be acquired in 2022.

    Pure-play API security vendors we’re tracking include:

    General security vendors with API security offerings that we’re tracking:

    Observability is Evolving to AIOps

    Modern applications are composed of containers and APIs that your organization can’t control, and into which visibility is difficult. Monitoring and application performance management (APM) solutions aren’t new; for many years log vendors built their businesses on collecting log files and sending alerts … so what’s changed?

    First, logs without context are meaningless. You need to understand upstream and downstream dependencies. Additionally, speaking for myself, I’m a mere mortal—if your teams are also made up of mere mortals, there is no way they can ingest, correlate and understand the tsunami of incoming DevOps log data quickly enough to take proactive measures.

    Besides the need to understand context, we are dealing with multiple cloud and on-premises platforms that each have their own logging protocols. Ultimately, the goal of observability and AIOps is to understand what’s happening across and among all these environments and technologies so you can detect and resolve issues as quickly as possible to keep your systems efficient and reliable and your customers happy. 

    Humans are the Biggest Security Vulnerability

    As an industry analyst, I see our clients pouring resources into cybersecurity efforts to prevent zero-day attacks and sophisticated advanced persistent threats (APTs). These threats, while real enough, are mostly external and may not pose as great a threat as many organizations believe. In fact, the vast majority of security vulnerabilities are caused by:

    • Well-meaning employees making innocent mistakes, including:
      • Falling victim to phishing attacks
      • Poor corporate password policies
      • Cloud misconfigurations and open ports
    • Technical debt—relying on older software and hardware that was never designed for a 100% mobile workforce, for example

    The first step in combating this problem is improving security awareness and building a cybersecurity culture. That starts with everyone in your organization understanding that security is a team sport and that it is a 24/7/365 responsibility. Even if you work from home; even when you’re cooking dinner while checking email on your phone, you need to have your “corporate security/Is it safe?” hat on.

    At the same time, machine learning, AI and automation have a role to play. There are emerging offerings that help enforce DevSecOps best practices and help security teams reduce the constant noise so they can focus on the most vital threats.

    Longview Radar: Plan Your Strategy Now

    To support emerging business models, what do DevOps leadership teams need to be thinking about from a long-term perspective?

    • Web3/Web 3.0 and the potential for change to the internet business model. But there is still a ton of opportunity with Web 2.0.
    • How will you support low-code/no-code? As a business model, vendors are selling directly to business units—it’s likely that your IT team has an existing solution to solve the business pain point(s).
    • Packaged software offerings that include blockchain, NFTs and other digital ledger technologies.
    • How to upskill teams, both from a technical perspective and a business perspective.
    • Providing developer teams with the tools they need while establishing guardrails to enforce governance and compliance requirements.
    • How to manage cloud costs in a predictable way no matter how many cloud vendors your organization uses.

    Conclusion: You Can’t Put the Brakes on Change

    Attempting to control change and the speed of reinvention is futile. You need to get comfortable riding the waves of industry change, or you’ll be swept away! Every IT leader needs to learn how to roll with and manage the ebb and flow of business, IT and personnel change.

    The best place to start is by building a successful culture within your organization. Although we often talk about technology-focused solutions to business problems, the first step on this journey doesn’t involve tech at all; it involves helping IT and business teams understand each other’s pain points and learn how they can each support a continual reinvention process.

    I will be tracking these incoming radar targets and other associated trends throughout the year and I look forward to your input. Do you think I missed something? Have a question or want to share what your organization is doing to support the need for continual reinvention? 

    Feel free to engage with me – @DDKirsch, LinkedIn or, of course, email. 

  • GitLab Revamps Observability Strategy After Acquiring Opstrace

    GitLab Revamps Observability Strategy After Acquiring Opstrace

    GitLab plans to make observability a more integrated element of its continuous integration/continuous delivery (CI/CD) platform after acquiring Opstrace.

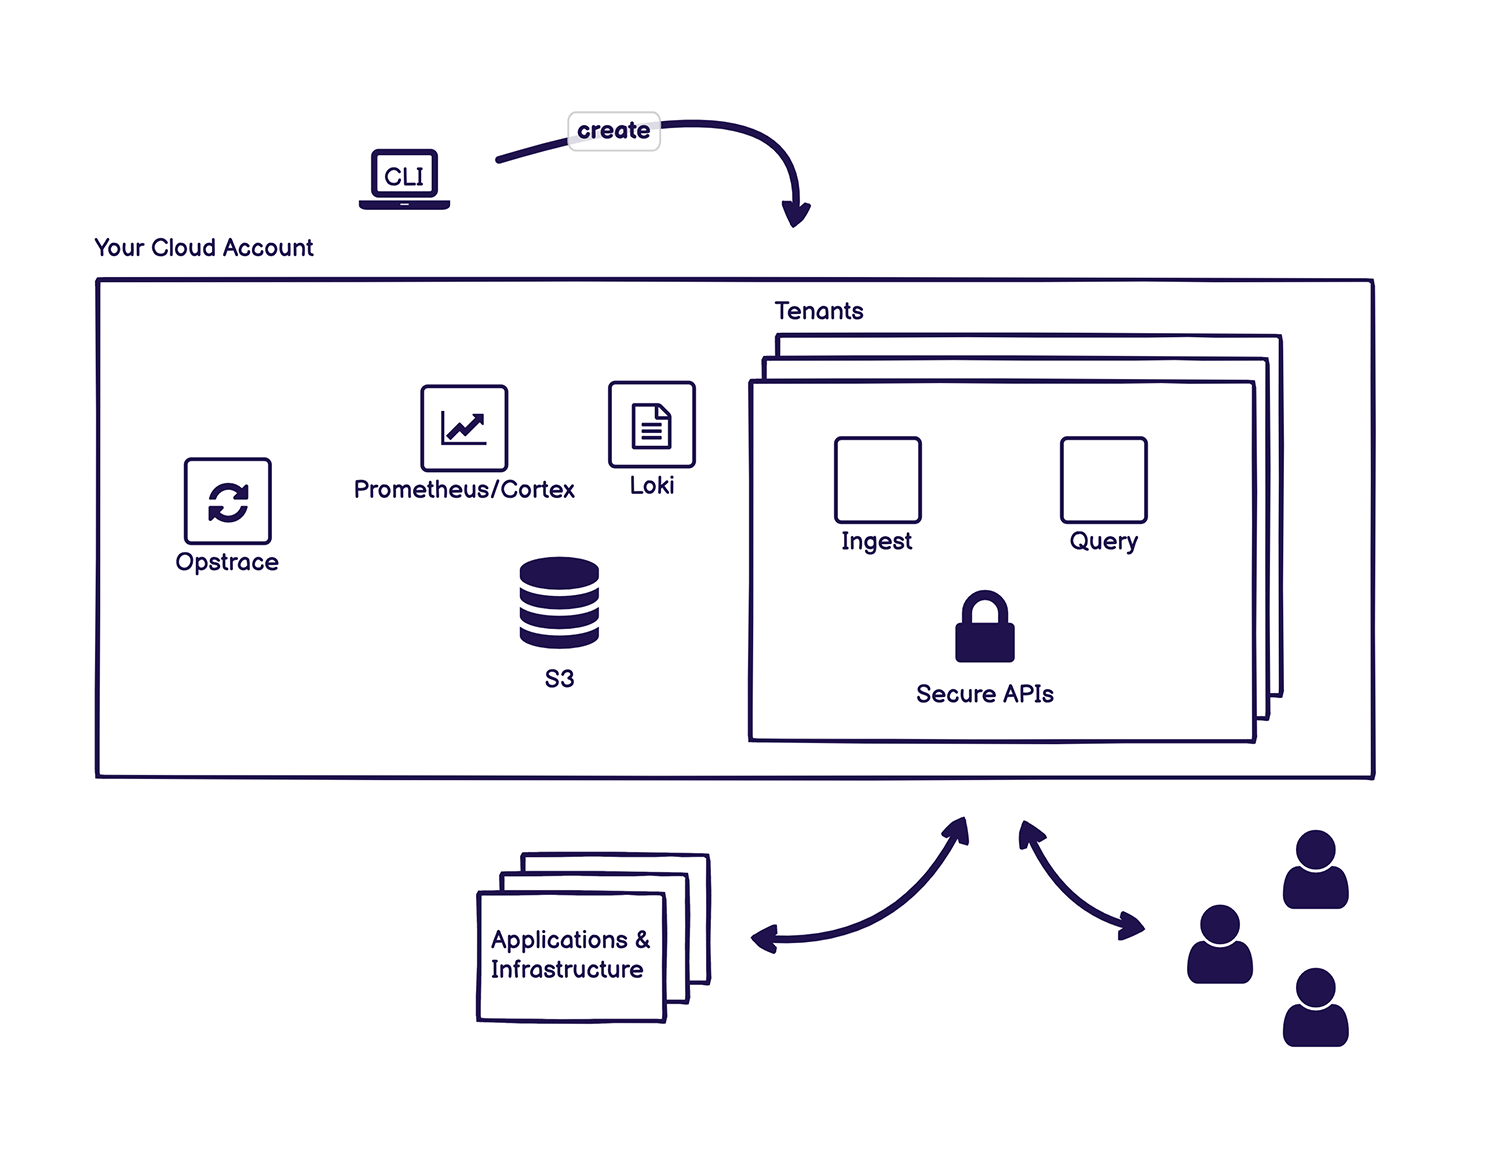
    Opstrace’s open source project exposes a horizontally scalable application programming interface (API) created by Cortex for Prometheus, an open source monitoring platform being advanced under the auspices of the Cloud Native Computing Foundation (CNCF). It then makes use of a Loki API to collect log data.

    DevOps teams can also point an existing instance of Prometheus to Opstrace or any instance of Fluentd or Promtail software they are using to collect log data, with support for a wide variety of other APIs, such as the Datadog agent, planned. A command line interface (CLI) is provided to set an instance of Opstrace that creates a controller through which the collecting of log data is managed.

    Kenny Johnston, senior director for product management for GitLab, said as part of an ongoing effort to make observability more accessible, GitLab plans to integrate Opstrace by default with GitLab Monitor for organizations that use either the self-managed version of GitLab or the software-as-a-service (SaaS) platform.

    Opstrace currently collects logs and metrics and support for distributed traces is planned. The goal is to extend the overall scope of observability capabilities that GitLab already provides within its CI/CD platform, noted Johnston. The goal is to make it simpler for DevOps teams to employ observability capabilities and interrogate data to optimize workflows without acquiring a separate observability platform, he added.

    GitLab is betting that, as Prometheus continues to gain traction, more DevOps teams will prefer to extend its reach into the realm of observability rather than having to manage a separate platform.

    Although observability has always been a core tenet of DevOps best practices, achieving it has proven to be a challenge. At best, most organizations can continuously monitor IT environments based on predefined metrics that identify when a specific platform or application is performing within expectations. Observability combines metrics, logs and traces—a specialized form of logging—to instrument applications in a way that makes it simpler to troubleshot issues without having to rely solely on a limited set of pre-defined metrics that have been created to monitor a specific process or function.

    The rate at which DevOps teams will embrace observability will naturally vary. In 2022, the biggest obstacle might not be the technology as much as it is simply understanding what queries can help DevOps teams better understand the root cause of an IT issue before there is a major disruption. In the long term, it’s expected that machine learning algorithms will leverage the data collected by observability platforms to automatically identify issues that might lead to a disruption long before it actually occurs.

    One way or another, the ability to discern events even within the most complex IT environment is steadily improving. Whether that’s accomplished as an extension of monitoring or by embracing true observability may not be all that relevant—as long as the ultimate goal is achieved.

  • Open Source Observability Comes of Age in 2022

    Open Source Observability Comes of Age in 2022

    Observability is growing in importance to meet envisioned business objectives. Despite the benefits to performance data, organizations have faced challenges in realizing the full potential of observability based on implementation, distributed software tools, and other technological hurdles. But with new innovation, the era of true observability is upon us.

    Innovative changes

    The open-source observability landscape, in particular, is going through a phase of innovation. Powered by distributed tracing “coming of age” with OpenTelemetry, and eBPF taking center stage in terms of restructuring as the next frontier of observability and monitoring on Linux, innovation is at an all-time high. 

    Kernel technology

    Extended Berkeley Packet Filter (eBPF) has presented a fascinating technology native to the Linux kernel. Born with the intent of having a programmable way of dealing with networking, eBPF has evolved into a rather generic and performant facility to have safe, dynamic access to the Linux kernel, that enables, among many other things, to extract telemetry for observability and security purposes. eBPF is powerful and growing in popularity, and Microsoft has been working on a port to Windows.

    Versatility

    In terms of observability, eBPF proved to be remarkably versatile in 2021. For example, there are tools that use eBPF to perform distributed tracing, like the Pixie project that was open-sourced in mid-2021 by New Relic. But the most promising aspect of eBPF for 2022 is the fact that it is possible, with eBPF, to implement continuous profiling of applications in production. Examples of this are the aforementioned Pixie project and Parca. As proven by tools like Google’s Cloud Profiler and various commercial observability tools, having a low-overhead, always-on profiler in production is a powerful way to troubleshoot latency and memory issues in production environments, which are notoriously hard and time-consuming to reproduce in test labs.

    Clear differences

    While production profiling with eBPF is happening now, it is not yet a general capability for use with most applications. The way profiling works is surprisingly different across different runtimes and programming languages. While pretty much all of the languages behave similarly in terms of using the CPU and allocating memory (and even in such foundational computing matters, there are differences), the way process concurrency is notably different, pretty much across the board. 

    For example, Java is using threads inside the Java Virtual Machine that are mapped to threads in the Operating System (to be fair, there are also other options, like NIO and libraries like RxJava, Reactor, Vert.x, plus Project Loom will eventually ship). In Node.js, on the other hand, concurrency is mostly dealt with the Event Loop, and “real” threads at the Operating System are abstracted away from the developer. Differences like these matter for a profiler, because the data shown to the person troubleshooting an issue must be “translated” to the model for concurrency used by the programming language, and this requires explicit support in the profiler for specific runtimes.

    Open source observability comes of age in 2022

    Fortunately, 2022 is going to be the year that brings us full-featured, open-source, eBPF-based production profiling tools that understand the specifics of the many runtimes that are prevalent in today’s cloud-native applications, like Java, Node.js, Python and .NET, as well as compiled languages like Go and Rust. And that will be a game-changer for improving software and solving issues faster, for all DevOps and SRE and operators.

    As we look out to the year ahead, revolutionary technology like eBPF means the rate of innovation happening at the operating system level is only picking up and setting the stage for the year of true observability.