Tag: observability

  • Increasing Use of SLOs to Enable Observability

    Increasing Use of SLOs to Enable Observability

    Observability is a growing discipline among most IT and operations departments. To release stable software faster, operators need continuous visibility into metrics like performance, uptime and availability. As a result, engineers are increasing their use of service-level objectives (SLOs) across the board—a recent study found that 82% of companies are increasing their use of SLOs.

    SLOs enable deep visibility into specific applications’ performance and are often used by site reliability engineers (SREs) to ensure quality and avoid service interruptions. Not only that, but various teams are correlating SLOs to aspects of the business to reduce cost and help direct decision-making. But while many environments have visibility, there are still gaps present.

    Nobl9 recently released a global survey of IT professionals and executives that tracked the state of service-level objectives in 2022. Below, we’ll look at the key findings from the report and consider what they mean for the state of SLOs and observability in general.

    State of Observability and SRE

    In general, site reliability engineering is still maturing across organizations. Though only 31% of companies have adopted SRE, it’s slated for much future growth, as 46% said they plan to embrace SRE in the future.

    These operators are now faced with many cloud-native observability tools, which are producing a sea of data in the form of metrics, logs and traces. A full 39% of companies use anywhere from six to 10 observability and monitoring tools and 35% use more than 11.

    With so many tools now deployed, who is using this observability and monitoring data? Namely, at 74% of companies, observability data support operational requirements. Operations teams are the ones most likely to use SLOs to monitor uptime, performance and overall efficiency. After operations teams, security teams also use this observability data (71%), which makes sense as SLOs can inform incident response. Other areas that follow are customer support, compliance and capacity planning.

    One interesting finding is that only 42% of companies use SLOs for service-level agreement (SLA) adherence. This indicates that SLOs are most often applied to internal optimizations and decision-making.

    Hybrid Environments Complicate Visibility

    Companies are mostly tracking SLOs to increase their visibility into networks (83%), databases (76%) and applications (75%). Other top areas include private cloud environments and legacy computing arrangements. But although observability is trending, organizations still lack complete visibility across the entire stack.

    Of note is that nearly half (46%) of respondents said their monitoring and observability tools don’t provide full visibility into all of their company’s IT assets. For example, only 45% of companies have visibility into their containers and just 35% have visibility into their microservices architecture.

    A lack of full-stack visibility may be complicated due to rising hybrid and multi-cloud conditions, as 78% say a hybrid cloud environment makes monitoring infrastructure more difficult.

    Benefits of Tracking SLOs

    The report defined SLO as “a performance and availability target set for a given system, application [or] service over time.” And the benefits are readily apparent for organizations following such targets—they can help increase performances, direct decision-making and help avoid outages.

    As a result, 70% of companies are currently using SLOs in some fashion. Here are some benefits of tracking SLOs:

    • Increase microservice performance: 87% said using SLOs for microservices architecture would improve service performance.
    • Enable full-stack observability: 58% said some of their company SLOs are mapped to business operations.
    • Improve business decision-making: 91% agreed using SLOs can help drive better business decisions.
    • Prevent service interruption: 67% said their company prevented business interruptions thanks to SLO thresholds alerts.
    • Reduce expenses: 90% indicated SLOs saved their company money.

    Final Thoughts

    More teams are tracking service-level objectives than ever before. And most companies (71%) that aren’t using SLOs now plan on adopting them soon. The data demonstrated that the observability market is an evolving area with room to grow. And, the same can be said about the SRE role.

    Yet, it’s good to point out that not all companies will adopt precisely the same roles or monitoring procedures. Therefore, there will likely continue to be variance in who is using SLOs and how they are applied. Regardless, the study suggested that investigating SLOs has the potential to benefit the software life cycle in many ways.

    The study, “Adoption of SLOs Grow to Increase Visibility and Drive Business Improvements” surveyed 309 participants around the globe in various sectors. The study was sponsored by Nobl9 and conducted by Dimensional Research. For more information, you can download the report here.

  • Observe, Inc. Dives Deeper Into Observability

    Observe, Inc. Dives Deeper Into Observability

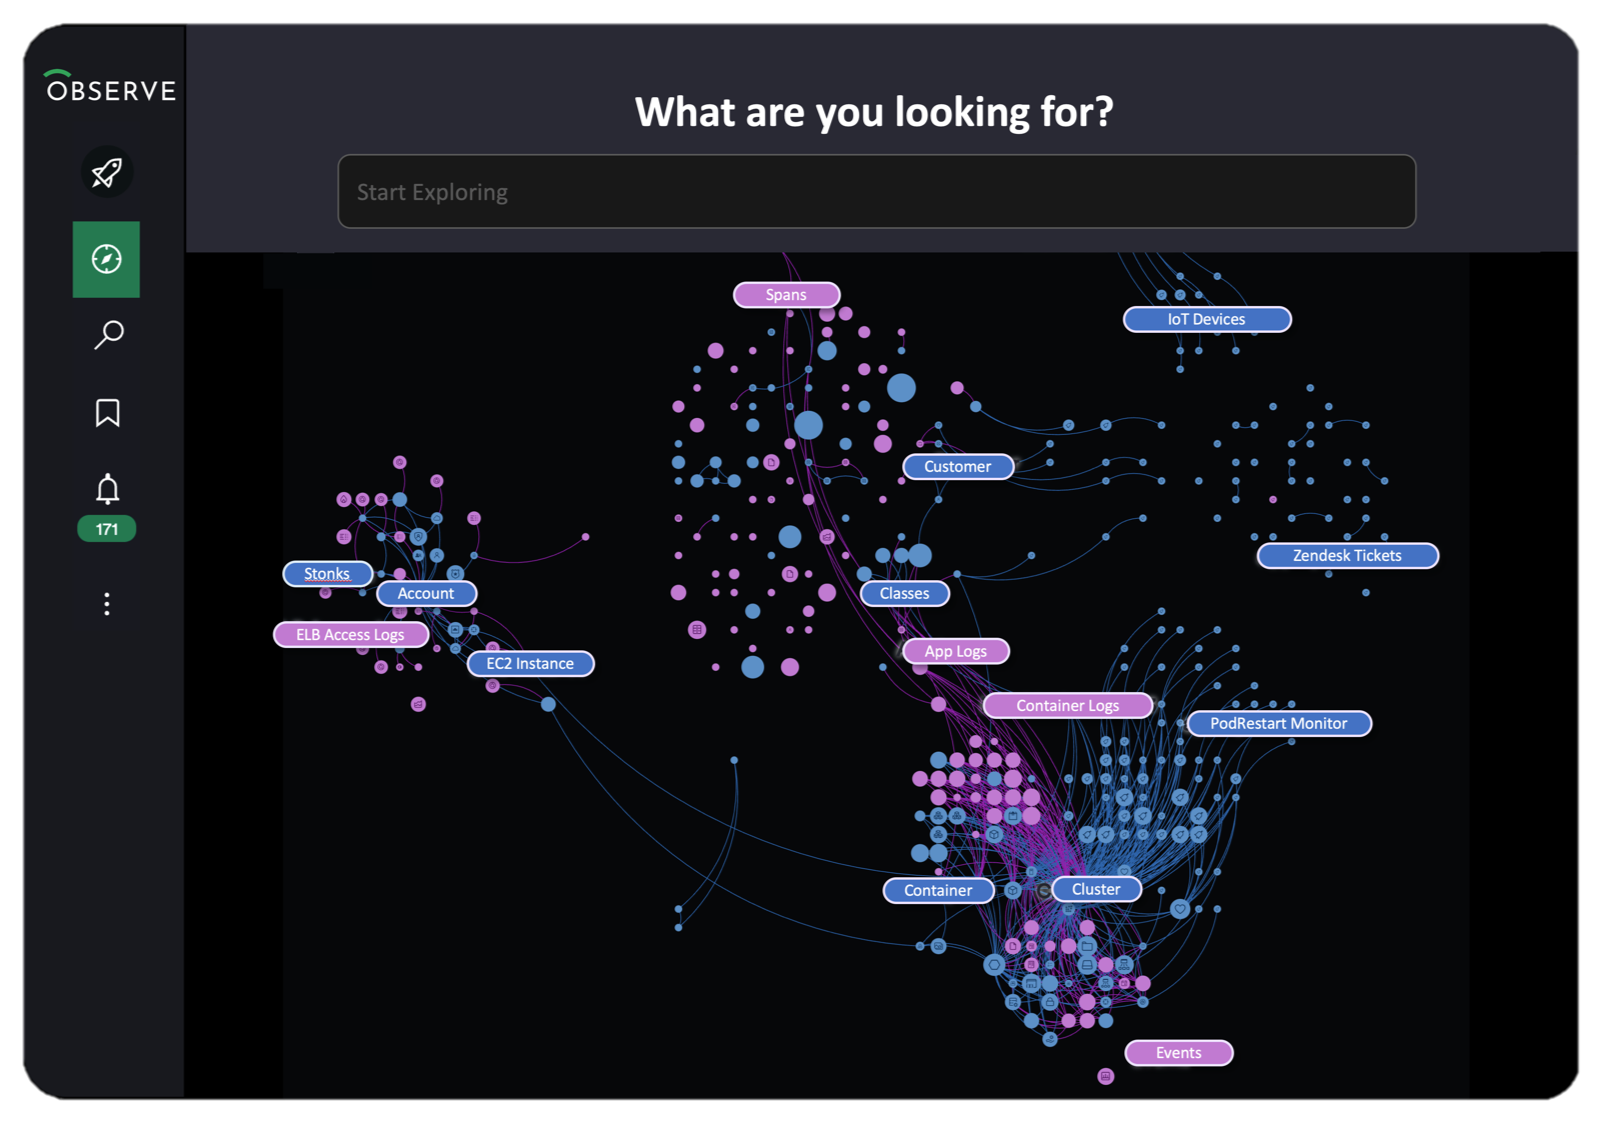
    Fresh from picking up an additional $70 million in funding, Observe, Inc. announced this week it has added multiple tools, dubbed Data Universe Maps, to its observability platform to visualize all datasets and surface underlying event data.

    The company also added pre-built applications for Kubernetes, Amazon Web Services (AWS) and Jenkins environments with editions for Google Cloud Platform (GCP) and Microsoft Azure planned for later this year. Observe Apps are intended to make it easy for IT teams to ingest data that is surfaced via pre-built dashboards that will generate alerts when issues arise.

    Finally, Observe, Inc. has added dashboards that provide transparency into its usage-based pricing model. IT teams can now more easily determine how many credits are consumed by both users and specific datasets to help contain costs.

    Observe, Inc. CEO Jeremy Burton said those tools are crucial because in the absence of tools to control data costs, most organizations will soon discover that observability is unsustainable.

    Of course, it’s not clear yet how many organizations are moving beyond monitoring metrics to embrace observability and launch queries to discover the root cause of performance issues. Many organizations don’t have the level of expertise required to structure such queries. However, as more organizations struggle to investigate and remediate issues impacting customer experience, interest in observability platforms is rising, noted Burton.

    Burton said thus far, as a startup, Observe, Inc. has expanded its customer base by a factor of three to now include 50 organizations, which has resulted in a five-fold increase in the number of monthly active users of the platform. The platform is now ingesting more than 40TB of data each day, with more than 25 million queries each day launched across nearly one trillion rows of more than 10 petabytes of data. Capital One is included among the investors in Observe, Inc.

    At the core of the Observe platform is a graph engine that makes it simpler to uncover the relationships between machine data that is ingested into the platform.

    Going forward, Burton said Observe intends to add support for distributed tracing using the open source agent software created by the OpenTelemetry project that operates under the auspices of the Cloud Native Computing Foundation (CNCF).

    Change within enterprise IT organizations happens slowly. Many will be using legacy monitoring tools alongside observability platforms for years to come. However, there is an opportunity to rationalize monitoring tools as the capabilities of observability platforms continue to expand.

    In the meantime, IT environments will continue to become more complex as more modern applications based on microservices and constructed using containers are deployed. These applications, over time, are generally more resilient than monolithic applications; given all the dependencies between microservices, determining the root cause of a performance issue can be a major challenge. As a result, it may be just a matter of time before this new class of applications ultimately forces the observability issue in the enterprise.

  • Smoothing the Transition From REST to GraphQL

    Smoothing the Transition From REST to GraphQL

    Since its open source release in 2015, GraphQL has taken the development world by storm. GraphQL, the query language originally developed by Facebook, is a big boon for frontend developers, as it enables you to grab the exact data you need with a single request. This solves the problems of over-fetching and under-fetching, which classical REST APIs are prone to. GraphQL also offers a nice developer experience with a consistent schema and documentation. Some are even treating GraphQL as a convenient meta layer to aggregate multiple underlying services and abstract their interfaces with simple commands.

    For these reasons and more, many development teams are considering switching from REST to GraphQL. Even enterprises are beginning to use GraphQL in large production environments. But, how can these teams make the switch without breaking existing integrations? How can we ensure that things like developer experience, security, and access control all remain stable?

    I recently met with Anant Jhingran, the co-founder of StepZen, to discover tips for transitioning from REST to GraphQL. According to Jhingran, most organizations see the benefit in adopting GraphQL but are hesitant to forgo years of investment into RESTful architectures. But according to Jhingran, it’s rarely a case of “either/or”—more often, he sees projects running both styles simultaneously or layering one on top of the other. Below, we’ll explore some things to keep in mind as you invest in GraphQL.

    The Decade of Developers

    We’ve reached ubiquity of web APIs among companies big and small. “APIs have turned out to be phenomenal for software supply chains,” said Jhingran, the former CTO of Apigee. They help share data between partners and can enable platform ecosystems to thrive. Jhingran describes how within the last decade, APIs and API management have peaked to near-ubiquity in terms of adoption.

    But not all APIs behave the same way. Although representational state transfer (REST) is the most popular style, it’s still quite a general architectural guideline for web APIs—how the data comes out of each service is still highly nuanced. The structure of requests and responses are different from service to service, causing developer experience hangups at scale.

    GraphQL, on the other hand, “is a fantastic way of structuring data,” said Jhingran. With a single call, you can return the explicit information that the client requires in an expected format. For an e-commerce application, for example, this might be customer information, order numbers and delivery status. Displaying this all with one call is an awesome experience for frontend developers. And, GraphQL APIs are easy to explore and navigate since the schema is baked in. This improves upon REST APIs, where documentation may not always match the actual production implementation.

    “This decade is the decade of developers,” said Jhingran. Satisfying developer experience has become more mission-critical as enterprises work to increase their footprint in the cloud marketplace and GraphQL is part of this movement. “For people who build apps, it’s just better,” said Jhingran.

    But just because frontend teams clamor for the ease of use of GraphQL doesn’t mean backend teams can easily restructure their entire framework around it. Doing it right requires many skills, and the journey can be arduous, explained Jhingran.

    It’s Rarely REST Vs. GraphQL

    REST and GraphQL are often pitted against one another to the point that they seem like polar opposites. But in practice, teams often use GraphQL to build on top of APIs already in place. Jhingran describes the most common pattern as “GraphQL comes in as a layer that connects the dots between various REST APIs.” Either GraphQL is consumed directly or as a REST layer above GraphQL. “It could go either way,” he said.

    GraphQL is a fantastic data infrastructure tier as it can mix and match database backends. It could, in essence, become the new plumbing upon which applications are constructed. But while GraphQL may be excellent for internal construction, the name of the game is stability when externalizing services to the outside world. With REST, the big goal is to decrease broken clients and ensure high-grade security for each resource. Therefore, Jhingran foresees certain use cases where using a REST wrapper around GraphQL services to deliver fixed JSON responses would be preferred.

    Another point is that GraphQL is not only relegated to appeasing frontend developers—it has some backend potential, too. “GraphQL is an opportunity to reimagine frontend and GraphQL is an opportunity to reimagine backend infrastructure,” said Jhingran. This concept has weight nowadays, as Netflix engineers, for example, use GraphQL as a backend for microservices architecture.

    Making the Transition From REST to GraphQL

    Not all apps are going to be transformed on day one. Teams may encounter cultural resistance to new technologies. Interface redesigns, especially for those external apps which are exposed to third parties, must also require extra precaution to maintain app compatibility to avoid breaking change.

    Thus, it may take time to transition effectively. “Getting it started versus getting it right are not the same thing,” said Jhingran. He said people who get started with GraphQL may struggle for months due to competing best practices and tools. For example, Jhingran identified two main perspectives when approaching GraphQL: Programming and declarative.

    • Programming: Teams use GraphQL libraries such as Apollo to program their way out of your GraphQL endpoint. In this approach, you just start writing. It’s quick to get started, said Jhingran, but you end up describing everything you do and encountering many contingencies along the way.
    • Declarative: The other option is a more declarative approach—instead of telling the system how, you tell it what to do. For example, this subsystem should do X, this subsystem should do Y and so on. According to Jhingran, adopting tooling with declarative snippets to create GraphQL endpoints is “better in the short and long run.”

    GraphQL Security

    A March 2022 report from Salt Labs found a shocking 681% increase in API-based cyberattacks over the previous 12 months. There are many concerns surrounding API security right now—these valuable endpoints are prone to broken access control, data overexposure and over-permissive states.

    As I’ve covered previously, GraphQL security is a bit nuanced compared to REST. Within the REST paradigm, you can easily assign permissions and rate limit calls per resource. But with GraphQL, it’s not that simple. Since you can batch multiple queries, callers have much more power at their fingertips, and hackers might abuse such power if the proper authorization isn’t in place.

    Companies may rightly worry about opening another can of worms with GraphQL. But according to Jhingran, these worries are all solvable. A comprehensive GraphQL endpoint will likely require another layer to uniquely segment authorization to retain a least-privilege model for all resources and backend endpoints.

    Future of GraphQL

    To date, GraphQL has gained modest prominence. But, Jhingran foresees an incoming inflection point in the next two to three years. “The dominoes are beginning to fall,” he said.

    Now that the market is saturated with APIs, characteristics outside of functionality will be what sets a service apart and gives it a competitive edge. This includes things like performance, security and developer experience, the latter of which makes GraphQL an attractive proposition. This, paired with the explosion in GraphQL tools, will undoubtedly help developers perform their jobs better.

    Looking to the future, Jhingran predicts increased usability and abstraction in how developers work with GraphQL. He compared it to how disjointed pages on the web became interconnected and searchable with links. We see similar thinking happening in the world of APIs, he explained, in which the disjointed APIs require a better connection. Similar to how Google simplified search, he foresees GraphQL and the tools that work with it helping to decrease cognitive load by abstracting complexity with declarative commands.

  • Datadog Unfurls Application Security Service

    Datadog Unfurls Application Security Service

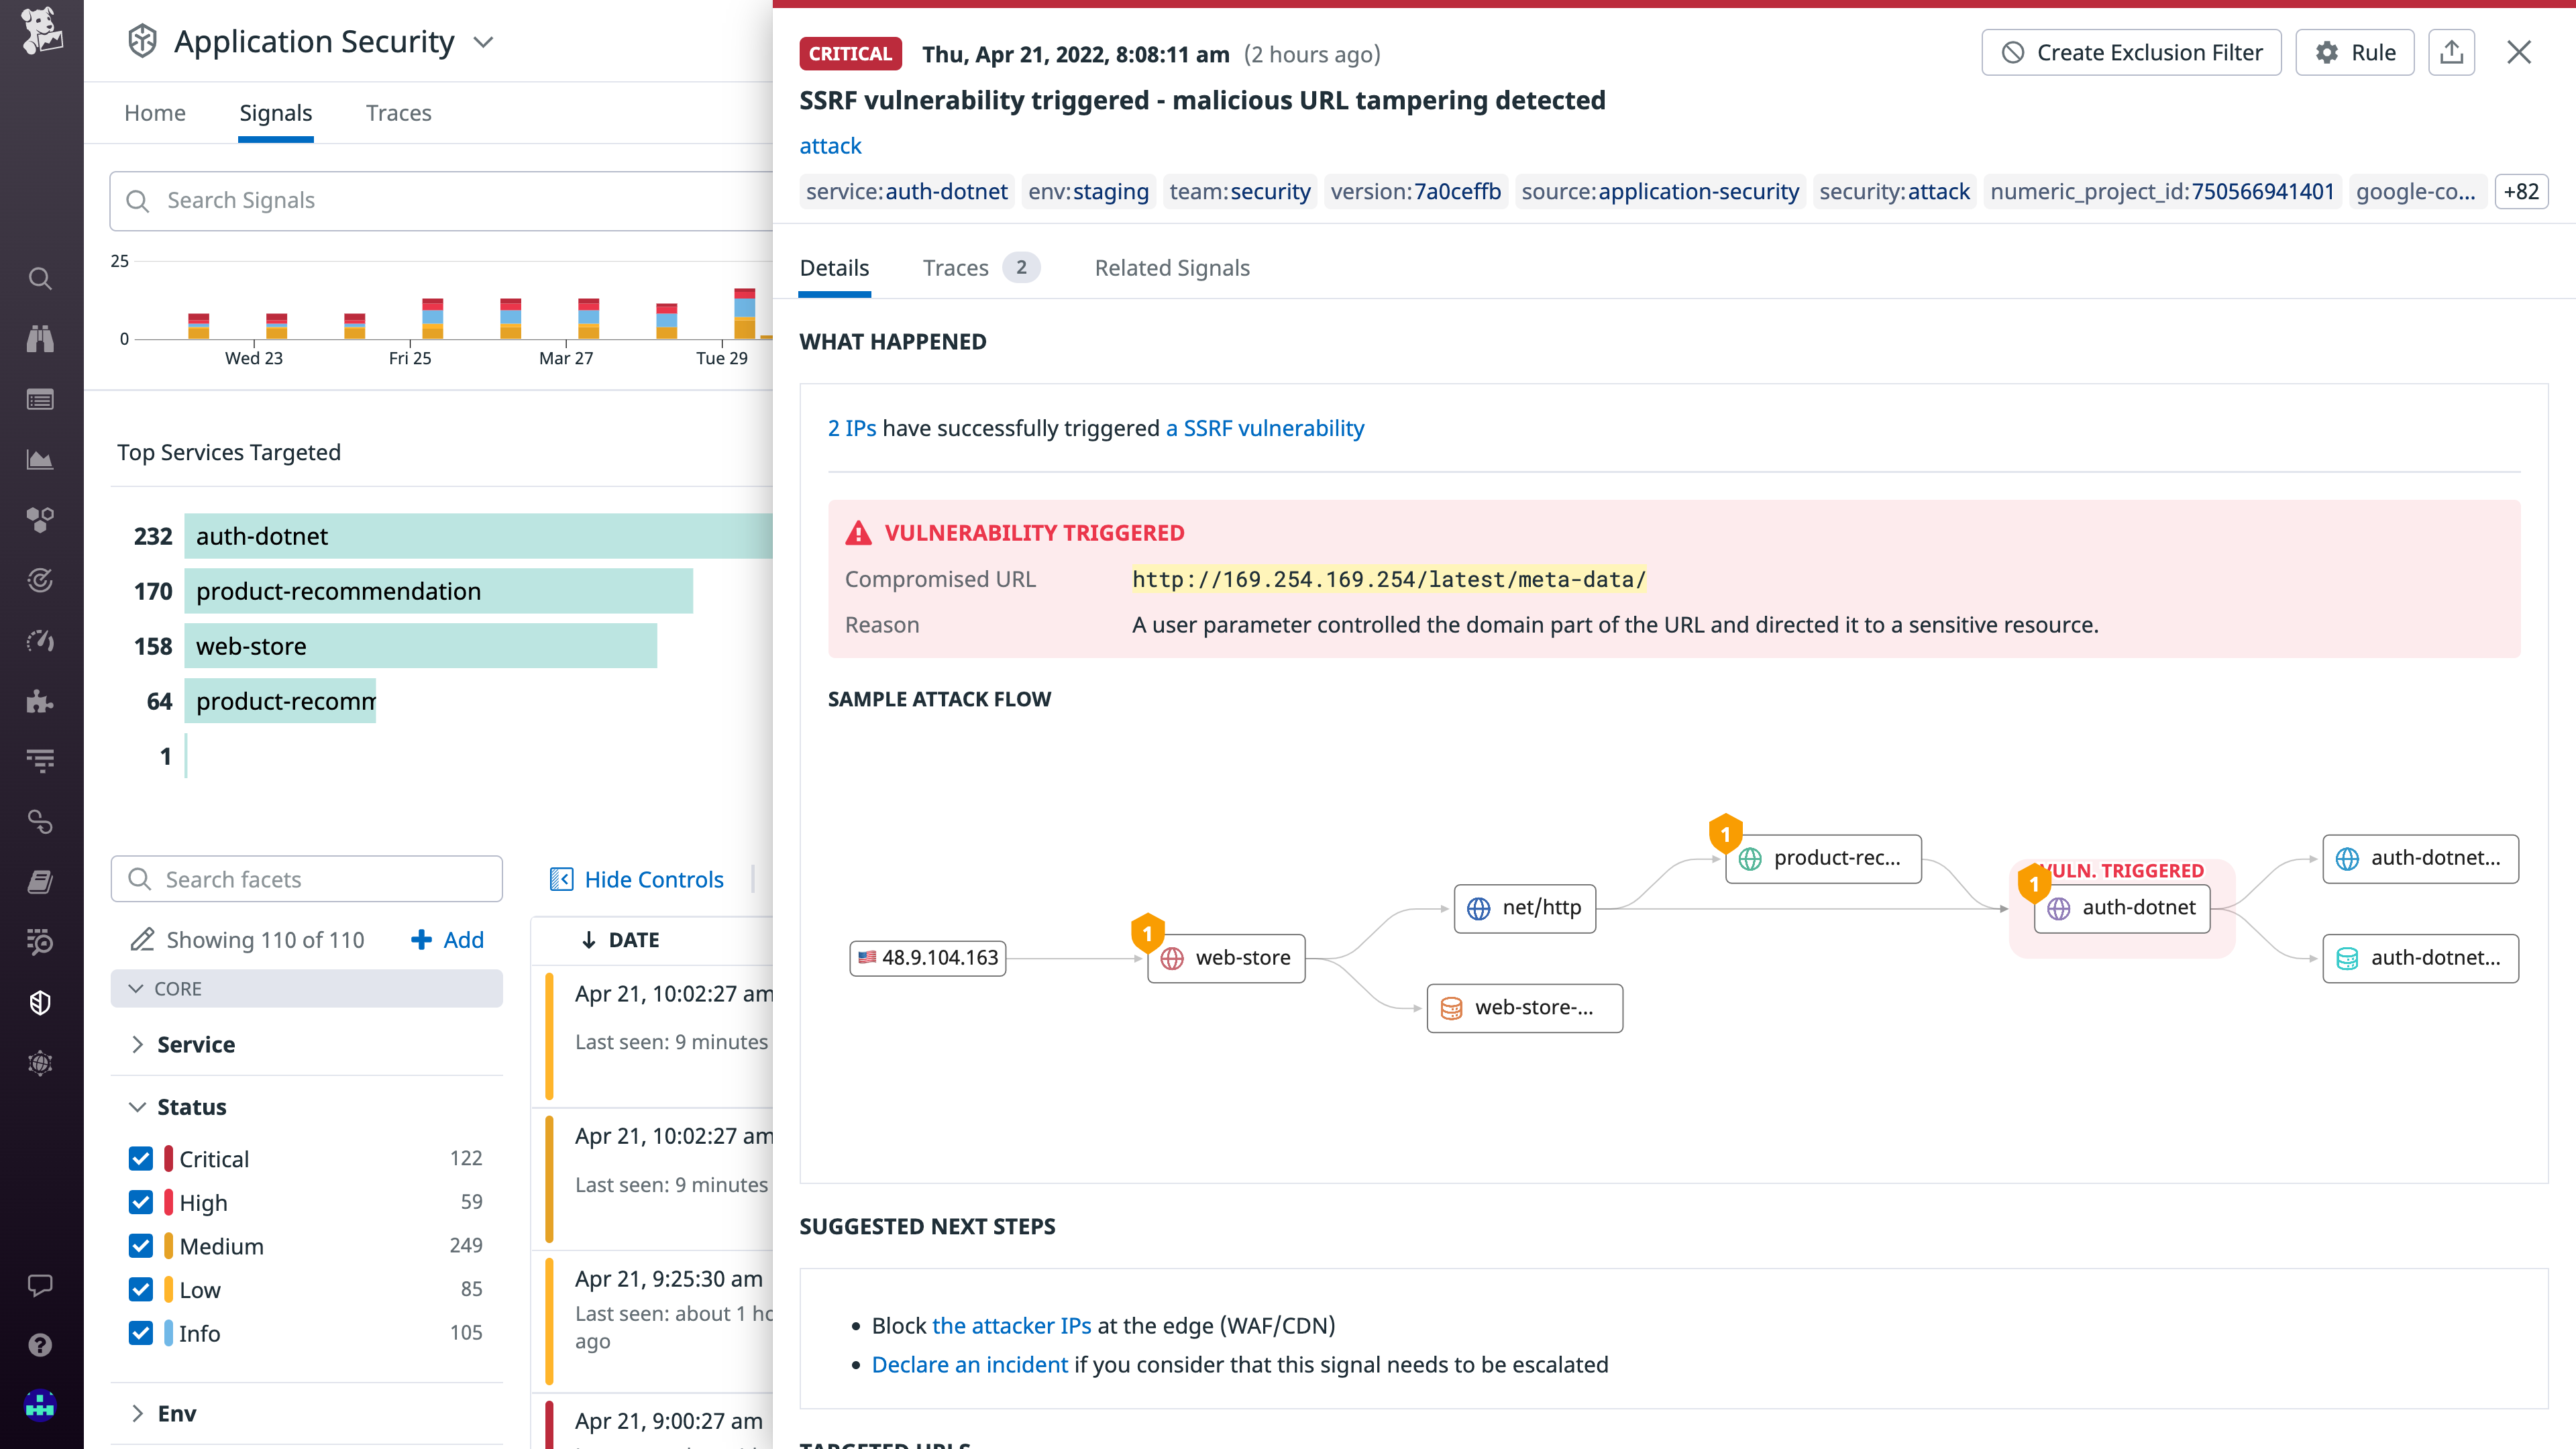
    Datadog, Inc. today made generally available an Application Security Monitoring (ASM) service that is based on the same agent software that many DevOps teams already use to monitor applications.

    Pierre Betouin, vice president of product for the cloud security platform at Datadog, said ASM is designed to make it simpler for DevOps teams to add additional DevSecOps best practices to their existing workflows. The ASM service is based on a runtime application self-protection (RASP) engine and web application firewall that Datadog gained with the acquisition of Sqreen a year ago.

    ASM then employs distributed tracing to discover code-level vulnerabilities such as server-side-request forgeries (SSRFs), SQL injection and cross-site scripting (XSS) flaws. It is designed to extend an existing Datadog Cloud Security Platform that includes cloud security posture management (CSPM), cloud workload security (CWS) and cloud SIEM services.

    The overall goal is to make it simpler for DevOps teams to address application security by eliminating the need to deploy and maintain a separate set of agents within applications, said Betouin. That approach reduces resistance among DevOps teams that would otherwise be concerned about the additional overhead another approach to application security would add to an application environment, he added.

    The number of organizations looking to implement DevSecOps best practices is expected to increase in the weeks and months ahead in the wake of a series of high-profile breaches and zero-day vulnerability disclosures. Many organizations are now performing security reviews across their entire software supply chain as part of an effort to discover any malicious malware that might have been inserted into applications.

    The challenge those organizations face is that as application environments become more dynamic, maintaining application security becomes more difficult as code is continuously updated. The best way to address that engineering challenge is to extend the reach of an observability platform that many DevOps teams already have in place, noted Betouin. Ultimately, the goal is to automate application security as much as possible but that’s not going to be achievable if DevOps teams lack the context required, he added.

    It’s not clear at what rate organizations are embracing DevSecOps best practices. However, it’s clear that DevOps teams are being held more accountable for application security. Most developers are now charged with becoming application security experts overnight, so the only way to effectively ensure application security is to uncover security flaws before applications are deployed in production environments.

    There are, of course, multiple ways of achieving that goal. Datadog is betting that the path of least resistance is via a cloud service that connects to agent software inserted within those applications. DevOps teams have been inserting agent software, in one form or another, into those applications for years. The issue is that with each new agent added there is yet another software component that needs to be deployed and regularly updated. If not carefully tracked, a DevOps team could find itself attempting to manage an entire portfolio of agent software for every platform employed.

  • Riverbed Unveils Unified Observability Platform

    Riverbed Unveils Unified Observability Platform

    Riverbed today launched a beta of a unified observability platform it will make available under the Alluvio by Riverbed brand name.

    Jim Hansen, senior vice president for product management at Riverbed, said the Alluvio by Riverbed observability platform combines several existing network and application performance management platforms into a single offering that is now infused with machine learning algorithms to provide deeper insights into IT environments.

    The goal is to provide an open observability platform that can not only aggregate data collected from both Riverbed and third-party offerings but also identify the best ways to resolve an IT issue, added Hansen.

    Scheduled to be generally available later this year, the Alluvio by Riverbed observability platform will differ from existing observability platforms in that it will enable IT teams to not just identify the root cause of an IT issue, but also note which processes should be employed to resolve it, he said.

    With this launch, Riverbed is attempting to reposition itself. Previously, the company offered network and application performance management platforms alongside a wide range of network software and hardware. Each of those offerings is now a source of data that can be fed into the Alluvio by Riverbed observability platform, noted Hansen.

    Observability, of course, has always been a core tenet of any DevOps best practice. Achieving that goal, however, has proven to be elusive. Most of the IT monitoring tools used today are designed to track a set of pre-defined metrics. Whenever there is an issue, IT teams typically convene in a war room where they try to uncover the root cause of, for example, a performance issue by comparing reports and the various dashboards generated by monitoring tools. It can take weeks to discover an issue that often only takes a few minutes to fix once the source of the problem is identified.

    In contrast, observability platforms promise to reduce the time required to discover IT issues by aggregating all the data generated by the IT environment within a single platform that correlates events and makes it easier to identify anomalous behavior. Armed with those insights, it becomes a lot simpler for IT teams to launch queries that enable them to resolve issues faster.

    Those insights are also increasingly being used to drive business decisions as organizations become more dependent on software to drive digital business transformation initiatives. However, a recent survey conducted by Riverbed finds three-quarters of business decision-makers (75%) said their organizations struggle to glean actionable insights from data generated by their technology infrastructure.

    The challenge IT teams inevitably encounter is they don’t always know the right questions to ask, which is an issue that can be addressed by machine learning algorithms capable of identifying anomalies indicative of an IT issue that needs to be resolved.

    There already is no shortage of observability platforms. The issue now is determining which observability platform to employ across a distributed IT environment that is becoming more instrumented with each passing day.

  • SolarWinds Unveils Unified Observability Platform

    SolarWinds Unveils Unified Observability Platform

    SolarWinds this week launched an observability platform that makes available a range of tools and technologies that the company has developed and acquired via a common user interface.

    Rohini Kasturi, chief product officer for SolarWinds, said the SolarWinds Hybrid Cloud Observability platform also makes an observability platform affordable for a much wider range of organizations.

    The platform also makes it easier to discover, map, and understand dependencies in ways that make it easier to achieve and maintain service level objectives, he added.

    The SolarWinds Hybrid Cloud Observability is a suite of tools made available via multiple tiers that make it simpler to automatically discover the root cause of an IT issue in addition to making it easier to manage configuration, reporting, and planning tasks across cloud computing and on-premises IT environments, said Kasturi.

    As IT teams increasingly distinguish between merely monitoring IT environments and achieving observability that allows them to proactively surface anomalies using machine learning algorithms and other forms of data science, the level of depth and insight that can be applied to managing IT is increasing dramatically. In fact, observability is quickly becoming table stakes for any provider of IT management tools, noted Kasturi.

    There is, of course, no shortage of observability platforms. The SolarWinds Hybrid Cloud Observability is designed to be deployed alongside existing monitoring tools rather than requiring IT teams to rip and replace the tools they already employ, said Kasturi.

    It’s not clear to what degree IT organizations are embracing observability. As a core tenet of best DevOps practices, observability has always been a goal. However, even the most advanced DevOps teams have thus far achieved little more than continuous monitoring of IT environments that are based on a set of pre-defined metrics. An observability platform not only surfaces anomalies but also enables DevOps teams to launch queries across logs, metrics and distributed traces to identify the root cause of a performance issue before it becomes a major disruption.

    The biggest challenge, however, may not be the technology as much as it is simply understanding what queries to launch. As IT environments become more complex thanks in part to the rise of microservices-based applications, the number of potential permutations that might impact a highly dynamic IT environment is increasingly beyond the ability of any IT team to manually track. It’s already apparent that many of the legacy monitoring tools that DevOps teams rely on today will need to be rationalized in favor of tools infused with machine learning algorithms capable of discerning patterns across a complex IT environment.

    In the meantime, IT teams will need to spend a considerable amount of time experimenting with observability platforms in the months ahead. After all, applications don’t magically instrument themselves. However, once IT teams do find a way to aggregate the logs, metrics and traces that can be collected from one application environment, it does become easier to define a set of best practices that can eventually be more widely applied.

  • Overcoming IT Complexity With Full-Stack Observability

    Overcoming IT Complexity With Full-Stack Observability

    Organizations embarking on digital transformation journeys tend to develop complex infrastructures. They update their legacy applications while adding multi-cloud, virtual and cloud-native capabilities. Eventually, IT pros find themselves managing diverse, complex and distributed networks including cloud, system, application and database infrastructures.

    To rein in the resulting complexity, organizations tend to amass monitoring and managing tools. The goal is to simplify systems oversight—but instead, silos tend to develop because teams use a wide variety of tools to manage their networks or infrastructures. 

    This piecemeal approach worsens operational blind spots and delays problem resolution. It also increases security exposures. Soon, overwhelmed IT pros can’t keep pace with app modernization or infrastructure dynamics because they’re awash in complexity.

    Though this scenario is common, it’s not inevitable. IT teams can ease their digital transformation journey by implementing an integrated and cost-effective full-stack, end-to-end monitoring service capable of overcoming complexity and silos. 

    Organizations require full-stack observability.

    How Observability Differs From Traditional Monitoring

    Observability goes beyond traditional monitoring. Traditional monitoring helps IT organizations understand the actual state of their infrastructure and applications. It captures and processes volumes of infrastructure and application telemetry data and notifications and displays which components are up, which ones are down and which ones have changed. 

    Usually, traditional monitoring focuses on a specific network, cloud or infrastructure. It tracks application and infrastructure elements so IT pros can identify anomalies and investigate problems as they arise.

    Monitoring relies on metrics-oriented dashboards built to assess telemetry data against manual or basic statistically relevant thresholds. Monitoring tools are invaluable, but they don’t offer cross-domain correlation, service delivery insight, operational dependencies, or predictability. Modern systems have complex multi-cloud environments and a deluge of telemetry data: This counts as a shortfall.

    Observability does more. It measures the internal states of systems by examining the outputs and looks at applications and systems in their entirety—from the end-user experience to server-side metrics and logs.

    But observability also includes monitoring as a critical element. To gain observability, you must first collect information through monitoring. Observability uses the insights and metrics generated through monitoring to understand what’s causing the issue at hand. 

    Monitoring aggregates and displays the data to determine whether the systems are operating as expected. The analysis of this information is compared with expected outcomes and objectives. This allows IT pros to understand the state of their infrastructure and applications. 

    Silos are thus avoided because complex environments are viewed in their entirety.

    Observability in Action

    Once in place, observability allows IT organizations to continuously improve performance, availability and digital experience across complex, diverse and distributed hybrid and cloud environments.

    With observability, organizations can quickly find and resolve anomalies. However, full-stack observability goes beyond monitoring and expedited problem resolution: It supplies insights, automated analytics and actionable intelligence through cross-domain data correlation, machine learning (ML) and artificial intelligence for IT operations (AIOps). It works across massive real-time and historical metrics, logs and trace data.

    Observability goes beyond the silos and the piecemeal approach associated with traditional monitoring. And when observability isn’t limited—when it includes ML and AIOps—it uses the large volume of gathered data and supplies insights, automated analytics and actionable intelligence to help IT staff expedite problem resolution. It also enables ITOps, DevOps and security organizations to achieve consistent, optimized and predictable business service delivery with continuously improved digital experience and IT productivity. 

    The result is customers and employees benefit from better-run systems. The technology provides organizations of all sizes and industries with comprehensive, integrated, and cost-effective functionality through cloud-connected on-premises or software as a service (SaaS) deployment flexibility.

    When embarking on digital transformation journeys, organizations don’t need further complexity—certainly not while they update legacy applications and add a plethora of modern services and capabilities to their stack. The key to reducing complexity is observability.

    Observability simplifies the transformation process. It reduces operational noise to benefit ITOps, DevOps and security teams. They can become more proactive in issue and anomaly detection to achieve optimum IT performance, compliance, and resilience. With full-stack observability, any organization—no matter its size or industry—can reduce IT complexity while readying itself for digital transformation.

  • New Relic Adds SLO Tools to Observability Platform

    New Relic Adds SLO Tools to Observability Platform

    New Relic this week made a service level indicator (SLI) and service level objective (SLO) capability generally available within the New Relic One observability platform. The new capability makes it possible for DevOps teams to customize metrics, unified health reports and alerts.

    Alex Kroman, general manager and senior vice president for product engineering for New Relic, said the goal is to enable DevOps teams to more easily optimize services that span multiple applications and software components at a time when more organizations are relying on software to drive digital business transformation initiatives.

    IT teams have, of course, been tracking SLOs for decades. However, as application environments have become more distributed—thanks, in part, to the rise of microservices—achieving and maintaining SLOs has become more challenging. DevOps teams often lack an understanding of which metrics are most relevant to the business and even when they do, they have historically relied on manual processes and ad hoc tooling, noted Kroman.

    In contrast, New Relic is providing those capabilities in a way that makes it simpler to manage service levels at no additional cost, he added. DevOps teams can, for example, create SLIs in one click to automatically establish a baseline of desired performance and reliability. The platform also provides recommendations based on historical data to both establish benchmarks and customize and configure SLIs and SLOs.

    Those capabilities make it simpler to set service boundaries and track reliability across teams based on benchmarks, tags and reports that include bespoke views for both service owners and business leaders. In effect, via an application programming interface (API) exposed by New Relic, it becomes possible to employ dashboards to gain visibility across an entire business process, said Korman.

    It’s still early days as far as the modernization of SLOs is concerned, but it’s clear that, over time, they will be managed as code along with everything else in a DevOps workflow. The more organizations become dependent on applications to drive digital business initiatives, the more critical it will become for DevOps teams to track SLOs. The decision that must be made is the degree to which it makes sense to manually implement some form of SLO-as-code versus relying on an observability platform that can be accessed as a cloud service.

    Observability, of course, has always been a core tenet of DevOps. Few organizations are able to really achieve it, however, because most IT teams have been monitoring little more than a pre-defined set of metrics. Modern observability platforms make it easier for site reliability engineers (SREs) to launch queries against aggregated instances of metrics, logs and distributed traces to ascertain the root cause of an issue. The issue then becomes how to correlate the results of those queries against the service levels that businesses expect from a set of applications that might be driving, for example, an order-to-cash process. After all, knowing what occurred within an IT environment doesn’t always easily translate into a report that the average business executive can easily comprehend.

  • How Observability Can Improve Gaming

    How Observability Can Improve Gaming

    Competing in the gaming industry is becoming increasingly costly. To attract new players, millions of dollars are spent in user acquisition (UA), development and cloud infrastructure. As the space becomes more expensive, revenue and cost optimizations can become a matter of survival. 

    The cost to businesses because of server outages, game response lag or generally poor performance can equate to billions of market cap of gaming companies. The value of observability in modern games is about ensuring that revenue opportunity is not missed in a costly operating landscape. Observability assures that all investment spent on user acquisition is protected and that gaming user experience (UX) is maximized. And user experience depends not only on how the game’s UI is performing but also on the entire gaming environment performance and reliability.

    A modern gaming environment is usually highly distributed—a lot of pieces have to come together. The engineering team develops code for the gaming application, which can consist of many microservices, containers, managed cloud services, third-party APIs and serverless functions. Game designers create game levels, the art team produces visual effects and animations and the audio department creates game audio. Once these moving parts are packaged together, the game service has to be deployed on cloud infrastructure and the game itself shipped as executables for consoles, mobile devices and laptops.

    gaming observability

    All these elements generate massive amounts of observability data, particularly if a game is popular and played by millions of users. Thus, making sure that all gaming elements are working as expected means that gaming companies have to implement efficient ways of collecting and analyzing the massive amounts of that data. That data comes from gaming services, consoles and other sources in real-time. For instance, it is not uncommon to deal with hundreds of terabytes of ingested log data per day. As a result, improving the gaming experience can be quite challenging for gaming companies with large-scale operations. The companies’ success depends on how efficiently they can harness all the data generated by gaming environments.

    This is where observability comes in. Observability provides critical insights into what is—or what may be—wrong with the game, all its moving parts and user experience. Powerful observability capabilities are essential, including processing vast amounts of data (logs, metrics, traces, etc.) in real-time, managing fluctuating observability data from variable user loads and running concurrent real-time queries on a massive scale.

    So, what, exactly, needs to be measured for a great gaming user experience?

    Measuring the Gaming User Experience

    Gaming companies are under continuous financial pressure to deliver new features that attract and retain new users in order to offset mounting operating expenses. Attracting new users is a balancing act from the gaming companies’ perspective. If they move too slowly, they will lose gamers. If they move too quickly, the gaming user experience can deteriorate due to newly introduced bugs. Gamers can be very vocal on social networks, especially if their intent is to express their dissatisfaction with compromised gaming quality. As a result, companies are forced to balance the rate of feature introduction with user satisfaction. That’s why they need to measure user experience continuously.

    To improve gaming user experience, gaming organizations must establish measurable key performance indicators (KPIs), which can drive improvements and overall quality. KPIs include, but are not limited to: 

    • User video quality (frames per second)
    • Memory usage
    • Crash reports count
    • Database performance measurements
    • Service latencies 
    • User request count
    • Game-specific errors and warnings count
    • Code quality measurements, such as automated test coverage success criteria (a part of the CI/CD pipeline)

    Monitoring Service Latency for a High-Quality Gaming Experience

    Gaming applications are often bursty when it comes to user load, especially during the introduction of new games or new features. One of the critical indicators to monitor is service latency to manage fluctuating user demand during those times. 

    DevOps teams and SREs need to collect logs at a massive scale to analyze the performance of services, infrastructure and individual host utilization metrics such as high CPU utilization. This information gives engineers clues about the sources of bottlenecks and potential deterioration related to service latency. And logging tools need to be able to deal with this fluctuating demand, too. This level of insight into the state of the gaming application helps engineers troubleshoot issues before gamers face increased service latency that can impact their gaming experience.

    Analyzing Game-Specific Observability Data

    Game developers can create custom logs and metrics and combine those with observability data from the gaming engines. Both must be analyzed to assure a high-quality user experience. Some of the common gaming data parameters available for analysis are:

    • Log data that indicates when a player joins and leaves the game (associated with the player’s name)
    • The location of a player reported at specified times
    • Logs related to significant gaming events associated with each player (such as goals achieved or actions performed)
    • Logs related to chat messages between players, player location, the time when the message was generated and message context

    The more data collected, the better the chances to understand any issues that can turn players away from the game. Observability data management should evolve in parallel with game development. As new features are added, the code should be instrumented with KPIs to ensure the quality of the newly introduced code in the long run.

    Database Performance Monitoring is Critical for Gaming User Experience

    To store time-sensitive gaming data, DevOps teams must use fast databases. The database performance and how fast the game’s properties are retrieved from a database directly impact user satisfaction. Slow database performance negatively affects the gaming user experience. For DevOps teams to avoid any service issues, it is a must to measure key database performance indicators such as response times metrics, out-of-memory error logs and others.

    Fast databases could be expensive in the extremely competitive market where gaming companies are always looking for cost optimization to survive in the business. It’s non-trivial for DevOps teams to monitor user experience related to database performance and, at the same time, to look for ways to optimize the cost of fast databases.

    Build a Pipeline and Delivery Monitoring

    For a large-scale video game, new code is often pushed many times per day. Builds can be significant and deployed across many gaming consoles and end devices. Continuous build pipeline and delivery monitoring are crucial for frequent and commonly large software deployments.

    With large builds deployed daily over the network to thousands of gaming platforms—where each platform receives a massive amount of data—monitoring of build deployments should be automated. Errors from log data should trigger alerts and drive redeployments. QA automation is necessary to reduce the burden of QA efforts and make build deliveries less error-prone and less tedious. 

    Better Observability Improves In-Game Commerce

    Insights into user behavior are as important as monitoring possible issues affecting user experience. Observability tools can provide key insights into the overall engagement of all game users. High engagement then drives more excitement. Higher user excitement may increase the success of ad campaigns and accelerate in-game purchases.

    Observability Tools for Managing Gaming Experience

    When thinking about observability tools that can be instrumental in driving continuous improvement of user experience in the gaming industry, the following functionalities are important:

    • Ability to ingest and analyze log data at petabyte-scale and beyond in real-time to avoid gaming experience deterioration.
    • Zero-schema and ability to accept observability data in various formats from various gaming platforms, cloud servers, gaming consoles, and mobile devices. Because gaming environments use different third-party software packages, logs may come in many formats.
    • Ability to create alerts on collected observability data. Alerting can improve user experience by monitoring properties such as the number of active users experiencing client errors. 
    • Capability to handle backpressure when critical issues occur is essential. An alert storm can clog the data pipes, and the observability tool can be in the dark for hours unless it is designed to cope with backpressure.
    • Ability to collect data from build pipelines to monitor frequent and commonly large software builds being deployed daily over the network to numerous gaming platforms.
    • Capability to collect data from cloud environments such as cloud infrastructure monitoring. 

    Observability is key to protecting gaming revenue opportunities and assuring the success of video games, as long as you know what to look for in observability tools that are used to gather data from gaming environments.

  • Log Management Challenges Grow With Observability Adoption

    Log Management Challenges Grow With Observability Adoption

    It appears that, in many IT environments, observability is becoming too much of a good thing. A global survey of more than 315 IT executives, cloud application architects, DevOps professionals and site reliability engineers (SRE) conducted by Dimensional Research on behalf of log data management platform provider Era Software, found 96% are witnessing an explosion of log data.

    The survey also found 79% of respondents reported the overall cost of observability and log management will skyrocket in 2022 if current tools don’t evolve.

    More than three-quarters of respondents (78%) also noted attempts to manage volumes of log data have had mixed or unwanted results such as an inability to access data. Nearly two-thirds (65%) are also evaluating their observability options while the other 41% are considering it.

    Stela Udovicic, senior vice president of marketing for Era Software, said the survey makes it clear that as organizations rely more on logs to analyze IT events, the cost of storing all that log data is becoming a significant challenge. Overall, the survey finds usage of observability tools and platforms has jumped by 180% as IT teams struggle to manage increasingly complex IT environments.

    On the plus side, more business users are benefiting from log data. A full 83% of respondents report that business stakeholders outside of IT use insights from log data, with 96% reporting log data is being used to solve business problems.

    Observability has always been a core tenet of DevOps best practices, but achieving it has always been a challenge. Monitoring tools are designed to consume predefined metrics to identify when a specific platform or application is performing within expectations. The metrics tracked generally focus on, for example, resource utilization. However, whenever there is an issue, it can still take days, sometimes weeks, to discover the root cause of an issue through what amounts to a process of elimination.

    In contrast, observability combines metrics, logs and traces—a specialized form of logging—to instrument applications in a way that makes it simpler to troubleshot issues without relying solely on a limited set of metrics that have been predefined to monitor a specific process or function. DevOps teams can employ queries to interrogate data in a way that makes it easier to discover the root cause of an issue. Observability platforms correlate events in a way that makes it easier for analytics tools to identify anomalous behavior indicative of an IT issue.

    The issue that arises is that IT teams need to find a way to store all the data generated by the logs they need to analyze. Each IT team can, of course, could reduce the amount of log data they retain. However, there is always a concern that in the event of an incident critical log data won’t be available.

    Udovicic said most IT organizations have historically viewed storing log data as a necessary evil. The primary issue most of them encounter is the simple fact that log data is not easy to work with, she noted.

    Regardless of how organizations view log data, the amount of it that needs to be managed will only increase as DevOps workflows become more mature. The issue IT teams need to come to terms with now is finding a way to minimize the cost of storing it all.