Tag: observability

  • Dynatrace Adds Synthetic Tests to Validate App Experiences

    Dynatrace Adds Synthetic Tests to Validate App Experiences

    Dynatrace today extended the application release management capabilities it provides to include synthetic tests for validating and assuring user experiences.

    Saif Gunja, director of product marketing for Dynatrace, said the user experience validation and user experience assurance (UXA) capability spans everything from application availability and performance to actual engagement with specific features based on the service level objectives (SLOs) defined by a DevOps team.

    Dynatrace views application release management as an extension of its observability platform, said Gunja. While application release management has historically been viewed as an extension of a continuous delivery (CD) platform, Gunja said that observability platforms—such as the Dynatrace platform, which is infused with a Davis artificial intelligence (AI) engine—provide the visibility required to better automate the process.

    In fact, as DevOps continues to evolve, it’s apparent that CD and continuous integration (CI) are becoming more loosely coupled as DevOps processes mature, said Gunja. Most organizations have yet to implement CD simply because it’s been too difficult to achieve. Each platform that applications have been deployed is unique. Dynatrace provides the foundation for automating application release management via the agent software it makes available to instrument applications, said Gunja.

    It’s not clear whether DevOps teams are reevaluating their approach to application delivery, but Gunja noted that much of the interest in the Dynatrace approach is coming from organizations that have already installed the Jenkins CI/CD platform. The number of extensions that have been built and that need to be supported has created a level of technical debt that is unsustainable for many DevOps teams, he noted.

    Many IT leaders concluded they would rather allocate more resources to building applications than maintaining DevOps platforms, added Gunja.

    Most DevOps teams are committed to ruthlessly automating as many IT processes as possible. Observability has always been a core DevOps tenet in pursuit of that goal. Applications that are not instrumented can be programmatically managed. The issue is that providing observability isn’t enough—DevOps teams need to be able to take actions across the entire software development life cycle based on the data collected by the observability platform, said Gunja.

    Obviously, it’s still early days as far as observability is concerned. While application performance management (APM) platforms have been employed for decades, it’s only recently that observability platforms capable of correlating application and IT infrastructure data have emerged. Thanks to the rise of open source agent software, it’s also becoming less costly to instrument IT environments. The challenge, of course, is, as always, deploying and maintaining all that agent software.

    Regardless of the approach to observability and DevOps, it’s clear that IT teams will soon have a lot more visibility into their IT environments. The days when IT teams determined the root cause of an IT issue by process of elimination are finally coming to an end. Observability, however, is not an end in itself, but instead is the end of the beginning of a previous DevOps era.

  • Quality Is a Top Challenge for Data-Driven Projects

    Quality Is a Top Challenge for Data-Driven Projects

    Software systems continue to produce more and more data. And making use of it has proven benefits — so much so that many analysts have, over the years, referred to data as the new oil. As a result, the majority of organizations are expending effort into refining their data — in fact, a recent study found that 84% of organizations have either already deployed or have data-driven projects on their roadmaps.

    Corporations like Facebook and Google are the poster children for business models that harvest and monetize end-user data. However, this is only one aspect; valuable data is being produced by internal systems as well, which, if leveraged correctly, can provide insight into software observability and increase process automation for DevOps teams and developers. For example, time-stamped application logs are necessary for informing SLOs to maintain reliability standards. There is an ongoing parallel investment into AI/ML deployed with cloud-native tools to act upon production data to drive further business growth. As such, 63% of IT decision-makers say new revenue opportunities have emerged due to data and analytics.

    The 2022 Data & Analytics Study, conducted by Foundry (formerly IDG Communications), explored how data-driven initiatives continue to be an important investment area for executive leadership. Below, I’ll review the key results from the survey to consider how organizations can continue to make intelligent decisions now and into the near future.

    The State of Data-Driven Investments

    We undoubtedly live in a data-driven world, and investment in related projects continues to rise. More than half (55%) of IT decision-makers plan to increase their data-focused investments — the report found the average spend to be $12.3 million in the coming year. This figure rises to an average of $23 million for financial services, which makes sense given the nature of modern banking.

    Naturally, the use of analytics platforms is increasing in tandem with the amount of data generated. In terms of specific analytics tools, 50% of respondents said they used business intelligence platforms while 47% used relational databases and 19% planned to invest in them in the next one to two years.

    We’re also noticing an increasing use of cloud-based solutions. For example, 27% of an organization’s data analytics workloads now run in the cloud. The report also found an uptick in cloud-based enterprise-scale data warehouse technologies, an area that shows signs of increasing in the coming year.

    Common Objectives

    So, what are the most common driving factors behind these types of projects? Well, automating internal business processes is the top goal for data-driven projects—half of IT leaders described this as a primary objective. This is closely followed by other ambitions such as improving customer insights (46%), aiding customer support (43%) and automating IT operations (43%).

    In terms of type, transactional data tends to be the most useful—54% of companies are using transactional data in their data-driven projects. This includes consumer purchasing behaviors such as sales, returns and credits. The next-most-common type is machine-generated data, which includes information from logs, sensors, telemetry, networks, security systems and/or IoT devices. The third-most-common type is customer profile information.

    Data has a powerful impact in a business context as a means to refine existing digital products. Other respondents added that a data-driven approach to DevOps helps increase visibility and drives continuous improvement.

    Data Quality: Highest Ranked Challenge

    Undoubtedly, particular challenges remain. The greatest hurdle is retaining data quality—41% of organizations reported dealing with this issue. Quality may be poor because data is unstructured or incompatible with other sources. Other widespread challenges include governance issues and integrating data from multiple sources.

    For those undertaking data-driven projects, 44% said they lacked appropriate skillsets, such as analytics training, data management, security, business intelligence and integration expertise. Companies also often faced funding and talent-related quandaries when beginning data-driven projects. For example, 26% of small-to-medium-sized businesses lacked the necessary funding to take on data-driven projects, according to the research.

    Another challenging area (that I’ve covered previously) is optimizing how data is collected and stored. As cloud storage fees rise, organizations will likely want to refine retention and resolution to avoid creating unnecessarily large, expensive data lakes.

    Rising Deployment of AI/ML

    AI/ML is already well-established as a way to advance the use of data. More than half (54%) of companies used predictive analytics or planned to incorporate it into their systems in the next 12 months. Just under one-third (31%) also either used or planned to use anomaly detection in the future. These areas along with other functionalities (such as natural language processing and predictive analytics) can be used to aid applications such as process automation, decision support, customer analysis, virtual agents and others.

    The industry is at an exciting moment for leveraging data in DevOps. Data is becoming more and more accessible to enable DevOps with a full-stack picture of the application life cycle. To direct future engineering investment, data-driven decisions will rely on things like performances and usage habits. Thus, it’s an interesting time to consider how you might leverage data for greater process automation and software development fluidity.

    The 2022 Data & Analytics Report surveyed 872 IT decision-makers (ITDMs) from around the globe working in various industries. The respondents’ average company size was about 12,000 employees. To view the report for more insights, you can pick it up here.

  • ServiceNow Adds Lightstep Notebooks to Visualize Observability Data

    ServiceNow Adds Lightstep Notebooks to Visualize Observability Data

    ServiceNow today added a visualization tool to its Lightstep observability platform that will make it simpler for DevOps teams to correlate metrics, logs and traces.

    Ben Sigelman, general manager for Lightstep at ServiceNow, said Lightstep Notebooks will make it easier for DevOps teams to make sense of the massive amounts of data collected by the observability platform.

    Lightstep Notebooks is an extension of the Change Intelligence analysis engine that ServiceNow already makes available within an observability platform it acquired in 2021.

    Included with Lightstep Notebooks are a set of ad hoc charts that include access to heat maps and time-series data with trace exemplars using the database at the core of the Lightstep observability platform.

    An instantly generated investigative path also makes it simpler to identify the root cause of any issue, and each instance of Lightstep Notebooks can be shared with other members of the IT organization via an embedded link. Finally, 100% of trace data can be retained for up to three days.

    Sigelman said the ability to share Notebooks via embedded links will also help bridge the divide between DevOps and IT service management (ITSM) teams that often need to collaborate to resolve an IT issue.

    Naturally, the level of collaboration between those teams tends to vary widely by organization. However, as DevOps best practices are more widely embraced, the number of organizations that are trying to achieve that goal continues to steadily increase. Earlier this year, ServiceNow added an incident response offering to orchestrate on-call escalation, group alerts and provide analytics in further pursuit of that goal.

    Observability platforms aggregate the collection of logs, metrics and traces in a way that makes it possible for DevOps teams to query that data. The goal is to make it easier for DevOps teams to both identify the root cause of an IT issue and pinpoint any anomalies that might disrupt an application environment. The goal is to eliminate the need to convene a “war room” meeting that requires IT teams to suffer through the painstaking process of elimination to identify the root cause of an issue.

    Of course, before an IT environment can be observed, it needs to be instrumented. Thanks to advances in the form of open source agent software being advanced via the OpenTelemetry project managed under the auspices of the Cloud Native Computing Foundation (CNCF), it’s becoming less costly to instrument IT environments. That’s especially critical at a time when more DevOps teams are deploying microservices-based applications that are more complex to manage than legacy monolithic applications. While generally more resilient, the dependencies that exist between the microservices that make up an application can be difficult to identify without the aid of an observability platform.

    As a core DevOps tenet, the need for observability and instrumentation has always been apparent. The challenge has been finding the best way to achieve that at an acceptable cost, Fortunately, there is now no shortage of observability platforms. The only remaining issue is to determine which one best fits within the construct of the organization’s defined DevOps workflow.

  • Improving Observability With ML-Enabled Anomaly Detection

    Improving Observability With ML-Enabled Anomaly Detection

    Nowadays, DevOps and SRE teams have many tools to access and analyze logging data. However, there are two challenges that prevent these teams from resolving issues in a timely manner: 

    • They aren’t equipped with all the data they need
    • Detecting and resolving issues is reactive and manual

    In this article, I’m going to break down why these challenges persist and propose a new approach to observability that will help you overcome them.

    Observability Obstacles

    Challenge: You’re not analyzing all your log data

    DevOps and SRE teams need to understand the behavior of their applications and services to spot anomalies as they occur and keep them up and running. However, the cost of traditional logging platforms prevents these teams from analyzing 100% of their observability data. 

    Instead, they have adopted mechanisms to reduce ingestion volumes. In some cases, this means truncating or filtering out datasets. In others, it means moving data to a less active storage tier/target where analytics are not applied. Furthermore, engineers have to predict upfront which datasets are important and meet the criteria to index. It’s these datasets that teams have the ability to analyze in real-time. The rest are ultimately neglected.

    The net impact is that teams are left with an incomplete picture of their environment, making it difficult to understand how applications and services are behaving. As a result, they cannot pinpoint every issue as it occurs.

    Challenge: Traditional platforms create reactive and manual processes

    When working with traditional observability platforms, teams must constantly define logic to detect issues in their environment. And often, they are only able to detect the issues that they are aware of and have had time to build logic for. To keep alerts firing correctly, you have to stay on top of different data structures, changing data shapes, new schemas and libraries, and fluctuating baselines. 

    However, not every team is equipped to detect issues they haven’t seen before. When teams are faced with unknown behavior, they are left conducting a post-mortem debug which is inherently a reactive process. Furthermore, it is increasingly hard to resolve the issue quickly because logging data is often unstructured and difficult to search. Teams have to manually hunt through loglines to pinpoint the activity and affected systems or components. This approach can add hours or even days to an investigation.

    Improving Incident Response

    The solution: Machine learning-enabled anomaly detection and resolution

    To catch every issue and speed up incident investigations, teams can apply machine learning at the data source to detect potential threats and equip teams with the information they need to keep their applications and services running. This kind of approach allows engineers to analyze 100% of their log data and compile it in a consumable and actionable view so that they can spot changes in behavior and resolve anomalies quicker than the traditional approach.

    As loglines are created, they can be automatically analyzed and converted into insightful metrics that inform application and service behavior. From there, federated machine learning can be used to automatically detect and alert on an issue as it occurs. It does so by baselining key metrics, understanding when they’re outside of typical ranges, and determining the likelihood of anomalous behavior—all through machine learning.

    There is no need to continually build and refine logic, effectively eliminating overly manual engineering practices.

    When an issue occurs, developers and DevOps engineers will receive a detailed report of the specific changes in activity within their systems. In this report, they’ll see the exact window of time of the incident and the affected systems or metadata. This report also includes a pinpointed capture of the relevant raw data that contributed to the anomaly, as well as systems, components, or services that were involved.

    Finally, the relevant full-fidelity logs can be dynamically streamed to a central observability platform (Splunk, Datadog, etc.) before, during and after the anomaly. This gives teams the exact data they need to resolve the issue in a timely manner.

    In all, this kind of edge observability allows system administrators to analyze all of their logs all of the time—not just ones that match the pre-defined query in a centralized setup, saving tons of time when it comes to incident response.

  • Splunk Adds Data Management Tools to Observability Platform

    Splunk Adds Data Management Tools to Observability Platform

    At its .conf22 event, Splunk today announced it is making it easier to both onboard data and then manage it across hybrid IT environments via the Splunk Cloud Platform.

    In addition, Splunk Enterprise is being extended to add support for Microsoft Azure with SmartStore for Azure to store cold data alongside existing support for Amazon Web Services (AWS) and Google Cloud Platform (GCP). There is also a developer edition of Splunk Cloud that enables developers to create and test their own applications, which is currently in preview.

    Garth Fort, senior vice president and chief product officer for Splunk, said the overall goal is to make it easier to automatically tune the parameters used to store data in the Splunk observability platform. As more organizations embrace observability as a DevOps best practice, many of them are encountering challenges managing the large volumes of data they are now collecting in the form of logs, metrics and traces.

    The Data Manager for Splunk Cloud Platform will initially be made available on AWS and Azure, with support for GCP to come later this summer. In effect, it provides IT teams with a control plane for data management that spans multiple clouds.

    Ingest Actions, meanwhile, makes it possible to apply granular controls that enable IT teams to filter, mask and route data in motion within the Splunk Platform or to external AWS S3 cloud storage services.

    Other capabilities Splunk unveiled at the conference include an expansion of Federated Search tools to enable a single pane of view across their entire Splunk ecosystem and a fully managed Splunk Assist service for Splunk Enterprise 9.0 that provides customers with deep insights into their security environment.

    Finally, the company has enhanced Splunkbase, a framework for accessing curated collections of more than 2,500 applications and integrations provided by Splunk and its third-party partners.

    As the pioneer of IT operations analytics, Splunk has a large footprint within enterprise IT environments. It is now looking to expand that base to become an observability platform provider. It’s still early days as far as the transition to observability is concerned, but the goal is to make it simpler for IT teams to query platforms and surface issues that could lead to an IT disruption before it happens.

    It’s not clear how many organizations have the skills and expertise required to formulate those queries, but over time it should become more feasible to augment an IT staff with machine learning algorithms capable of discovering those issues.

    In the meantime, IT organizations are collecting more data than ever about their IT environments. In theory, that data will provide the context needed to optimize application environments that get more complex with each passing day. The challenge, of course, then becomes finding a way to efficiently store and manage all that data both before and after it has been analyzed.

    Regardless of the approach to observability, the need to go beyond simple monitoring of IT environments has never been more apparent.

  • LogicMonitor Expands Reach and Scope of Observability Platform

    LogicMonitor Expands Reach and Scope of Observability Platform

    At its LM Elevate user conference, LogicMonitor today formally launched LM Envision, an observability platform that incorporates artificial intelligence (AI) to both discover and then remediate issues.

    LogicMonitor CEO Christina Kosmowski said LM Envision is the only observability platform available via a software-as-a-service (SaaS) model that can be applied to both on-premises and cloud applications. In total, there are already more than 2,000 integrations for the platform as part of the open LM Envision ecosystem, she noted.

    Over the last year, additional capabilities have been developed and added to the observability platform. These include application performance monitoring (APM) tools to identify bottlenecks and optimize performance, expanded support for public clouds and Kubernetes environments, integration with the StackStorm automation platform, integration with Terraform infrastructure-as-code tools and more advanced tools for searching logs.

    The company has also extended its AI operations tools to provide more context when troubleshooting issues by aggregating logs and including topology tools and graphs.

    Finally, LogicMonitor has added a push metrics application programming interface (API) to make it simpler to ingest data, pre-integrated dashboards and support for open source OpenTelemetry agent software.

    Kosmowski said it’s only a matter of time before observability and AIOps converge to the point where IT teams will finally be able to spend less time managing platforms. One of the major challenges IT teams face is that each platform they use requires its own framework to monitor and manage it. As observability and management frameworks converge, the overall overhead associated with managing modern IT environments should steadily decline as machine learning algorithms make it easier to surface issues before they create a major disruption, she noted.

    The overall goal is to close the loop between the discovery of an IT issue and its remediation, Kosmowski added.

    Observability, of course, is one of the core tenets of any set of DevOps best practices. Achieving it, however, has always been a challenge. The goal now is to eventually replace the hodgepodge of monitoring tools that track a limited set of pre-defined metrics with an observability platform that not only aggregates metrics but enables DevOps teams to launch queries and surface IT issues. In some instances, the rationalization of monitoring tools will help justify the acquisition of an observability platform. The paradox is that, as IT environments become more complex, it may actually become easier to manage those environments as more applications become instrumented and the various silos that isolate IT teams from one another start to collapse.

    In the meantime, there is no shortage of observability platform options. The primary difference between each of them is the degree of integration they provide and their ability to employ AIOps to automatically resolve issues, said Kosmowski. Each minute DevOps teams don’t spend on managing IT platforms is a minute that can be applied to spurring innovation, she added.

    One way or another, DevOps teams will soon have more access to information about their IT environments than ever. Less clear is how much of the data being collected by observability platforms will actually constitute actionable intelligence. But as observability continues to evolve, it’s now more a question of the degree to which that goal will be achieved versus if or when.

  • Opportunities and Challenges of Observability

    Opportunities and Challenges of Observability

    Observability platforms that unify metrics, logs and traces across applications and IT infrastructure are transforming how IT is managed. Most DevOps teams today are able to continuously monitor IT environments using tools that track a set of pre-defined metrics; observability platforms make it possible to aggregate data so that DevOps teams can launch queries that help them uncover the root cause of IT issues. DevOps teams leverage observability to allow them to understand what is happening within their applications more effectively and efficiently.

    Historically, applications were black boxes—meaning it was (and still is, in many cases) extremely difficult to know what is happening under the hood of the application.

    With the advent and subsequent growth of observability tools and techniques in the DevOps space, teams went from struggling to collect and understand the available data (which could vary from robust to almost non-existent) to easily aggregating data from numerous sources and being able to understand what that data means to being completely deluged with data—so much data it’s hard to keep up.

    Gather Data is No Longer Enough

    Josh Chessman, vice president of strategy and innovation at IT infrastructure monitoring specialist Netreo, explained that as applications become more and more complex, (e.g., running across multiple disparate environments with different technologies and in different locations) being able to collect data from these different environments is no longer enough.

    “Instead, DevOps engineers need to be able to collect the data and efficiently analyze it, too, to understand what is happening within the application,” he said. “Observability is the concept that drives this.”

    Chessman pointed out there are numerous observability issues DevOps teams face, but that they vary from organization to organization (and sometimes from team to team within an organization). 

    “Part of the problem is that many organizations simply lack tools to provide the data collection and analysis needed to move to an observability paradigm,” he said.

    This could be for numerous reasons, including budget (if you already have an existing tool, can you afford to acquire a new tool?), functionality (not all tools that claim to provide observability really do), implementation (this stuff is not easy and a poorly implemented tool could actually make things worse) and more.

    “One of the larger challenges I’ve seen is that organizations will go out and acquire an ‘observability’ tool and assume that is all they have to do,” Chessman said. “Unfortunately, that is not the case. Acquiring the tool gets you the technology, but the team must also be structured and ready to take advantage of the concepts and functionality provided by the tool.”

    GitLab’s senior director of product management Kenny Johnston explained that, on average, DevOps teams use five different observability tools which tend to inadequately connect developers to observability.

    In turn, developers struggle to respond to incidents swiftly while jumping across multiple tools and sources of truth and struggle to assign service level objectives (SLOs) and error budget definitions to the responsible product development teams.

    “To remedy this, we recommend adopting a unified software development solution that replaces the DIY ‘duct tape’ of products constraining developers and helps them deliver software more securely, at speed and scale,” he said. 

    Johnston said the most flexible and future-proof solutions today are open source tools like Prometheus and its ecosystem, as well as the OpenTelemetry toolset for more advanced use cases such as tracing.

    Prometheus has become very common in the developer space and, unlike other open source solutions or libraries, its format automatically emits metrics.

    “This allows for simple and future-proof interoperability, as one of the hardest things to change later down the line is code running,” he said. “Using open standards reduces the need for developers to rewrite and reintegrate the same type of code over and over again.”

    Observability Requires Understanding Your Goals

    From Chessman’s perspective, understanding what your goals are is critical for observability. 

    “Observability tools can do many things, but their primary function is to collect and analyze data,” he said. “While that is all well and good, if you do not define your KPIs from the beginning, all the collected and analyzed data is meaningless since you have no concept of what good and bad are.”

    Trying to define good and bad from the data collected is likely to result in failure because you are looking at where you are to figure out where you want to go.

    KPIs vary from application to application and, if you do not have them identified and well-defined before beginning down the observability path, it is that much harder, he said.

    Most tools (observability or otherwise) are capable of collecting hundreds if not thousands of metrics, but not all—not even most, in many circumstances—will be relevant to an organization. 

    “Instead of having to sift through the cruft to find the valuable data, it is better to start with identifying the valuable data and then figure out how to get there,” Chessman said. “If you don’t identify your KPIs in advance you could end up using the wrong KPIs for the wrong scenarios.”

    Johnston added that KPIs, like DevOps, are an iterative process and starting with KPIs helps developers create systems that can meet performance and availability expectations.

    “It’s important that DevOps teams continuously review their KPIs to allow for regular feedback on successes and failures,” he said.

    From his perspective, the best place to start for maintaining and improving observability is by storing observability definitions, instrumentation, SLOs, thresholds, incident response templates and dashboards as code.

    “This allows for rapid improvement via code changes by any team member, whether that’s a site reliability engineer (SRE), developer or platform team,” he said. 


  • Datadog Adds Support for OpenTelemetry Protocol

    Datadog Adds Support for OpenTelemetry Protocol

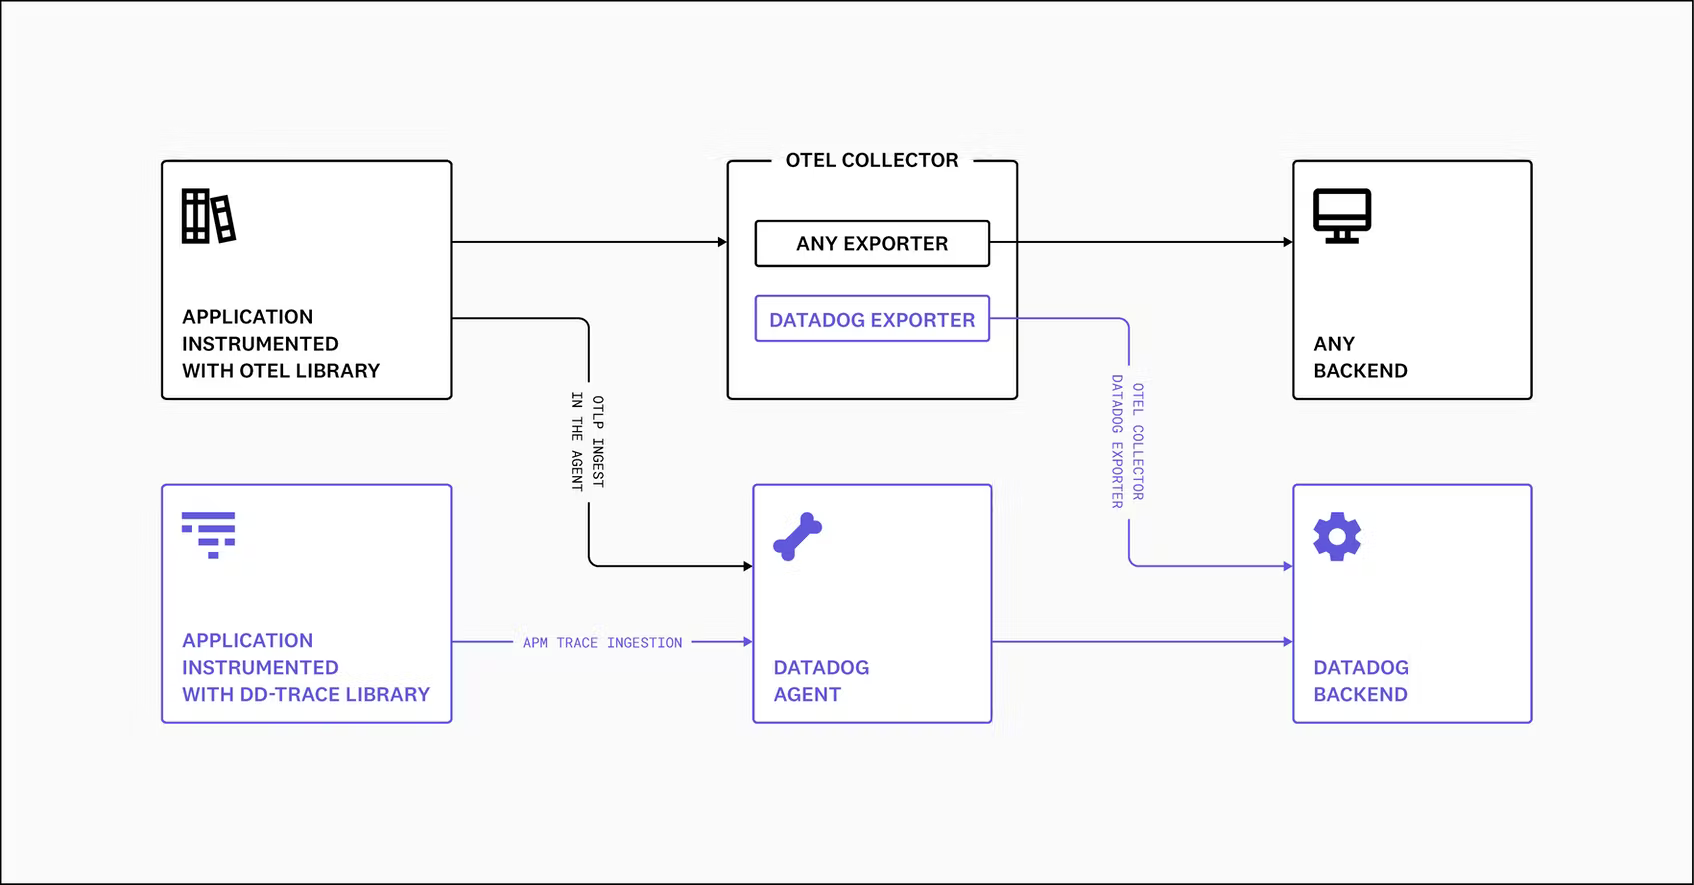
    At the KubeCon + CloudNativeCon Europe 2022 event, Datadog announced it made support for the OpenTelemetry Protocol (OTLP) generally available in the agent software it provides to instrument applications.

    Ilan Rabinovitch, senior vice president of product and community at Datadog, said that capability eliminates the need to install a separate OpenTelemetry collector to aggregate metrics, logs and traces from applications instrumented using the open source OpenTelemetry libraries being advanced under the auspices of the Cloud Native Computing Foundation (CNCF).

    The Datadog Agent can already collect application profiles, network data and infrastructure metrics via more than 500 integrations provided by Datadog. OpenTelemetry extends that capability with a set of application programming interfaces (APIs) and a wire protocol for instrumenting applications.

    Datadog is the latest in a series of providers of observability platforms that added support for the OpenTelemetry project that continues to gain momentum. The goal is to make it less costly to instrument applications using open source agent software that surfaces a consistent set of interfaces. Previously, each observability platform provider developed their own agent software that DevOps teams would need to install. Datadog is making a case for agent software that, in addition to collecting data from existing applications, is now compatible with the OLTP protocol created by contributors to the OpenTelemetry project.

    The issue that DevOps teams will need to come to terms with is that while OpenTelemetry agent software is free, many of them have already installed proprietary agent software to instrument applications. That agent software can often provide additional context that is not yet available in OpenTelemetry. History, however, shows that, in time, open source projects with larger numbers of contributors will outpace the ability of any single vendor to innovate.

    One way or another, DevOps teams will be instrumenting more applications as more microservices-based applications are deployed. The dependencies that exist between microservices make it too difficult to manage an application environment without additional instrumentation. The goal within many DevOps teams is to eventually replace the hodgepodge of monitoring tools that track a limited set of pre-defined metrics with an observability platform that not only aggregates metrics but enables DevOps teams to launch queries and surface IT issues before they become a major issue. In some instances, the rationalization of monitoring tools will help justify the acquisition of an observability platform.

    Observability, of course, is one of the core tenets of any set of DevOps best practices. Achieving it, however, has always been a challenge. Rabinovitch said an observability platform that regularly surfaces critical IT issues without requiring DevOps teams to launch queries to search for anomalies will eventually win the battle for observability supremacy.

    In the meantime, there is already no shortage of observability platforms. The challenge will be determining which one enables the highest level of instrumentation at the most reasonable cost.

  • New Relic Expands Scope of Observability Reach

    New Relic Expands Scope of Observability Reach

    At its Futurestack conference, New Relic announced it expanded the integrations and tools it provides for its observability platform and added its first cybersecurity tool.

    The company now provides more than 470 integrations with cloud services, open source tools and other enterprise technologies, with support for offerings from Akamai, Atlassian, CircleCI, Cloudflare, Netlify, PagerDuty and Postman now being added to its Instant Observability platform. The company has also added the ability to now collect logs alongside metrics and traces within its Application Performance Monitoring (APM) offering.

    Finally, New Relic has deepened its cloud ties with Microsoft, added a guided user onboarding interface, support for a wider range of instrumentation methods, tighter integration with Kubernetes and, for the first time, is branching out into the realm of cybersecurity via a New Relic Vulnerability Management service that is being added to its software-as-a-service (SaaS) portfolio.

    Ishan Mukherjee, group vice president for product go-to-market at New Relic, said New Relic Vulnerability Management is the start of a larger effort to enable IT teams to leverage the observability data they already collect via the New Relic platform to drive the adoption of DevSecOps best practices. Legacy approaches to vulnerability management create yet another silo of data that only further aggravates cybersecurity blind spots, he noted. New Relic Vulnerability Management aggregates data collected via its agent software and integrations with a wide range of platforms to provide a unified view of the overall security posture of an IT environment, Mukherjee added.

    It’s still early days as far as adoption of observability platforms is concerned, but it’s apparent that platforms that unify the collection of metrics, logs and traces across both applications and the IT infrastructure they run on are transforming how IT is managed. Most DevOps teams today are able to continuously monitor IT environments using tools that track a set of pre-defined metrics; observability platforms make it possible to aggregate data so that DevOps teams can launch queries that help them uncover the root cause of an IT issue. That capability is increasingly becoming critical as IT environments—thanks, in part, to the rise of microservices and cloud computing environments—become too complex for IT teams to manage using legacy tools.

    The challenge is that most IT teams are not quite sure what questions they should ask to get the most value from investment in an observability platform. Observability platforms that accurately surface issues without requiring much intervention from IT teams are likely to gain the most traction, as the competition among providers of these platforms intensifies.

    In the meantime, organizations might want to start reevaluating roles within their IT teams as it becomes simpler to collaborate around a single source of data. The days when IT teams had to triage issues using disparate tools that surfaced conflicting data may finally be coming to an end. As such, it should become possible for a team of IT professionals to manage a wider range of processes across an extended enterprise IT environment.

    Naturally, it may be a while before observability platforms drive wholesale reorganizations of IT teams, but it’s now more a question of when rather than if that day will come.

  • Splunk Survey Surfaces Gains in Observability

    Splunk Survey Surfaces Gains in Observability

    A global survey of 1,250 observability practitioners, managers and other experts published today by Splunk found that sophisticated observability practitioners are able to cut downtime costs by 90%. That figure is based on an estimated cost of $23.8 million annually for comparative newcomers to $2.5 million. However, only 9% of respondents are advanced enough to be considered observability leaders compared to 59% that are still beginners.

    Those leaders reported they are seeing a 69% better mean-time-to-resolution (MTTR) for unplanned downtime or performance degradation thanks to investment in observability. The survey also noted those same organizations launched 60% more products or revenue streams from application development initiatives in the last year.

    Observability has always been a core DevOps tenet, but achieving and maintaining is a challenge. Most DevOps teams today aspire to be able to maintain some level of continuous monitoring. However, as it becomes easier and less costly to instrument applications, interest is rising in observability platforms that make it simpler to launch queries and investigate anomalies.

    Spiros Xanthos, senior vice president and general manager for observability at Splunk, said observability platforms are clearly driving down the cost of downtime. There is also a clear correlation between organizations that have embraced observability and the number of microservices-based cloud-native applications that have been deployed, he noted. In effect, increased complexity is driving organizations to turn to observability platforms to manage IT environments in the age of the cloud, said Xanthos.

    The survey found 75% of respondents have multiple cloud-native applications that run in multiple environments. Just over one-third (34%) of internally developed applications are based on microservices constructed using containers, with 28% of respondents reporting they exclusively run cloud-native applications on public cloud infrastructure.

    Overall, the survey also found that two-thirds of leaders reported their visibility into application performance is excellent compared to 44% of beginners, while 64% of leaders reported that visibility into their security posture is excellent compared to 42% for beginners.

    The survey also found 59% of leaders can push code to production on demand for most internally developed applications compared to 28% of beginners. A total of 41% of leaders said they can detect problems associated with internally developed applications within minutes compared to 20% for beginners.

    It’s still early days as far as adoption of observability platforms is concerned but, theoretically, IT should become easier to manage even as the number of platforms employed continues to expand. Advances in analytics and artificial intelligence (AI) are improving the signal-to-noise ratio so that not only are more issues being surfaced sooner but that more trusted recommendations are being made, said Xanthos.

    Observability is, of course, a journey. Most organizations are not even quite sure what type of questions they should formulate to get the most value from investment in an observability platform. Organizations should start small, with a finite project to gain an understanding of how to leverage observability more broadly as they gain more maturity, said Xanthos.

    Regardless of the approach to observability, the one thing that is certain is that traditional IT monitoring is no longer sufficient in an era where IT environments get more complex by the day.