Tag: observability

  • New Relic Adds Visualization Tool to Observability Platform

    New Relic Adds Visualization Tool to Observability Platform

    New Relic announced today it has added a visualization tool, dubbed New Relic Explorer, to make it simpler for IT professionals to discover the root cause of issues that adversely affect application performance.

    Buddy Brewer, global vice president and field CTO for the Americas, New Relic, said the goal is to make it simpler for IT professionals to navigate and, ultimately, act on, all the metrics collected by the New Relic One observability platform.

    New Relic Explorer includes a New Relic Lookout capability that enables IT teams to drill down into telemetry data gathered from New Relic One, as well as other third-party sources, and a New Relic Navigator capability for determining the health of relationships between services, said Brewer. These capabilities make it possible to more easily identify correlations, abnormal history and traces that would be, for example, indicative of blind spots or unknown relationships between IT services, Brewer said.

    Just as importantly, IT professionals can more easily discover recent changes to an IT environment, which are most likely the cause of any new issue that is adversely affecting the IT environment, Brewer added.

    New Relic Explorer requires no configuration, and will be included as part of the existing New Relic Full-Stack Observability offering to give IT teams a single unified view of their IT environments, said Brewer.

    As IT environments become more complex, the amount of time spent looking for the root cause of an issue that might only take a few minutes to fix has substantially increased. As a result, organizations are allocating a significant amount of time to convene “war rooms” to identify the source of problems; those problems can now be more readily identified using New Relic Explorer.

    In general, Brewer said, New Relic remains committed to opening up the platform to external telemetry sources, including data collected using open source tools, such as Prometheus and OpenTelemetry agent software, both advanced under the auspices of the Cloud Native Computing Foundation (CNCF).

    New Relic, like providers of similar tools, has recently begun repositioning itself as a provider of an observability platform, rather than of application performance management (APM) tools, that provides insights into both applications and the infrastructure on which they depend. That approach promises to provide IT teams with more context any time an issue arises. As part of that shift, New Relic is making it clear that while it views its agent source as a richer source of telemetry data, its platform can consume relevant data wherever it can be found. New Relic will also remind customers that its agent software, and the other data collection tools it provides, are simpler to install and update.

    The tradeoff, of course, is cost. While open source software itself is free, the total cost of implementing and managing that open source software can be substantial. Regardless of approach, however, the days when IT teams only applied application monitoring tools to their most mission-critical applications because of cost concerns are coming to an end. It has become impossible to manage a modern IT environment made up of both monolithic and microservices-based applications without such capabilities.

  • AWS Taps Grafana Labs to Launch Managed Observability Service

    AWS Taps Grafana Labs to Launch Managed Observability Service

    Amazon Web Services (AWS), in collaboration with Grafana Labs, has added a preview of managed service based on the Grafana observability platform to its portfolio of tools for managing cloud applications and infrastructure.

    The Grafana platform is based on an implementation of the open source Prometheus monitoring platform being advanced under the auspices of the Cloud Native Computing Foundation (CNCF). The implementation curated by Grafana Labs is designed to centralize observability across multiple clusters using the same console.

    Grafana Labs CEO Raj Dutt said organizations running workloads on AWS can now more easily invoke an observability platform that runs on the same cloud platform on which they have deployed application workloads.

    In addition, Dutt noted IT organizations running workloads on AWS can seamlessly upgrade to Grafana Enterprise, which can pull information from third-party data from platforms including ServiceNow, Splunk, Snowflake, Datadog, MongoDB, Oracle, New Relic, Dynatrace, Wavefront and AppDynamics.

    Grafana Labs already offers both an on-premises edition of its platform in addition to a software-as-a-service edition. The edition that AWS is running provides access to an observability platform for applications running on AWS platforms. Organizations that want to apply the Grafana Labs platform to manage applications running on multiple platforms would employ the existing offerings available from Grafana Labs.

    The company also earlier this year added a distributed tracing platform dubbed Grafana Tempo that makes it possible to leverage existing object storage platforms and services to analyze traces. Grafana Labs also rolled out version 2.0 of Loki, which normalizes different structured, unstructured or JSON log formats in a way that allows DevOps teams to extract additional labels as well as enable additional filtering and grouping.

    In general, interest in observability is on the rise in direct proportion to the rate at which IT environments are becoming more complex. As more microservices-based applications are deployed, the level of dependency between them starts to increase exponentially. Attempting to correlate data generated by multiple monitoring tools is next to impossible, so IT organizations are starting to shift toward observability platforms that unify the collection of application and infrastructure metrics in a way that provides more context.

    Competition among providers of these platforms is already fierce, so the alliance with AWS is a notable endorsement of the approach being pursued by Grafana Labs. Less clear is to what degree IT teams will be replacing many of their existing monitoring tools once observability platforms are deployed more widely. Most existing monitoring tools are optimized for a specific class of infrastructure or application; in many cases, eliminating the licensing fees for those platforms would pay for the cost of standardizing on a single observability platform.

    Regardless of the path chosen, the way IT is managed is fundamentally changing. Each IT organization will need to adjust their IT management processes to keep pace with the rate at which IT is now becoming more complex. In fact, the next big issue may not be choosing which observability platform to select as much as it is navigating the profound changes to the internal IT culture that are sure to follow.

  • Sentry Extends Application Performance Monitoring Tool

    Sentry Extends Application Performance Monitoring Tool

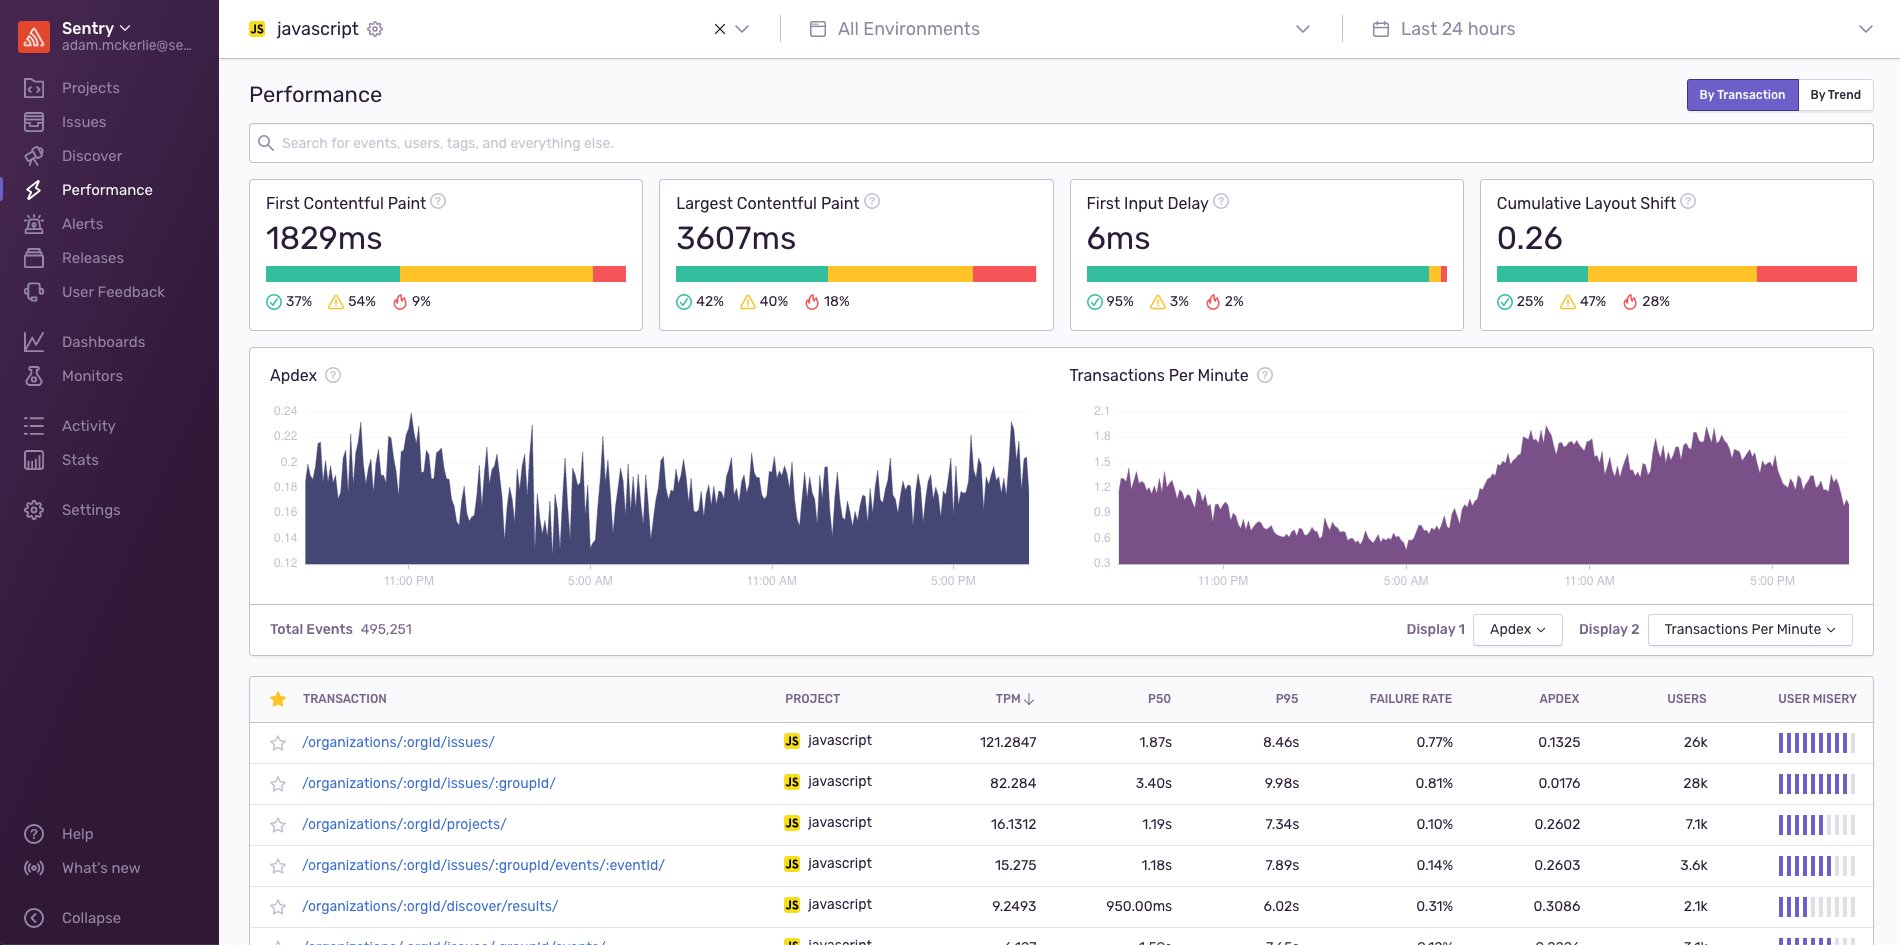
    Sentry this week announced it has added support for applications that employ serverless computing frameworks as well as the Google Web Vitals service to its application monitoring tool.

    Company CEO Milin Desai said incorporating Google Web Vitals metrics into Sentry Performance Monitoring will become crucial as Google makes good on a pledge to rank websites and applications on its search engine based on the metrics it collects via this service.

    Google Web Vitals determines how fast an application is by monitoring how fast a site presents user interface objects. By coupling Web Vitals with transaction data gathered by Sentry, it becomes possible for developers to correlate how a transaction may be adversely impacting the user experience. That data then can be employed to adjust what application programming interfaces (APIs) should be called within an application, Desai said.

    At the same time, he noted a larger percentage of developers are starting to employ serverless computing frameworks within the front end of their applications. The Sentry platform now monitors serverless computing frameworks that are employed within a PHP, Node and Ruby-based application. Most of those frameworks are being used to trigger a specific action when some type of event occurs within an application, said Desai.

    Finally, Sentry has also added a Trends view that enables developers to see the most improved and most regressed transactions that have occurred over time. That capability enables developers to more easily determine when changes to the overall IT environment are adversely impacting their applications. Armed with that data, it then becomes easier to identify what changes were made at that time.

    In general, Desai said there is not enough focus on enabling observability for application developers versus IT operations teams. Sentry Performance Monitoring is designed to enable developers to correlate specific events occurring within their code to actual end user experiences by adding five lines of code to their applications.

    Observability tools for developers will not obviate the need for observability tools for IT operations teams, but Desai noted as far as visibility into applications is concerned, most developers today are flying blind. Observability is supposed to be a core tenet of any DevOps practice. However, the level of observability actually being achieved tends to vary widely among IT organizations.

    Of course, the best place to solve any issue is going to be within the application code, whenever possible. Many developers could eliminate performance issues long before many IT operations teams realize they exist if they had more visibility into how code was executing. That issue will become all the more pressing as IT organizations deploy applications based on microservices that have many dependencies.

    The challenge IT organizations face now is determining not only which observability platforms to employ, but also what level of visibility is required for all the different roles and personas that make up that team.

  • IBM Acquires Instana to Advance Observability Strategy

    IBM Acquires Instana to Advance Observability Strategy

    IBM this week announced it plans to acquire Instana, a provider of an application performance management (APM) platform that is optimized for microservices.

    Robin Hernandez, vice president of hybrid cloud management and AIOps for IBM, said Instana will plug an observability gap that has emerged in IBM’s portfolio as organizations start to build and deploy cloud-native applications more broadly.

    Previously, IBM provided APM capabilities via a Tivoli portfolio of tools that were optimized for core static Java applications, noted Hernandez. Instana will add an APM platform designed from the ground up to automatically instrument applications as they are being deployed by DevOps teams, he said.

    Istana also provides distributed tracing capabilities that the existing Tivoli portfolio lacks, Hernandez added.

    The data collected by the Instana agents injected into those microservices also will play a critical role in IBM’s overall approach to applying artificial intelligence to IT operations, also known as AIOps. The IBM approach to AIOps seeks to combine data from platforms such as Instana and Tivoli with third-party data sources such as ServiceNow to advance IT automation, he said.

    Available both as a software-as-a-service (SaaS) platform and as software that can be deployed in an on-premises environment, Instana has gained traction as organizations have embraced observability as a core tenet of a set of best DevOps practices. Historically, IT teams only employed APM platforms to monitor their most mission-critical applications because of both the cost of the APM platform and the inherent difficulties involved in applying agents pervasively.

    Hernandez said observability takes monitoring to the next level because instead of simply tracking a known set of processes, platforms such as Instana make it possible to observe interactions in a way that discovers unknown relationships and dependencies between applications and infrastructure.

    IBM plans to primarily focus its Instana efforts on microservices-based applications. However, Instana can also be applied to observe existing legacy applications. IBM is still studying that use case as part of its ongoing due diligence, he noted.

    Massive amounts of capital have been pouring into observability startups that are trying to supplant legacy APM platforms as organizations transition to microservices. Providers of legacy APM platforms, meanwhile, are re-engineering their platforms to support microservices-based applications that are most often deployed on Kubernetes clusters. IBM is addressing that challenge via an acquisition that complements its renewed focus on hybrid cloud computing and AI, Hernandez said.

    It’s too early to say which vendors will triumph in the observability wars, but the one thing that is certain is there is no shortage of options. It’s not clear to what degree the shift to observability will result in the rolling up of a variety of tools to manage IT, but the days when IT tools simply monitored a process are starting to fade away.

  • How to Make a Self-Healing IT Infrastructure a Reality

    How to Make a Self-Healing IT Infrastructure a Reality

    In 2019, enterprises worldwide reported that every hour of infrastructure downtime cost them an average of $301,000- $400,000. If a system is down for five hours, that’s $1.5 million lost—and that’s on the low end. Five hours of downtime can impact companies for months down the road. It’s in the hands of DevOps practitioners to ensure systems are up and running and budgets are kept in line. But if they don’t have the proper tools on hand that allow them to juggle their responsibilities while adding value to the business, it makes their jobs that much more difficult—or, dare I say, impossible.

    Teams simply can’t afford to go offline to fix incidents, but neither can they afford to manually sift through data to find the root cause. By automating the incident management process, developers have more time to focus on building new products and capabilities that drive revenue. With a self-healing IT infrastructure, teams can tackle these issues before they become larger issues costing millions of dollars.

    Imagine you’re running to catch a bus and your heart rate increases, but when you sit down, it doesn’t come back down to a normal rate. This could quickly become a much larger, even fatal issue. In this instance, the body should “self-heal” to get back to a normal rate. On a similar note, a self-healing IT infrastructure allows teams to quickly get back on track by fixing issues before they become a $1.5 million problem.

    Let’s look at how DevOps practitioners can turn a self-healing IT infrastructure into a reality.

    Self-Healing Infrastructure Needs Observability and AI

    Observability is the practice of collecting deep data from applications and services to provide insights through three core components: logs, traces and metrics. While these three components are essential to a self-healing infrastructure, they are most powerful when used together. Similar to our senses of sight, hearing and touch, they each tell us something different but are equally important. When combining the power of all three, development teams can determine where, when and how an incident occurred and take action as needed.

    We all know the pain of traditional monitoring tools. They don’t surface immediate issues or identify root causes. They rely too heavily on developers to interpret and analyze immense amounts of data then sift through it in a tedious and time-consuming process requiring extra budget for more human power, and extra time to identify and remediate incidents. Using today’s cloud-native self-service approaches to combine observability and artificial intelligence, teams can set up tools themselves that automate the process of gathering and correlating metrics, logs and traces at machine speed to provide a complete, intelligent and actionable picture of what’s happening and why. And that’s where a self-healing IT system starts.

    The Future Is Within Reach

    By ingesting observability data, applying AI to analyze that data and create insights around root causes, then leveraging automation in a closed-loop, dev teams can not only see what’s happening but also take action on it for remediation. When this closed-loop process is done intelligently at machine speed, that’s when self-healing becomes a reality.

    The idea of a self-healing IT infrastructure doesn’t have to be a distant vision. In fact, the democratization of cloud computing and advanced data science have put the required observability technology within reach of teams of any size with any budget. When artificial intelligence and observability come together, DevOps practitioners can operate less and innovate more.

  • Dynatrace Adds to Observability Capabilities

    Dynatrace Adds to Observability Capabilities

    Dynatrace today announced it has extended its observability capabilities via the launch of its PurePath 4 platform that adds support for the open source OpenTelemetry framework and W3C Trace Context specification for distributed tracing.

    In addition, the company is adding support for service meshes and serverless computing frameworks running on Amazon Web Services (AWS), Microsoft Azure and Google Cloud Platform.

    Alois Reitbauer, chief technology strategist for Dynatrace, said by adding support for open source tools to gather metrics, the total cost of achieving observability is being driven lower at a time when a transition to microservices-based applications is making the need to observe applications more crucial than ever.

    Dynatrace is adding support for OpenTelemetry and W3C Trace Context to a platform that has already supported distributed tracing since 2006 via its OneAgent software. Dynatrace is now becoming the latest provider of observability tools to embrace open source software to instrument applications as part of an effort to focus engineering efforts on advancing analytics capabilities.

    In the case of Dynatrace, those capabilities are driven by a Davis artificial intelligence (AI) engine embedded within the Dynatrace platform and SmartScape continuous topology mapping technology. The combination of those technologies makes it possible for Dynatrace to automatically discover changes to IT environments and surface the root cause of any issue that might arise, noted Reitbauer.

    Despite being widely available via application performance monitoring (APM) tools, distributed tracing is now coming into vogue. As application environments become more complex, there is a need to more deeply analyze events to discover the root cause of an outage or performance issue.

    The challenge has been that applying that level of instrumentation to applications has been costly. Many IT organizations have historically limited the use of APM tools to their most mission-critical monolithic applications. It’s also worth remembering that three-tier applications are easier to troubleshoot because the potential source of any issue is probably already well-known to the IT team, he added.

    Given all the dependencies that exist between microservices, however, Reitbauer said the need to understand what’s occurring within an application environment more deeply is becoming a bigger requirement.

    Observability, of course, has always been a core tenet of best DevOps practices. The level of observability depth required by DevOps teams has tended to vary widely. Increased adoption of microservices-based applications invariably will push more IT organizations toward embracing DevOps at increasing levels of sophistication and maturity.

    In the meantime, the observability wars among platform providers are intensifying. There’s no shortage of options to achieve that observability, so it will be up to each IT team to decide which platform might best suit their DevOps workflow. Dynatrace is betting that as more applications become instrumented, deciding which platform to employ will shift closer to the AI capabilities that enable issues to be resolved issue faster regardless of what type of application is deployed rather than the capabilities of the agent software employed to instrument applications.

  • Scalyr Adds Hindsight Service to IT Analytics Portfolio

    Scalyr Adds Hindsight Service to IT Analytics Portfolio

    Scalyr has moved to reduce the cost of observability by enabling DevOps teams to retain log and event data in S3-compatible object storage systems than use a pay-per-TB-scanned pricing model to interrogate that data.

    Company CEO Christine Heckart said the Scalyr Hindsight service will make it possible for IT teams to more cost-effectively store historical event data if they so choose. This option comes at a time when they are under pressure to reduce the total cost of IT as a result of the economic downturn brought on by the COVID-19 pandemic.

    Scalyr Hindsight complements an existing real-time log analytics platform that Scalyr provides via a software-as-a-service (SaaS) platform. However, IT teams no longer are required to store data in the Scalyr cloud platform itself.

    Heckart said collectively Scalyr Hindsight and the company’s core log analytics platform provide an alternative to custom log analytics platforms based on open source Elasticsearch, Logstash and Kibana (ELK) software that can be difficult to maintain and scale. The core Scalyr log analytics cloud service, built on top of a columnar database, is now capable of ingesting more than 200TBs of data per customer per day in real-time at a price that can be lower than $5 per GB. The Scalyr Hindsight platform only charges fees when data stored is actually scanned.

    With the rise of microservices, analytics that can be applied broadly at reasonable price points has become a major issue. Previously, IT teams might have limited their usage of analytics tools to their most important monolithic applications. Because of the way many of those platforms priced their software, IT teams found it necessary to also limit the amount of data that might be stored in these platforms. Given the complexity of microservices-based applications that tend to have lots of dependencies, an observability platform that provides an affordable approach to gaining insights into modern application environments is now required.

    Heckart said Scalyr also offloads the management of the observability platform from the internal IT team. Given the massive amounts of data that needs to be stored and managed, Heckert noted it’s not uncommon for data lakes that IT teams manage to become swamps simply because there are no dedicated resources to manage them. It’s not clear how many IT teams might be willing to give up managing their own observability platforms in favor of only needing to access analytics tools, but the one thing that is clear is the cost of support open source platforms tends to climb over time. IT teams may find an ELK-based approach initially sufficient only to discover the platform needs to be replaced as the number of applications that need to managed starts to increase.

    Regardless of who manages the underlying log analytics platform, it’s no longer feasible for most internal IT teams to manage modern application environments without the aid of an advanced set of analytics applications.

  • Logz.io Embraces Jaeger for Distributed Tracing

    Logz.io Embraces Jaeger for Distributed Tracing

    Logz.io announced at its online ScaleUp! 2020 conference announced today it has added support for open source Jaeger distributed tracing software to its observability platform based on a curated instance of open source Elasticsearch, Logstash and Kibana (ELK) software.

    Logz.io CTO Jonah Kowall said support for Jaeger extends the reach of the open source platform by enabling the platform to consume data generated by Jaeger agent software, which is now being deployed more widely to instrument complex distributed computing applications.

    Jaeger, which is being developed under the auspices of the Cloud Native Computing Foundation (CNCF), is finding traction among DevOps teams who are deploying microservices-based applications based on containers, which tend to have a lot of dependencies that are challenging to monitor and troubleshoot.

    A survey of more than 1,000 DevOps and software development engineers conducted by Logz.io finds 50% of respondents have half their applications or more running in containers, with 38% using service meshes and 33% employing serverless computing frameworks. The survey also finds 87% of respondents view their main observability challenges to be Kubernetes, microservices and serverless frameworks. The most common Kubernetes difficulties cited are monitoring and troubleshooting (44%), followed by security (35%), networking (34%) and cluster management (30%).

    More than a quarter of respondents (26%) said they already make use of distributed tracing, with 68% reporting they expect distributed tracing to play an important role in their observability strategy. Nearly two-thirds said they expect to implement distributed tracing in the next two years, with 91% of respondents reporting they already employ two or more observability tools. The most commonly used tools are log management and analysis (90%) and infrastructure monitoring (78%).

    Just over half of respondents (56%) also noted that more than half their infrastructure now resides in the cloud, with 42% noting that cloud now accounts for more than 75% of their infrastructure. Amazon Web Services (AWS) is the most widely used cloud (66%), followed by Microsoft Azure (12%) and Google Cloud Platform (11%).

    Kowall said that while interest in employing ELK along with visualization tools such as Grafana is rising to reduce the overall cost of observability, IT organizations are also making it clear they don’t want to integrate an ELK stack themselves. Most IT organizations would prefer to focus their efforts on building and deploying applications rather than maintaining an observability platform.

    The rise of microservices clearly is forcing the observability hand of more organizations. Most application performance management (APM) tools use has been limited to mission-critical monolithic applications because of the cost of deploying proprietary agents and platforms. Open source platforms now present an opportunity to observe both microservice and monolithic applications at a time when the overall IT environment has become much more difficult to manage.

    There is, of course, no shortage of options when it comes to achieving the observability of IT environments. The challenge now is determining how much observability is actually required and at what level of acceptable cost.

  • Algorithmia Allies With Datadog on MLOps Observability

    Algorithmia Allies With Datadog on MLOps Observability

    Algorithmia today launched a performance monitoring for machine learning (ML) model that tracks algorithm inference and operations metrics generated by the enterprise edition of its namesake platform for building these models.

    Company CEO Diego Oppenheimer said Algorithmia Insights provides a level of observability into ML models that DevOps teams have come to expect from applications. To make that monitoring capability more accessible, Algorithmia has partnered with Datadog to stream operational and user-defined inference metrics from Algorithmia to the open source Kafka data streaming platform, from which the Datadog Metrics application programming interface (API) can consume that data.

    That capability will enable DevOps teams that have adopted the Datadog monitoring platform to employ a single pane of glass to both monitor their IT environments as well as detect data drift, model drift and model bias with an ML model, Oppenheimer said.

    As organizations infuse ML models into applications many of them are encountering DevOps workflow challenges. It can take six months or more to develop an ML model, which then needs to be embedded with an application that often is updated several times a month. At the same time, organizations are discovering that ML models often need to be replaced either because assumptions about business conditions have changed or additional relevant data sources have become available. In many cases, data scientists have adopted DevOps principles to create a set of best practices known as MLOps to update their models.

    The alliance with Datadog is significant because it enables IT teams to start melding DevOps and MLOps processes, noted Oppenheimer.

    At this juncture, it’s apparent that almost every application to varying degrees will eventually be enhanced using machine learning algorithms. Most of the data scientists that create these models, however, have little experience deploying and updating ML models in a production environment. It’s now only a matter of time before ML models become just another artifact flowing through a DevOps workflow. Organizations that have invested in ML models, however, will need to spend some time bringing together a data scientist culture that is currently distinct from the rest of the IT organization.

    To further that goal, Algorithmia earlier this year made it possible to write and run local tests for algorithms as shared local data files. Desktop tools that have been integrated with that process include PyCharm, Jupyter Notebooks, R Shiny, Android, iOS, Cloudinary, Datarobot and H2O.AI.

    A recent survey of more than 100 IT directors conducted by Algorithmia finds the COVID-19 pandemic has required 40% of survey respondents to make adjustments to at least half of all their AI/ML projects either in terms of priority, staffing or funding. Over half the respondents (54%) said AI/ML projects prior to the pandemic were focused on financial analysis and consumer insight. In the wake of the pandemic, survey respondents said more of their AI focus is now on cost optimization (59%) and customer experience (58%).

    The survey also notes respondents were spending at least $1 million annually on AI/ML prior to the pandemic, with 50% saying they are planning to spend more than that going forward. Overall, nearly two-thirds (65%) said that AI/ML projects were at or near the top of their priority list before the pandemic, with 33% now saying these applications are now higher on their list.

    It may be a while before every DevOps team regularly encounters ML models, but at this point, it’s more a question of when rather if before DevOps processes expand to include ML model artifacts.

  • The Value of OpenTelemetry in Observability

    The Value of OpenTelemetry in Observability

    As infrastructure becomes more complex, the quest for better observability continues. With increased containerization, third-party applications and generally increased network complexity, it becomes difficult for organizations to track issues of stability and performance. But OpenTelemetry can be used to improve upon observability throughout a network by enhancing and consolidating reporting throughout all applications and services.

    So, what is OpenTelemetry and how can it help your organization’s processes? Here’s what you need to know.

    What is OpenTelemetry?

    OpenTelemetry is a Cloud-Native Computing Foundation (CNCF)-curated open source set of libraries, agents and components designed to increase the visibility of services. Through OpenTelemetry, organizations are able to better collect telemetric data for the purposes of debugging and management. A scalable, flexible solution, OpenTelemetry is able to adjust to organizations as they continue to grow.

    With OpenTelemetry, data is collected through:

    • Metrics
    • Distributed Traces
    • Resource Metadata
    • Logs

    The data is then sent to back-end platforms such as Jaeger or Prometheus for processing. All of this together enhances observability for the organization, making it easier for an organization to collect the data it needs to observe and mitigate issues appropriately.

    Greater levels of observability improve an organization’s reliability and reduce downtime. With better reliability, organizations are able to track down and resolve incidents much faster. Before the OpenTelemetry solution, developers might have used OpenCensus, OpenTracing or other similar products. While these products are excellent on their own, they don’t necessarily meet all the needs of modern networks.

    How Does it Work?

    OpenTelemetry works on three major observability systems: tracing, metrics and logging. For tracing, OpenTelemetry makes it easier to identify failures and performance issues by tracking requests within the system. For metrics, processes running within the system are closely tracked and reported on, with histograms, gauges and other easy-to-read graphical reporting. For logging, application-specific messages can be analyzed.

    Observability throughout a system has always relied upon tracing, metrics and logging. But it’s more difficult to complete tracing today because each action needs to go through so many layers of application and resources. When paired with vague log data, the process of tracking down a single incident can take hours, because the information isn’t always consistently siloed. OpenTelemetry (and other similar products) work to correct this by creating a consolidated system by which metrics, tracing and logging can be brought together.

    As an open source project, OpenTelemetry is available on GitHub for those who want to be a part of the community to influence and improve it. Of course, OpenCensus and OpenTracing are also open source solutions.

    So what’s the difference between OpenTelemetry, OpenCensus and OpenTracing? When should one be used over the other? And can they be used together?

    OpenTelemetry vs. OpenCensus

    Let’s take a look at OpenTelemetry versus OpenCensus. Both are used to boost observability, but they are generally mutually exclusive platforms because they each tackle the issue of observability from different angles. OpenCensus provides distributed tracing and time-series metrics from applications via a collection of libraries. Applications need to download a metrics exporter, and which one is used depends on the application microservices involved. OpenCensus will collect trace data, but OpenCensus will also collect time-series metrics. OpenTelemetry is used to connect OpenCensus and OpenTracing, providing the benefits of both. This creates a far more robust observability solution.

    OpenTelemetry vs. OpenTracing

    OpenTelemetry versus OpenTracing is similar to OpenTelemetry versus OpenCensus. OpenTracing also solves the same problems as OpenCensus but is usually mutually exclusive. OpenTracing is a specification for tracing APIs rather than library. Developers are able to either create their own tracer or use the OpenTracing version. OpenTracing is often faster and easier to deploy and use, but may not provide as robust analytics or metrics as OpenCensus. But again, OpenTelemetry makes it possible to use both OpenTracing and OpenCensus at the same time, through its consolidated libraries and support.

    OpenTelemetry is an ideal technology for organizations that want to increase their observability. Through OpenTracing, developers are able to achieve greater levels of visibility throughout the network; track metrics and performance; and react to issues within the organization swiftly and more accurately.

    While in the past developers may have been limited to either OpenTracing or OpenCensus, today developers are able to use OpenTelemetry for both function sets. Even better, since it remains an open source solution, developers are able to contribute to the OpenTelemetry community.