Tag: continuous delivery

  • The Future of Continuous Testing: Fail Faster

    The Future of Continuous Testing: Fail Faster

    In the early days of Agile and Lean development practices, a very noticeable gap appeared between dev teams and ops and QA. Development was accelerating at a lightning-fast pace, but testing processes could not keep up, slowing down the entire life cycle and preventing organizations from achieving continuous delivery. Traditional testing methods, which rely heavily on manual processes and frequently updated GUI tests, proved too cumbersome and inadequate for our new lifecycle timelines.

    The era of testing as an afterthought is dying out, and continuous testing has emerged as the new standard. The idea behind continuous testing is pretty straightforward: Implement a systematic approach towards improvement that incorporates not only automation, but also all of the other tools and processes that will help reduce risk before software progresses to release and production. Organizations embracing this are rethinking testing as a continuous process that starts from the sandbox, rather than a precursor to release.

    Continuous Testing: Achieving ‘Fail Faster’

    At xMatters, we strive to a testing strategy that supports our goal of committing to production multiple times per day—one that we’ve been diligently moving closer to, having progressed from releases every quarter to every month to every week to now, twice per week. Our approach is to conduct unit tests at the team level, code quality, sonar and static analysis, and then deploy to production at limited percentages that we bump up in stages. Our overarching mantra is “fail fast,” because the faster and sooner you fail, the faster and sooner you can fix what’s broken, and the less resources and time you will spend troubleshooting and resolving issues. This, of course, translates to real cost savings.

    Correlating failure to actual events is the biggest hindrance to the continuous testing dream, as pinpointing root causes is an incredibly time-consuming process. This is where automation will take us to the next level, if implemented in a smart way. The future of continuous testing will be adaptive so as to determine the causes of failures faster. We need to automate as much as possible the process of predicting where code quality issues are and identifying the precise data correlations that will enable us to fix issues rapidly.

    Part of this adaptive testing approach will include automating intelligent regression testing. We don’t need to run a black box test in every instance, for example, which can take hours every time. We’ll save incredible amounts of time, money and developer resources if we design tests that can detect new changes and only test those. Smarter regression testing will result in precious time saved that ultimately impacts—and can even make or break—the speed of innovation.

    Another critical consideration to smarter testing is making sure to account for a comprehensive understanding of risk. We need to incorporate real business considerations into our understanding of risk and bake those into our tests as well. We should hold our software to not only standards of code quality and integration success, but also to meet real business expectations for areas such as security, compliance and reliability. Testing from the bottom up must be done in tandem with top-down analysis to account for the full spectrum of potential risks that have the potential to impact the bottom line. Machine learning systems can also be extended to learn new business applications as new functionalities are added and assist in creating test cases that serve to enhance the quality of the application.

    Developing these intelligent automation tools remains our biggest barrier to achieving the continuous testing dream, and while many organizations are gunning for it, most are still mired by manual processes. A global study conducted earlier this year by CA Technologies, for instance, demonstrated that while 75 percent of organizations identify continuous testing as important, just 20 percent report a high quality of test automation coverage.

    It’s worth noting that not every aspect of testing can be successfully automated. The vast majority of functional tests will almost certainly not be manual processes—but what about user experience testing? We have yet to conceive of an approach to this that can truly be automated. Because nothing beats a real human’s assessment of experiential quality, this will be one of the areas of testing that will likely remain manual. Thus, while our goal is to automate 100 percent, realistically this won’t be the case.

    The end goal here is not only to achieve the dream of continuous delivery, but also to eliminate distractions as much as possible. The more repeatable processes you can automate, the fewer distractions your team will encounter, and the more they can focus on creativity, strategy and building new features and capabilities instead of fixing old ones. This is what will ultimately determine your ability to innovate, as you’ll no longer have to sacrifice either time, scope or quality.

    About the Author / Deepa Guna

    Deepa Guna is Senior QA Architect for xMatters. She has been working in technology since 2003. Connect with her on LinkedIn.

  • Continuous Testing: Crushing the Testing Bottleneck

    Continuous Testing: Crushing the Testing Bottleneck

    The practice of continuous delivery has been with us for many years, but it has started to see real adoption in the last couple of years. Continuous delivery is about automating and simplifying the process of delivering new features to the market at any given time, accelerating delivery and helping bring Dev and Ops together to make them jointly accountable for the release process.

    As continuous delivery is helping to break down barriers, culture and bottlenecks in the delivery pipeline, a new practice has evolved to help teams solve this most daunting challenge of the delivery pipeline: Quality.

    The practice is called continuous testing, which can be defined as:

    • Testing your change in an efficient way (so your tests are completing faster),
    • In an optimized way (so that you find issues as early as possible in the cycle),
    • Based on risk and priority (so you test what is important to your users and the business).

    Some may think of this as equivalent to test automation, but that premise would be wrong.

    Automated testing tools can execute tests repeatedly, provide reports on testing outcomes and show comparisons with previous test runs. This is a critical foundation for a continuous testing practice, but just a starting point.

    In a continuous testing practice, testing is not done just in the “testing” phase and not only by test teams. Testing is performed at the level of the build (for example, Unit Test and Security Test) and does not stop after the change has been deployed into the production, where testing can ensure great customer experiences. Here are some other key aspects of continuous testing.

    Continuous Testing Automates Test Environments

    Let me clarify what I mean by environment. Basically, you want to replicate the real-world situation much as possible for testing. A test environment contains the test cases to be run, the right test data and services available, and the right application version deployed in the right environment. The juxtaposition of these elements of an environment must come together automatically to ensure a continuous testing practice.

    Continuous Testing Amps Up Throughput

    A key premise of continuous testing is that you are continually maximizing efficiency. This is a must to keep up with the velocity and frequency of today’s modern software factory.

    You are doing testing earlier in the testing cycle (shift left) where problems are easier to fix and less expensive. You are doing more testing in parallel. You are automating the promotion and feedback during testing stages. And you are ideally able to prioritize the testing order based on the risk profile of the code so that you are testing higher risk areas first. All of this enables you to find issues quickly and roll forward if possible or roll back seamlessly.

    Continuous Testing Applies Intelligence

    Finally, continuous testing means you have the knowledge at your fingertips about the risk profile of a release so you can make more informed decisions. You should be able to see what was changed in the code and the implications. For example, was there a small change in the UI or a complex backend change that affected integrations and could break the APIs for the interface?

    You also need a detailed view of the quality level of the release, including which tests have failed, which tests have not been executed, whether you have tested the new or the risky areas. All this intelligence will help you to understand the quality profile of a release and make faster decisions about whether additional tests are needed or if a release is ready to go to production.

    Steps Toward Continuous Testing

    There is no perfectly prescribed way to put a continuous testing practice in place for your organization. For example, you may find that your biggest bottleneck of the moment is managing test data, so you should tackle that first. But here are five steps critical in your adoption of continuous testing:

    Step 1: Implement best-of-breed test automation tools—Functional, GUI, Performance, Security, etc.

    Step 2: Automate test environments with the right test data and virtual services to ensure real-world, always available testing.

    Step 3: Automate test requirements (you’ll find manual methods can no longer keep up).

    Step 4: Automate the automation—Connect your testing toolchain and stages. Automate promotion from one stage to the next. Automate feedback loops end to end.

    Step 5: Get smarter—Automatically align the right tests to the right app version. Automate testing sequence by risk profile of the code. Build release health profiles.

    About the Author / Uri Scheiner

    Uri Scheiner is a senior director of product management in the Continuous Delivery Business Unit of CA Technologies. He was previously a key architect and responsible for the product road map and vision at a leading release automation company Nolio, which was acquired by CA in 2012. Uri started his career as a software engineer at Mercury Interactive (acquired by HP in 2006) where he was responsible for developing several products for the DevOps and APM markets.
  • How an Integrated Tool System Helps Implement DevOps

    How an Integrated Tool System Helps Implement DevOps

     DevOps is the marriage of application development teams with system operations teams, their philosophies and actions.

    In an agile environment, development, testing and operations all must work together to meet frequent iterations, releases and delivery goals. This calls for a collaborative development environment that supports data orchestration with other lifecycle tools.

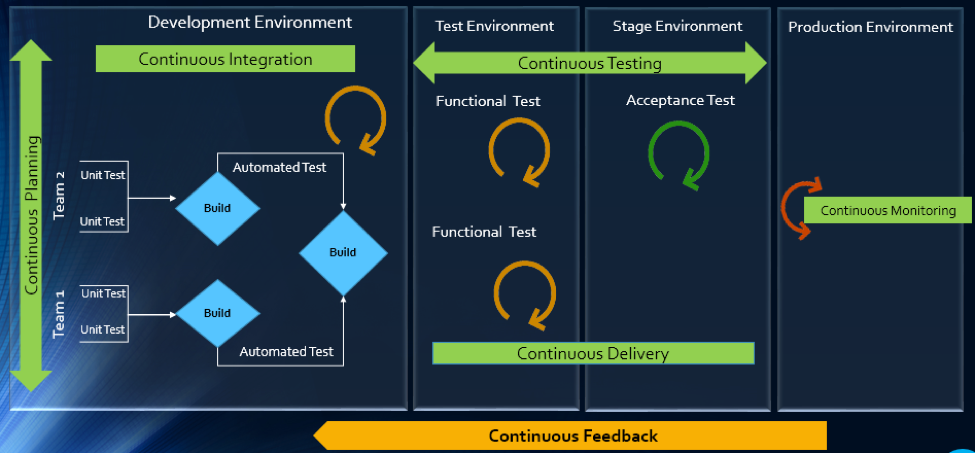
    The article will explain how multitool integration support can help organizations perform the DevOps life cycle, which includes continuous planning, continuous integration, continuous testing, continuous monitoring, continuous delivery and continuous feedback mechanism.

    The Drivers of DevOps

    Today, with the increasing competition and the need for an early market release, the software development industry is undergoing a paradigm shift. Agility has become an inevitable process across all organizations. In addition, shorter ROI cycle spans, frequent releases, increased CRs and different IT systems and tool technologies have made the situation critical.

    The industry demands higher transparency, maximum visibility, minimum turn-around time, lesser human intervention and efficient processes at every stage, from development to delivery.

    However, organizations that use specialized tools to manage builds, deployments and delivery processes continue to face difficulties when it comes to data orchestration and process automation across the tool chain.

    In an agile environment, developers and testers need to ensure not only that code changes work and integrate well, but also  that frequent iterations do not make the product unstable. Hence, seamless cross-tool collaboration is very important here.

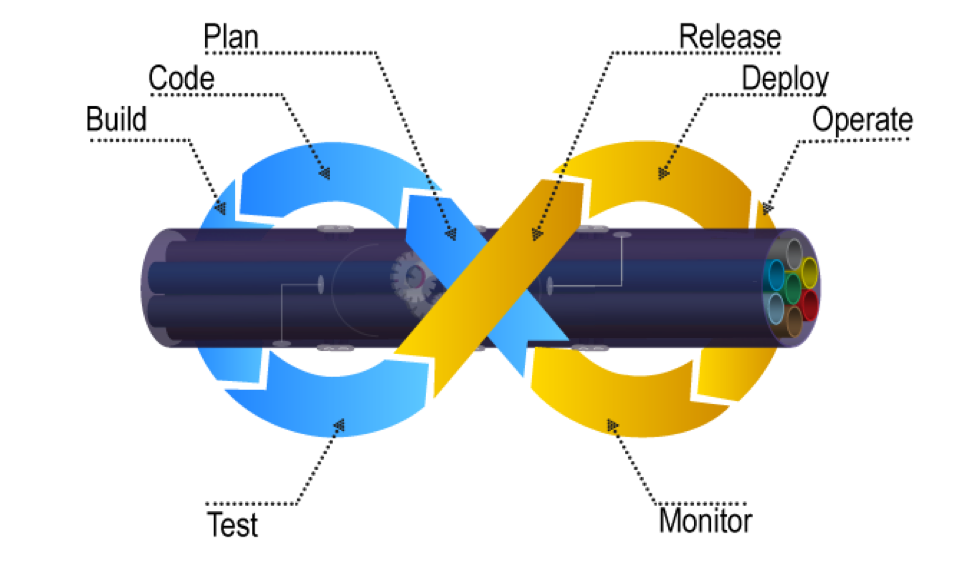
    The process chain consisting of Code –> Build –> Provision –> Test –> Defect Fix –> Deploy –> Release needs to run continuously and smoothly without compromising delivery deadlines or the product quality.

    Automation is the Catch Line

    With the rising demand for continuous delivery and sprint-based development, manually setting up a test, build and deployment environment is burdensome and time-consuming.

    Software teams need to automate the entire cycle of build, provisioning and deployment of test environments, including the tools, scripts and test data to ensure rapid delivery. They also need to collaborate around the application architecture and monitor event-action-based mechanism for seamless data flow across the tool chains.

    Reports show the most important DevOps components are IT automation, agile development and collaborative teaming of personnel. Therefore, without centralized orchestration of tools, achieving DevOps is not a realistic situation. Since organizations spend around 73 percent of their DevOps budget in tool acquisition, it is important they know how to get the tools working together to overcome DevOps obstacles.

    In the process of connecting their existing and new toolsets, most organizations search for an integration methodology that is scalable, reliable and easy to maintain. Point-to-point integration between tools help, but to a limited extent. Even a single change in integration rules involves complex coding and high maintenance across development, test and deployment cycles.

    How ESB-based Integration Can Help

    An enterprise service bus (ESB)-architected integration hub connects both the existing and the new tools to support a seamless data flow between them across the DevOps life cycle.

    Once integrated, the data from both the development and the operations tools become readily available for use to every stakeholder. The benefit of using ESB-based integration is that you can add or remove any tool based on your connectivity requirements.

    In a typical scenario, DevOps teams use a series of cross-functional tools starting from project planning to delivery and operations. Neither of these tools comes with built-in integration features, which results in inconsistent flow of information among tool users.

    Project managers use application lifecycle management (ALM) or Agile planning tools to detail the scope of work and tracking progress reports. Upon unit testing, developers use a different tool to check in a code from their integrated development environment (IDE) to the source code management (SCM) repository. They also perform a code quality analysis before committing to the SCM.

    In such a scenario, continuous integration (CI) can be achieved only when developers bring these planning, unit testing, code analysis and SCM tools under one roof. That is, connecting the tools through a common integration hub. It also helps developers to manage everything from within the IDE.

    After successful check-ins, build engineers trigger the SCM tools for automated build and testing. Upon a successful build, testers engage in continuous testing using manual and test automation tools, followed by provisioning for continuous deployment. They also perform load testing, API testing and security testing using separate tools. An integration support helps to keep the real-time data flowing between the build and the testing tools uninterrupted and seamless.

    A DevOps system also includes application performance monitoring (APM) tool for continuous monitoring of memory consumption, CPU usage, database health and release tracking. Operations team use help desk/ IT service management (ITSM) tools for continuous feedback generation and customer support. And delivery managers use continuous delivery tools for defining and tracking release pipeline through graphical interface.

    When all these tools are connected to a central integration hub, product release and help desk operations become faster and efficient. The integration between development and ITSM tools facilitates continuous feedback generation, which helps to improve the product quality.

    Through an integrated tool ecosystem, project managers can create a DevOps workflow based on business logic and automate the data movement across tool systems. Business analysts, developers, testers and delivery managers can also get real-time update on development progress and keep track of actionable items. Supervisors can route cross-tool data to a central repository and generate meaningful reports and analytics before taking business decisions.

    Fig: ESB Integration Bus Facilitating Adoption of DevOps
    An ESB-based integration tool helps organizations to implement and leverage the best DevOps practices by establishing connections across all participating tools. An integrated tool ecosystem helps achieve the following:

    • Real-time collaboration between development, delivery and operations tools
    • Continuous planning from requirements capturing and review to design and code analysis
    • Cross-tool traceability for defining relationships between various data objects
    • Test strategy implementation for continuous testing
    • Continuous integration through automatic triggering of build on successful completion of code check-in
    • Continuous testing through workflow based automatic triggering of both manual and automated test cases
    • Scheduled test automation script execution enabling continuous delivery
    • Continuous monitoring of release quality through reports and dashboards
    • Automated defect identification and resolution for faster help desk response
    • End-to-end traceability providing better release predictability and change impact analysis
    • Meaningful reports, metrics and KPIs for quick decision-making
    • Continuous delivery through tracking release pipeline

    How Inter-tool Connectivity Brings Continuity

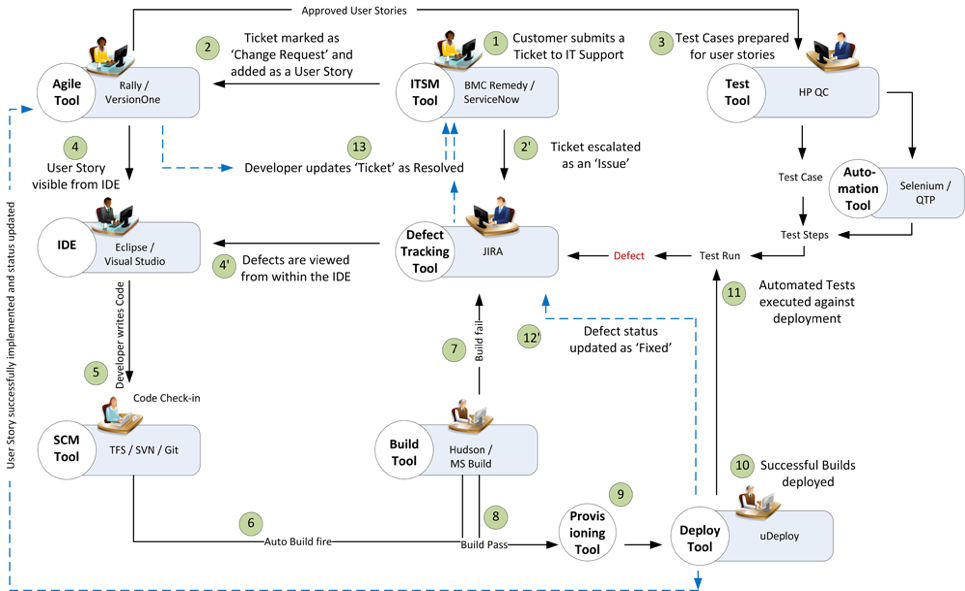
    To understand the stages of engineering practice, let us consider a sample DevOps scenario in an IT service organization.

    The organization uses an ITSM tool to manage support tickets submitted by customers. On submission of a ticket, it is automatically passed on to an ALM tool as user stories or defects for internal development.

    On allotting to a sprint, developers and testers view the user stories or defects from IDE, SCM and test tool. Once the coding is complete and codes get checked in at an SCM tool, an automatic build gets triggered using a build tool. Upon successful completion of the build, tool provisioning is done through a virtual machine.

    The successful build can be automatically deployed using a deployment tool and automated tests can be executed through a test automation tool. The test results are then captured and linked with test cases and the source requirements for traceability.

    The defects that are raised in the defect tracking tool for failed test cases can be automatically routed to developers for fixing.

    Fig: DevOps scenario achieved in a collaborative tool environment

    Once connected to an integrated tool system, users get a complete visibility of the tool records and their relationships from within their own tools. Developers, testers and help desk managers can get complete traceability view between development artifacts and change requests or defects.

    When all the tools participating in DevOps sync with each other, developers can easily view the support tickets reported by the operations team right from their own IDE.

    The help desk team also gets a real-time update whenever a change request gets implemented or a defect is resolved by the development team. It eliminates the latency in communication between the Dev and Ops teams to a great extent.

    In addition, customers get frequent updates from the help desk team, which makes them happy and confident about the product performance.

    Conclusion

    Implementation of DevOps is not a “Do once and forever” type of task. Just deploying the right set of tools to the right users will not serve the purpose. Proper connectivity between and across the DevOps tools chain is necessary if you want to create a collaborative work environment around the Dev and Ops teams.

    An integrated tool system saves considerable amount of time and effort, which would otherwise be wasted on manual execution, monitoring and reporting of data during DevOps implementation.

    About the Author / Sanat Singha

    Sanat Singha is a senior technical and web marketing writer. He takes special interest in ALM process, technologies and tools integration as an industry. Sanat does content marketing, professional blogging, social media promotion and website analytics.

  • Scaling DevOps at Pearson

    Scaling DevOps at Pearson

    Pearson might be one of the more influential companies you have never heard of. Its footprint in the educational publishing marketplace is expansive, and its scope was just one challenge when it made the move to DevOps.

    Sean D. Mack (@SeanDMackNYC) is formerly the VP of Operations and Application for Pearson. To give you an idea of the scale of the company’s operations when it began implementing DevOps, Sean oversaw 110 development teams and 3,000 different products across the globe. To further complicate things, Pearson is a mature company with both legacy and new products. This is a case study of how the company approached implementing DevOps with the goal of helping you learn how to do it. Sean presented it at the 2016 All Day DevOps conference.

    As they say, you often learn your biggest lessons with your failures. Sean noted that, ultimately, DevOps was a failure at Pearson due to organizational change. But, he presented the case study with the hope you will learn from what Pearson did and take it forward. He continues to be a passionate evangelist for DevOps.

    Pearson had its challenges. It was a siloed organization operating at a large scale, and had a toss-it-over-the-wall mentality in dealing with problems. Out of sight, out of mind.

    seanmack1.png

    In addition, all of Pearson’s teams were at different levels of maturity, from legacy teams running .Net on Windows 2000 servers while others doing CI/CD to AWS. Obviously, this creates challenges when implementing DevOps, but we will see later how the company tried to tackle that, specifically.

    At the high level, the solution involved several aspects:

    • A DevOps practice area
    • A DevOps steering committee
    • Measuring progress based on global KPIs focused on measuring business impact
    • Measuring teams based on a DevOps scorecard
    • Push from the bottom – plenty of developers and operations who embraced and were eager for the change
    • Push from the top – support from key executives

    Pearson’s DevOps Steering Committee set up several workstreams:

    • Tracking tools
    • Metrics
    • Deployments automation and monitoring practices
    • Test automation
    • App engineering resource contention
    • Operationalization
    • Communications

    While these are specific to Pearson, many may be applicable to your organization. In any case, it is important to step back, look at your organization, and decide what your organization needs.

    Pearson also looked at four core competencies to track and measure: automation; independence (how independent is the feature); operationalization (how easy it is to maintain); and continuous improvement. The below chart outlines each area in more detail.

    Automation

    Continuous Improvement

    Independence

    Operationalization

    • Unit tests
    • Critical Scenarios
    • Dependent Systems
    • Continuous Build
    • Continuous Deployment
    • Test Automation
    • KPI
    • SLA
    • Metric Tracking
    • Metric Reporting
    • Remediation
    • Isolated Configuration
    • Code Dependencies
    • Isolated Infrastructure
    • Monitoring and Alerting
    • Tier 1 Service Desk System Knowledge
    • Tier 2 Service Desk System Knowledge
    • Documentation

    To help each team measure their competencies and improvement, Pearson built a self-reporting tool to empower teams but encourage visibility, and developed business metrics and then a competency model to measure teams against to see how they were progressing. As Sean noted, “We were not trying to get everyone to a 5. Some teams, yes, but we also had legacy products that were running for years, successfully, with little or no maintenance. The investment to bring the teams up wasn’t worth the effort. There had to be a business reason.“

    seanmack2.png

    In the end, Pearson raised DevOps maturity for all of the teams. As noted earlier, though, this was eventually phased out, but Sean presented this case study with the hope you found something to drive DevOps in your company.

    In the end, if you have just a couple takeaways, they are this:

    1. Begin by determining what your desirable outcomes are.
    2. Don’t just do DevOps to be cool. Do it to drive business results.

    You can watch Sean’s entire talk online here. If you missed any of the other 30-minute long presentations from All Day DevOps, they are easy to find and available free-of-charge here.  Finally, be sure to register you and the rest of your team for the 2017 All Day DevOps conference here.  This year’s event will offer 96 practitioner-led sessions (no vendor pitches allowed). It’s all free and online on Oct. 24.

    — Derek E. Weeks

  • Get the Full DevOps Picture with our Continuous Delivery Map

    Get the Full DevOps Picture with our Continuous Delivery Map

    Automation and continuous delivery are shifting from being industry trends to becoming industry standards for fast and effective app deployment. To compete in today’s market, organizations must adopt technologies and applications for more rapid deployment. But with so many tools available, this is incredibly challenging without knowing which specific tools and methodologies are most effective.

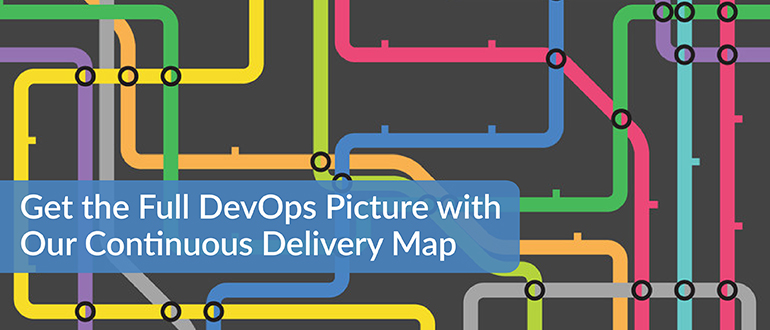
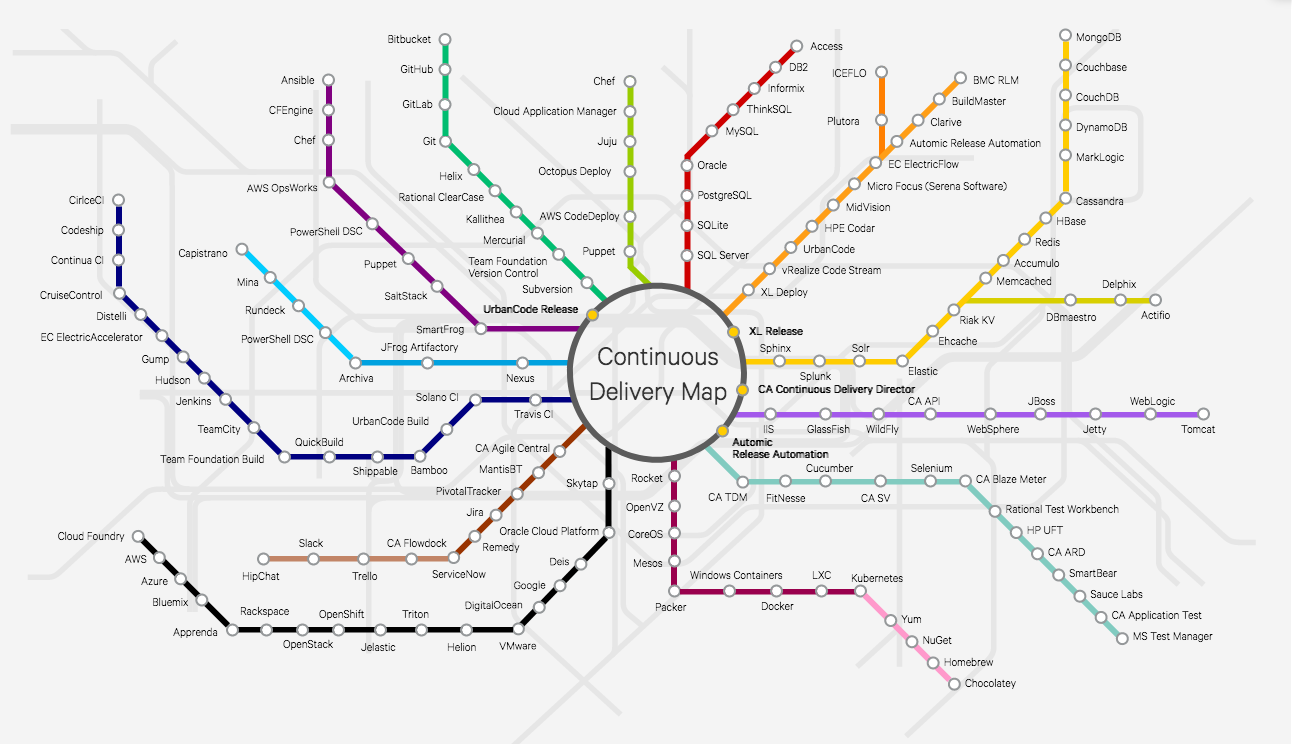
    Automic, now part of CA Technologies BU, has been a leader in this space and just launched the “Continuous Delivery Map,” inspired by the London Tube. Designed to be interactive and instructive, this subway-like map helps customers easily visualize and assess the best use cases for continuous delivery tools for their own digital transformation and reduce the confusion for IT professionals.

    Before I get into the specifics though, I wanted to share a few trends I’ve been following that have ultimately led to development of this map. In recent years, we’ve seen an expansion of freeware and open-source offerings for automated tasks within IT. But organizations must consider and address the long-term sustainability of these software products since the cost of adoption could be risky. It may only be useful for two to three years, until community developers move onto the next new thing—leaving orgs with the costly task of rewriting delivery pipelines or automation mechanics every three to five years. This is compounded by the fact that the term “DevOps’ itself has even become a trend”—it’s catchy and grabs attention, so everyone is branding themselves as a DevOps tool, even if it’s not a core use case of a tool. Now, there is increased confusion on what tools are available, what aspect of DevOps they’re most valuable for, how sustainable they are, and what the market thinks about them.

    Over the past few years, I’ve also seen some organizational shifts as well. Starting at the top, I have noticed that CEOs have recognized the competitive advantages of applying DevOps practices, including faster software production, greater revenue gains and better responses to market conditions. Leadership teams are now responding with mandates for DevOps implementations in their own orgs, and C-level hiring and firing decisions are being influenced by their awareness of DevOps. Separately but related, development and operations teams have continued to fundamentally work and solve problems differently, with developers working in a linear fashion, solving problems sequentially and operations working in a circular fashion with frequent interruptions. Automation is the key to making operations agile because it will reduce interrupt-driven processes and practices. An agile operations team will empower true DevOps because Ops members will have time to collaborate and contribute to DevOps practices. Without it DevOps really means DevNoOps.

    Enter the Continuous Delivery Map

    We developed the Continuous Delivery Map to help our customers and the industry at large understand the hundreds of available DevOps tools across several “lines.” We sought to create a centralized, unbiased way for IT professionals’ research and visualize how DevOps fits into customers’ continuous delivery pipelines. After thinking more about patterns that fit a delivery pipeline, we settled on a metro rail system similar to the London Tube or New York Subway. Now, with this map, customers can easily visualize the ‘tooling’ in their continuous delivery process with an understanding of the tools best use cases. You’ll see we have several “lines” from middleware to continuous integration to toolchain orchestration—all with more information on each product in each line.

    As the tool evolves, we hope the map will become a platform that uses data and feedback to rank the tools, capturing a market consensus on best-in-class DevOps tools. Customers will then be able to truly see and choose the best tools in various categories that meet specific continuous delivery needs and strategies.

    — Scott Willson

  • Speaking for the Dead: Are ‘Agile’ and ‘Monolithic’ Actually Good?

    Speaking for the Dead: Are ‘Agile’ and ‘Monolithic’ Actually Good?

    What if Agile is the product of getting bored at work, microservices are the result of us needing a challenge and scrums are the result of an obsessive project manager? Do we all think waterfall development is a dinosaur whose extinction is deserved because of what we have been told and not because of reality? Do we think Agile is better because it simply sounds desirable?

    Michael DeHann (@laserllama), creator of Ansible, spoke at the 2016 All Day DevOps conference, which espouses the benefits of DevOps, and, by association, Agile and microservices. It essentially says, “Let’s step back and evaluate the past. Maybe waterfall development and monolithic architectures are actually a good thing?”

    Michael has been a software engineer and created a key tool in the IT automation toolbox: Ansible. His arguments deserve a look, because re-evaluation can keep you from making mistakes and improve processes going forward.

    Michael started his talk by making the point that in this day and age, it is waterfall versus Agile and monolithic architecture versus microservices. The assumption is that if you are still developing software with the waterfall method and/or developing monolithic applications, you might as well be riding a horse and buggy to work and dialing up coworkers on your rotary phone.

    Throughout his talk, he asked questions to make his points, beginning with, “Is big design up front bad?” with the conclusion, “I don’t think so.” His argument is that design and requirements at the beginning of the process enable a better production. Marketing and engineers hammered out requirements based on needs, abilities and budgets. There was plenty of time to research and design solutions. Both sides worked together, raising questions and comments and documenting mutual agreement. This presented an accurate view of the strengths of various team members and dependencies between tasks and task orders. And, perhaps most important, engineering was engineering—the engineers had greater responsibility and less hand-holding.

    Contrasting that with his view of Agile, big design up front is labeled as bad or counterproductive, engineers are viewed as interchangeable and scope is more unpredictable. Estimates are encouraged to not be time-based, which often results in a constant crunch time. Finally, meetings can consume a significant portion of team members’ time and often include “games reminiscent of Kindergarten, such as Fist of Five or Planning Poker.” Even in lightweight Agile systems, testing can suffer, requirements are more vague and there is no mutual sign-off.

    Michael argues that there can, in fact, be a middle ground where teams:

    • Do share design
    • Have an accessible, effective product owner
    • Know hard requirements versus soft requirements
    • See test-driven development and test automation as super important
    • Understand that Agile and iterative development can be closer than we think

    Agile and DevOps are also often associated with microservices versus monolithic applications, but according to Michael, “What’s so bad about a monolith?”

    Sample Monolithic Diagram

    dehann1.png

    Sample Microservices Diagram

    dehann2.png

    An example microservices shop has 150 services, many thousands of Jenkins builds per day, eight Amazon regions including dev, staging and production and thousands of EC2 instances. This can result in Jenkins configuration and security enforcement drifts, suboptimal code sharing and DevOps writing lots of custom code to manage it.

    Michael contrasts that with monoliths, which have:

    • Increased ability to develop on one laptop
    • Interfaces that benefit from static typing versus design-by-contract
    • Very small numbers of different server/image types in production
    • Local function calls that are much faster than RPC
    • Few instances sitting around with 5 percent utilization
    • No need for “containers” to get around above utilization problem
    • Greatly simplified debugging
    • Easy code-sharing
    • Very simple version upgrades

    Rather than argue that all applications should be monolithic, he makes the point that many of the concerns that resulted in microservices could be solved with improved communications. He contends that microservices are a tech solution to a people problem.

    Michael concludes that:

    • Labels cloud true meanings,
    • Monolithic architectures are more efficient,
    • Agile can be less efficient,
    • Microservices attempt to solve people problems but introduce new technical and people problems, and
    • We should try and separate the labels from the true meaning of things.

    Most importantly, though, is the fact that there is something to learn from everything. So, even if you don’t agree with Michael’s conclusion, you should listen to his talk online here. You might learn an unexpected lesson.

    If you missed any of the other 30-minute long presentations from 2016 All Day DevOps, they are easy to find and available free of charge here.  Finally, be sure to register you and the rest of your team for the 2017 All Day DevOps conference here.  This year’s event will offer 96 practitioner-led sessions (no vendor pitches allowed).  It’s all free and online Oct. 24.

    — Derek E. Weeks

  • Liberty Mutual: Taking an Organic Approach to DevOps

    Liberty Mutual: Taking an Organic Approach to DevOps

    Some people are directors, managers, and administrators. Others are disrupters.

    Eddie Webb (@edwardawebb) is an IT disrupter for Software Development Platforms at Liberty Mutual and was a presenter at the 2016 All Day DevOps conference. His talk, “Organically DevOps: Building Quality and Security into the Software Supply Chain at Liberty Mutual,” looked at Liberty Mutual’s transformation to continuous integration, continuous delivery and DevOps. For a large, heavily regulated industry, this task can be not only daunting, but also viewed by many as impossible.

    Eddie’s talk looks at the origins of DevOps at Liberty Mutual, the challenges of centralizing DevOps, and how to make it easy for developers and operations to do the right thing. He noted that DevOps is not Liberty Mutual’s goal; continuous delivery is the goal and DevOps is the enabler.

    It all started at Liberty Mutual in 2004 with a vision: “Black-box reusable services that benefit the business.” The company also had a concept that “developers own the quality of the code; we have no QA team.” Employees were empowered with this “concrete vision but malleable strategy,” as Eddie said. The company gave them time and space to explore solutions, because ownership increases adoption.

    The team started with fixing what frustrated them, including CI/CD pipelines, artifact and code repositories, elastic cloud-native runtime and Agile planning and delivery.

    But what about centralizing DevOps?

    The reality is that tools can be centralized, but culture cannot.

    Eddie laid out an example of a large organization’s IT structure, saying that this is how things work at Liberty Mutual. Eddie’s team is the Central IT, and their customers are the Market IT team, not Liberty Mutual’s end customers. As Eddie pointed out, the more layers you create, the more friction that enters the system. Often, organizations try to reduce the friction through microfixes, but Eddie’s team asked how to change the culture to reduce the friction.

    webb1.png

    This required distributing innovation and centralizing the tools that work. As an example, if you build a manufacturing plant, you wouldn’t build your own power plant. If you are in IT, why build your own cloud?

    webb2.png

    This is the Netflix way. At Netflix, teams are independent, but responsible. Engineers can choose the best tools for the job. No one single team is responsible for innovation. However, the Engineering Tools team helps direct other teams’ experimentation toward new products without getting in the way of innovation.

    Eddie quoted the book, “Drive,” when looking at how to motivate innovation in complex work environments. The author says if you want to incentivize or motivate cognitive tasks, you need three things: autonomy, mastery and purpose.

    When you centralize non-value added platforms, it enables teams to:

    • Master their specific domains of business;
    • See clear purpose in everything they build; and
    • Maintain autonomy of choice of frameworks, patterns, and approach.

    When you decentralize, it raises the question: What about security? Developers are humans, and humans inherently try to avoid tasks they see as unnecessary or overly burdensome, and this becomes easier when the compliance person isn’t there (think of how we handle speed limits). Traditional security measures erode profit and market share, and, from a stat Eddie quoted from Gartner, 77 percent of IT security professionals agree that security slows down IT.

    webb3.png

    Whether you are centralized or decentralized, security (and other compliance-oriented tasks) can increase adoption rates by making it easy to do the right thing. How do you do this? Eddie proposes governing with tools (think of speed governors in fleet cars).

    You also need to have immutable environments, because, “We can’t trust humans to manipulate production.” So, again, you have to make the path you want them to take, and make this the easiest path. As Eddie notes, “You can’t put too much friction into the pipeline, because developers are good at bypassing friction.” You have to make your CI/CD pipelines the easiest way to get ideas to production by. You also have to abstract complexity and automate policies. You have to have an “opinionated platform, and observe your customer so you can address their pain.”

    webb4.png

    Eddie concluded with the following final points:

    • Don’t mandate DevOps. Give employees the chance to master their discipline with examples to set and follow.
    • Favor deep end-to-end accomplishments over broad but incremental steps forward. Focus on taking the right teams far before encouraging broad adoption.
    • Centralize the platforms and tools that your teams shouldn’t be thinking about. Provide foundational services/commodities and let teams stay on purpose.
    • Incorporate contributions from everyone; don’t stifle autonomy. Stay open to new ways of working.
    • Challenge security policies, but respect intentions. Find new ways to enforce concerns without abandoning precaution.

    You can listen to Eddie’s entire talk online here. You might learn an unexpected lesson.

    If you missed any of the other 30-minute long presentations from 2016 All Day DevOps, they are easy to find and available free of charge here. Finally, be sure to register you and the rest of your team for the 2017 All Day DevOps conference here.  This year’s event will offer 100 practitioner-led sessions (no vendor pitches allowed). It’s all free and online Oct. 24.

    — Derek E. Weeks

  • Electric Cloud and the Deployment Dashboard

    Electric Cloud and the Deployment Dashboard

    As my regular readers know, I started a series on companies that I found intriguing who were going to Jenkins World both late (a couple weeks before the event started), and ad hoc. That meant that companies I talked to on a regular basis came to mind, simply because I knew what they were up to, and whether or not they were going to Jenkins’ World.

    It turned out to be a popular few blog posts, both with readers and customers, but I was only able to fit three in before it was late enough in the event that publishing more would not achieve the goal of the series: telling you all about interesting bits to check out.

    But as these things go, the more I paid attention, the more interesting stuff I found. So I’m going to do a few “What you might not have seen at Jenkins’ World” posts to kind of get a chance to talk about other ideas that hold interest.

    Today, I’ll focus on a vendor I’ve followed but never actually used. That’s rare for me; generally speaking, if I’m writing about the product, I’ve used it. And no doubt I’ll snag a free license and put it through the paces, or have one of my coworkers do so. But for now, I’m covering them because I find what they’re doing to be of interest.

    The vendor is Electric Cloud. For those unaware, its ElectricFlow tool is in the same application release automation/continuous delivery (ARA/CD) market space that XebiaLabs (which I also wrote about at Jenkins World) XL Deploy is in. But the point of this blog is not to compare; since I have used both of XebiaLabs’ mainstream products and not Electric Cloud’s, a comparison would be unfair. I only mention XebiaLabs to help those just starting to research understand where Electric Cloud fits.

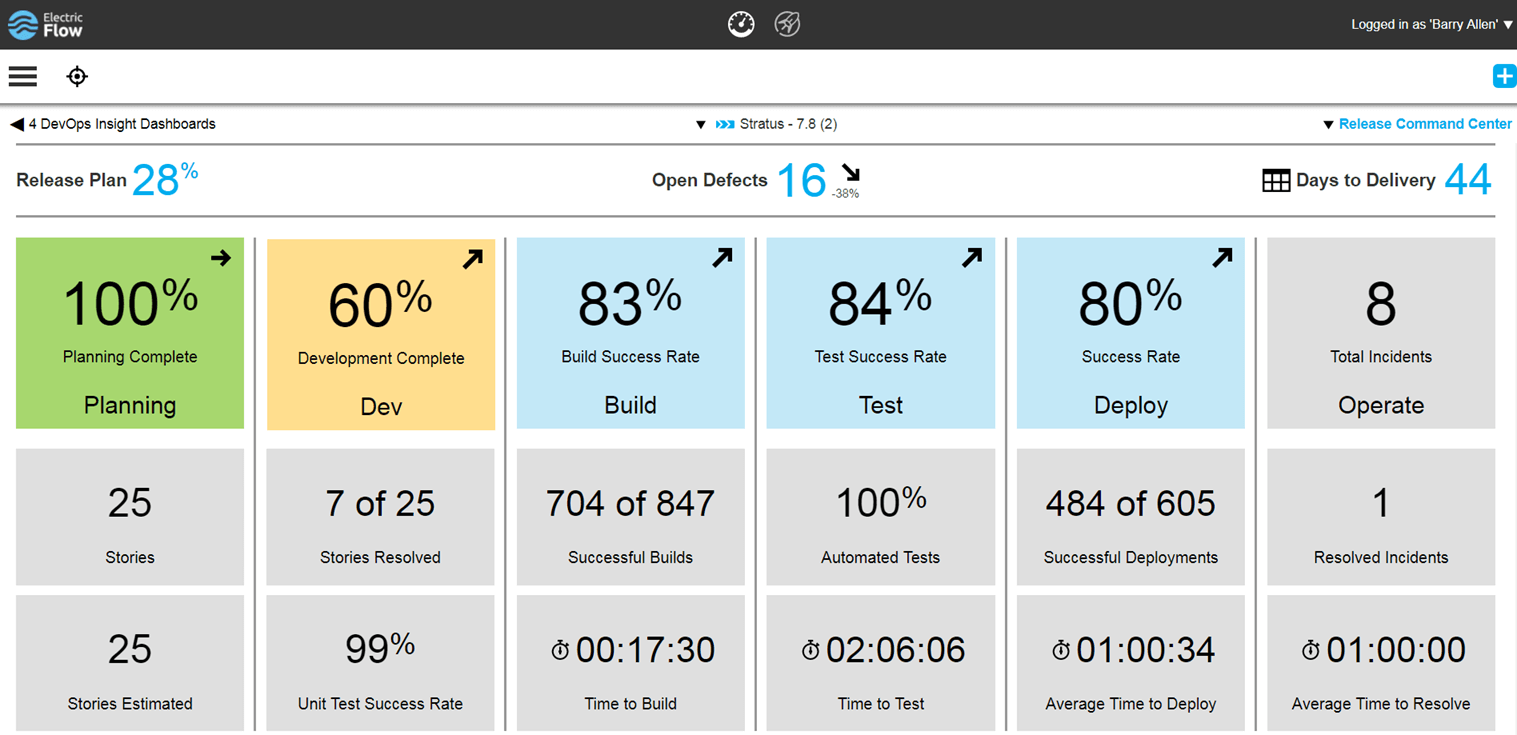
    dashboard
    Electric Cloud’s new dashboard

    Electric Cloud’s big bit at Jenkins’ World that intrigued me was its updates to ElectricFlow to allow better reporting. We all know when a build breaks, we have great systems on the AppDev side to notify the source of the breaks and project management of the issue. But as has traditionally been the case within IT, getting that information out to business leaders who have an interest in the application is spotty, at best. Combine that with the fact that what and how it is reported can vary project to project, and there always is a bit of confusion among the business about status of projects. This confusion translates to asking IT management about status and then, when IT management is wrong and a deadline is either missed or features are dropped from release at the last minute to meet the deadline, bad blood is created between AppDev/IT and the business. Since everyone at an org should be one team pulling toward success of the business, this bad blood is not good for anyone.

    It appears, from its release (I really wish I’d been at Jenkins’ World to poke the corners of this), that Electric Cloud has begun the process of bridging that gap. The growing number and complexity of toolchains means inputs are coming in from several vectors that can give indication of the status of a project. Instead of having IT management (or business management, at some orgs) run around and try to collect these disparate datasets and determine tracking for a project, Electric Cloud has begun the process of automating status collection/aggregation.

    The dashboard pictured above is a critical piece of this solution. Imagine giving business leaders access to a dashboard that doesn’t just cover the current step of a project, but tries to aggregate status from all of the steps in the DevOps life cycle. Basing this information upon release means that, over time, a library will build up that business leaders can reference to gauge this projects’ status against that of other projects, and make their business decisions based upon standardized inputs.

    This data already exists across IT, but this is the first solid attempt I have seen of a vendor tying it all together and presenting it in a manner that IT and the business can discuss with an eye to delivering. The more involved business leaders are in the process, the less friction will result, and this effort seems to be getting them more involved. While there is still much to do—note that unit test success rate is shown in the above screen capture, but unit test coverage isn’t, for example—this is a good solid start to setting up an easy-to-reference dashboard to show the business side what is going on with the project.

    There is also an API that can be used to set inputs to the dashboard that are not yet directly supported. While DevOps teams have plenty to do—and don’t really need to be developing plugins for tools that are supposed to improve quality while reducing workload—the ability to plug in whatever you need is useful for those shops where it is a priority.

    If you’re looking for a toolset that can give more information about what’s happening in your toolchain, it’s worth checking out the changes Electric Cloud has implemented, and I’ll be trying to make time in the next few weeks to give the tool a run and see how it works out. Though I see it as inevitable that the other ARA vendors will continue to increase their offerings also, sometimes it is worth checking into the early bird.

    — Don Macvittie

  • Automic Chart Maps Out Its DevOps Ecosystem

    Automic Chart Maps Out Its DevOps Ecosystem

    Everyone who follows me knows that I’m a fan of XebiaLabs’ Periodic Table of DevOps Tools. It was the first attempt I am aware of to arrange things in a way that helped DevOps teams navigate the increasingly bewildering world of DevOps toolsets. In fact, my friend Colin Walker over at ExtraHop and I have been planning to pick some up for our offices for a year or so.

    (Add on note: It sounds like I’ll be getting a copy of the XebiaLabs poster. Woo hoo!)

    Visit the interactive version.

    So this week when I found out about Automic’s chart—let’s call it “The Spider” because of the way it branches out—I thought I’d let you all know that it is also out there. The cool part about The Spider, in my opinion, is the interactivity (which means I still want the XebiaLabs poster for my office). You can click on a node, get information about the tool and be presented with a link to the tools’ website—and, if they’re integrated with Automic, a link to the integration in their marketplace.

    For quick research, this is a nice chart. I wouldn’t want to have to maintain it, at the rate the market is changing, but it’s a useful starting point for “I need a tool that does X” and exploring short one or two paragraph descriptions of each of the options. It’s not complete, but it would be a full-time job to make such a chart complete and keep it up to date, and it’s pretty far along. You won’t miss any major vendors in a space by starting with The Spider.

    I clicked around and looked at the writeups for several products, and they read well. Considering that Automic is a vendor (they’re owned by CA, so kind of an über-vendor) in the space, it would not have surprised me to find they were limited or slanted in their writeups, but they weren’t. So I asked Scott Wilson, product marketing director for release automation, about that, and he told me they actually wanted to couch the details in the framing that each vendor used. Considering that Automic has a plug-in architecture that interfaces to many of these products, I suppose that makes sense. And making sense or not, it’s good for us, because we don’t have to pry apart two layers of vendor-speak to figure out how a product can help.

    If you’re trying to figure out the CD market, or a subset of that market, this is another good tool to have access to, so thought you all would be interested. The plan is to keep it up to date, so hopefully it is useful for a while moving forward.

    — Don Macvittie

  • DevOps Chat: The Continuous Delivery Map w/ Scott Wilson, Automic

    DevOps Chat: The Continuous Delivery Map w/ Scott Wilson, Automic

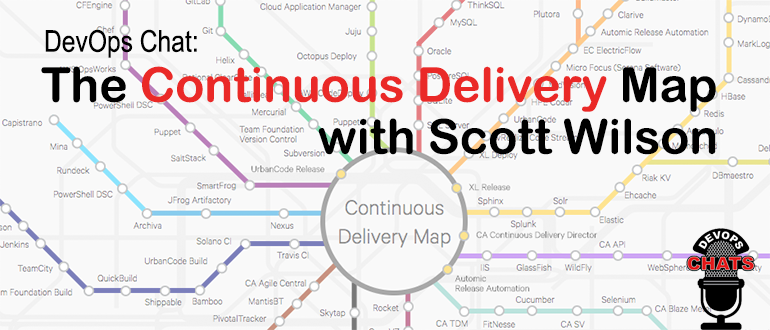
    Wouldn’t it be nice to have the entire continuous delivery topography laid out in a nice map that shows how they are all interconnected? Sort of like a subway or metro map? Well now you have it and it is interactive! The good folks at Automic, a CA Technologies company just released their Continuous Delivery Map. It is really cool and they are adding to it all the time.

    I caught up with Scott Wilson of Automic and had a chat about the Continuous Delivery Map. As usual the streaming audio of our conversation is immediately below, followed by a transcript of our chat.

    Audio

    Transcript

    Alan Shimel:                Hey, everyone, Alan Shimel, devopsy.kinsta.cloud here for another DevOps Chat. Welcome and welcome to our guest, Scott Wilson, Automic, a CA Technologies company. Scott, welcome back to DevOps Chat

    Scott Wilson:               Thank you, Alan. I’m glad to be here.

    Alan Shimel:                Glad you’re here with me. So, Scott, you know, lot going on with Automic, obviously – always is – but I wanted to focus in today on some pretty cool interactive graphic – well, it’s more than just a graphic. It’s really a whole project that you guys have launched and it’s called the “continuous delivery map.” For those following along at home, if you wanted to check it out, you can get to it at automic.com/continuous-delivery-tools and – dash or a hyphen. Scott, you know, assuming people are listening to us but not able to get to the site this second, can you describe for us what the continuous delivery map is?

    Scott Wilson:               Yeah, so the continuous delivery map is really just a way to visualize a topography, if you will, of all the different tools that are in the continuous delivery value chain, and there are lots of tools. And we found, in talking with a lot of prospects and just other companies in the industry, that amongst IT professionals there’s a bit of confusion on what kind of the best use case is for many of the tools, mostly, Alan, due to so many of these tools having a great deal of crossover functionality, right? It’s kind of muddied, blurred the lines a bit.

    And so, in thinking about a good way to help people out and kind of visualize the tool chain used to get an application into production environments, we took inspiration from metro rail systems, like the London tube or the New York subway, and so we built out a map that looks similar to that.

    Alan Shimel:                Yeah. I mean, for those of you, as I say, who maybe can’t get to a computer right this second, as you’re listening to this, it really is. It’s based on a subway map or a tube or it could be the Washington metro or the Boston or Tokyo or anyplace else, in that you have a central hub and then there’re different lines that are color-coded. And each of these color-coded lines represent a lineage or a line of a particular functionality in the continuous delivery world. So, for instance, there’s a line for cloud, IaaS and PaaS. Another line for middleware, another one for CI tools. Another one for artifact repositories. And, along that line, the stops are all of the different companies that kind of play within that are or are on that, and it’s not just companies – it’s actually the products of these companies that play on that particular branch, if you will.

    So it’s actually pretty cool, Scott, and what I like about it too is, though, look, plainly and clearly, Automic is a vendor. I mean, there’s no favorites here. You’ve done a pretty exhaustive mapping or the whole topography of the continuous delivery world, it looks like, to me anyway.

    Scott Wilson:               Absolutely. We really wanted this to be agnostic for the tools. We’re really just trying to help the community understand, you know, the landscape for continuous delivery, and, as you mentioned, the central hub is really the way you would bind all those many plethora of tools into a coherent pipeline, right, to safely and reliably deliver apps to production environments. And, yeah, this definitely respects that. Ultimately, we’re gonna be opening this up to the community so that people can comment or keep this updated ’cause there’re always new tools coming on board and other tools or open-source projects that kind of fall out of vogue, so we’re looking to really make this more interactive and far – we’ll keep it up to date.

    Alan Shimel:                Yep. And, you know, again, trying to visualize or paint a picture for people who don’t have it in front of them, at every stop on every branch, if you will, it’s a link, and if you click on that link, it gives you a little pop-up with a little information about that particular company or product but also links through to their full websites or what have you. So it really is – I could see this being a really useful tool for anyone interested in the CD kind of world. There have been – I mean, clearly, Scott, right? Full disclosure: there’ve been other companies that have tried to organize, if we will, the CD world, but, really, using this paradigm of the subway map and the branches and lines, if you will – maybe it’s just ’cause I’m from New York and I’m used to subway maps –

    [Laughter]

    – makes a lot of sense to me.

    Scott Wilson:               Right. Well, we’ve heard that feedback as well that that’s just – well, you know, continuous delivery’s about movement, right? You’re moving things along and it just seems to help visualize it. You know, a lot of the data from what other folks have done is similar, right – a big list of tools – but just being able to put it in a format like this, we’re finding a lot of people go, “Ah, this makes sense. I would use these set of tools. Source code management fits here and deployment automation fits there.”

    And it’s helpful because I think, without presenting it this way, you’re just left to a hodgepodge of tools and you’re like, “Yep, I got ten of these and two of those and I’m good.” When you look at it in this format, you realize, “Oh, well, I could actually go further. I could do more or I could better organize things,” or maybe even take some of the burden off a tool that you keep having it be more than it was designed for and actually use a best-of in another category, or, as we represent it as, a color-coded rail line.

    Alan Shimel:                Yeah. Yeah. And, of course, you know, the thing about projects like this, Scott, is they’re, in some ways, a never-ending story. They’re constantly morphing, changing, growing. And, I mean, the good news is you’ve got a great start right here; the bad news is you guys need now to keep this up, week in, week out, month after month. What are the plans, going forward, to keep it current and fresh?

    Scott Wilson:               Excellent observation and point. We are looking to ultimately open this up to the community, so this page will not only be as it is now; it’ll be far more interactive, where visitors can come in and recommend tools that aren’t on here, maybe further defining particular lines or branches that we have, upvoting, downvoting various tools, and, yeah, so we’re looking to have that community help us keep it up to date. In just doing the research for this and playing with many of these tools and looking at their viability to be on the map, as you said, it was a ton of work. And so it’d be impossible, with the growing market, to do that on our own, and we’re definitely looking forward to collaborate with the DevOps community at large in keeping this current, the information current and fresh and, of course, far more interactive and useful, as we go forward.

    Alan Shimel:                Yeah. I mean, you know what? I mean, this is great and I don’t know how you would visualize it, but it would be great to show sort of connected dots, in terms of how companies or products actually integrate or work together. But that –

    Scott Wilson:               So, yeah, not to give away – [chuckles] – so much what we’re planning, but, yes, you’re absolutely correct. That is something that is on our roadmap, what we’re planning. Indeed, what we think would be useful for this is to allow us to kind of rank or order the tools and use a kind of a most popular or what the market, the community says, “Now this is the best practice set of tools.” A simple example would be SQL Server and Oracle. Right? If you’re going down the RDBMS line, the database line, then, well, those two are kind of the giants. And so by ordering them such a way, you would be able to come in, list the tools that you have, and be able to visually see, “Are you kind of following what everyone, what the consensus best practice is? Or are you have a lot of outliers?” And I suspect a few outliers here and there are okay, but, you know, if you’re going two four outlines, you might be putting yourself at risk.

    And sometimes I think it’s just to help you answer that big question, is “I don’t know. Should we go with this tool or this tool?” Well, you could come here and, in future releases, be able to see what the community is saying the best of or the next best of, right, and have it ordered and you’d be able to see that in a nice map, visual way, to understand and help you to, hopefully, make decisions on what tooling you should consider or not.

    Alan Shimel:                You can also see if you’re taking the express or going on the locals. There’s a lot that a clever marketing person and someone with a good knowledge of the market here in the CD space can really make some hay with this, Scott. And, you know, beyond cute, it’s actually pretty – a really useful tool here.

    Scott Wilson:               Yeah. Appreciate that. Like I said, we’re looking to make it far more useful and what you hinted to and what I’ve just discussed is really make it really interactive and help you measure yourself against what the market or the community is doing, what the norms are, best practices and so forth.


    Alan Shimel:                So I’ll include a link to this, Scott, in our show notes when we publish, but, for those who may be listening on iTunes or SoundCloud or audio only, again, the URL for this CD map is automic.com/continuous – dash or hyphen – delivery – dash or hyphen – tools. And you could check it out there. Scott, you know, in real DevOps fashion, upgrades here will be continuous, right? There’s not a Linux version planned or anything like that, I would assume

    Scott Wilson:               Correct. Yes. So we have continuous sprints planned. New vendors are actually in our current sprint, that are coming out, and, yeah, so you’re absolutely right. If we’re gonna do something on continuous delivery, then we ourselves are looking to be agile and looking to keep it fresh and then, ultimately, have one of the inputs to those sprints be the community, community feedback and input.

    Alan Shimel:                Got it. So, Scott, this is really great. Congratulations to the whole team at Automic who worked on it. It’s a piece of work here that I think is highly useful. What else is new at Automic, Scott? Anything noteworthy you wanna report on

    Scott Wilson:               Well, what we’re shipping here lately, in the next few weeks, is a incremental release of our application release automation product, version 12.1. There are several enhancements that are coming out, going GA here, in the coming weeks. We’re pretty excited about that and some of the additional enhancements. There’ll be a lot of information coming out in a few weeks about all of that and the functionality and things that we’re doing with that. And then, you know, just additionally, the growth and recognition within the CA company, as an automation business unit, and, yeah, we’re keeping pretty busy with automating not just things within the continuous delivery value stream or DevOps tool chain, but also within the CA ecosystem itself. There’s a lot of growth. And so, really, what’s happening with Automic is we’re really able to help show how we can automate, really, the modern software factory.

    Alan Shimel:                Yep.

    Scott Wilson:               That’s kind of one of the – falls in line with what CA is trying to do, one of the core tenets. They’re trying to reach out to the community and the marketplace.

    Alan Shimel:                Absolutely. All about software development life cycle and software supply chains.

    Scott Wilson:               Yeah.

    Alan Shimel:                Well, Scott, thanks for giving us a peek behind the scenes at the continuous delivery map. We’ll try to feature this on devopsy.kinsta.cloud and we’ll be watching as it continues to develop, adding even more features or functionality, but it’s pretty cool stuff.

    Scott Wilson:               Well, thank you very much and, as always, I love being here and grateful you had me.

    Alan Shimel:                Well, we’ll have you back on again then. You know, Scott, flattery will get you everywhere.

    Scott Wilson:               [Laughs]

    Alan Shimel:                Thanks

    Scott Wilson:               That’s so true, isn’t it?

    Alan Shimel:                Yep. We’ll have you on again. Scott Wilson, Automic, a CA Technology company, talking about their new continuous delivery map here on DevOps Chat. Scott, thanks for coming. Hey, everyone, thanks for listening. Hope to see you soon on another DevOps Chat. Until then, I’m Alan Shimel for devopsy.kinsta.cloud and we’re out of here. Thank you.

    — Alan Shimel