Tag: analytics

  • Scalyr Alters Log Analytics Economics

    Scalyr Alters Log Analytics Economics

    Scalyr today announced that its log analytics cloud service is now capable of ingesting over 200TBs of data per customer per day in real-time.

    Company CEO Christine Heckart said the goal is to make as much log data available at a price point that will continue to be less than $5 per GB at scale.

    Heckart said Scalyr expects to be able to continue to expand the amount of data it makes available to customers because its namesake platform is built on top of a columnar data store rather than an index engine. The goal of a project dubbed Sonic Boom is to eventually make a petabyte of data available to customers of the cloud service, she said.

    One of the paradoxes of log analytics is that while IT organizations are encouraged to use this data to proactively identify issues before they become a major problem, the cost of storing that data often results in IT organizations limiting the amount of log data they analyze. As a result, they often miss outlier events that could have major implications for the IT environment.

    As a cloud service that is compatible with the S3 storage interface defined by Amazon Web Service (AWS), the columnar store engine employed by Scalyr makes it easier to pass the economics of cloud storage back to the end customer, she said. IT costs in the wake of the COVID-19 pandemic are, of course, going to be a much bigger issue going forward. Almost every aspect of IT, including log analytics, is likely to be subject to a cost review in the week and months ahead as organizations adjust to an economy that has changed for the worse overnight.

    Heckart said the issue many organizations will face when it comes to logs is that data is the lifeblood of any digital process. Organizations may not need to store that data, forever, but analyzing log data to identify anomalies indicative of, for example, a cybersecurity breach is now almost a daily routine. As such, how much log data to make available where at what cost becomes a subject of debate.

    Of course, it may be less costly to store log data locally. However, someone on the IT staff will need to manage those logs. Scalyr and other providers of SaaS-based platforms for log analytics contend it’s more cost-effective to rely on a cloud service to manage log data that also is more accessible via shared analytics tools.

    Regardless of the amount of IT resources made available, the one thing that is certain is neither the amount of data nor the rate at which it needs to be analyzed will be slowing down anytime soon. In fact, many organizations are likely to accelerate their transition to digital processes that are ultimately both more flexible and cost-efficient than existing processes. It will be up to DevOps leaders to figure out how best to keep pace with that rate of change with whatever resources are at hand.

    — Mike Vizard

  • GigaSpaces to Provide Free Go-Live Services

    GigaSpaces to Provide Free Go-Live Services

    GigaSpaces, a provider of a platform for processing analytics data in real-time, will be making available professional services for free during the duration of the COVID-19 pandemic as part of a Go Live initiative to reduce the total cost of acquiring and implementing its platform.

    Yoav Einav, vice president of product for GigaSpaces, said the economic impact of the COVID-19 pandemic shows it’s apparent organizations of all sizes will need to reduce their IT costs. At the same time, many organizations will need to keep IT projects moving forward as nascent digital business strategies now become business continuity strategies, he said. Most of those business continuity plans will be contingent on providing a better digital customer experience based on real-time analytics.

    GigaSpaces has been building up its professional services capability for the past several months and plans to tap into the expertise of third-party IT services providers to make sure there is enough available expertise in the right place to meet anticipated Go Live demand.

    GigaSpacesIt’s still unclear to what degree IT projects will be impacted by the COVID-19 pandemic. Undoubtedly, many IT projects are being paused or outright canceled, especially in vertical industry segments that have been among the hardest hit. Organizations that are moving IT projects forward, however, should expect to IT vendors to help reduce the total cost of implementing those projects by providing free additional services, as in the case of GigaSpaces, or at the very least much more flexible payment terms.

    There are, of course, some vertical industry segments where organizations are building new applications that are highly relevant. One GigaSpaces customer, for example, is racing to build an application that will make it easier to find critical healthcare supplies that are frequently out of stock when needed most, noted Einav. Other organizations are simply moving to reduce costs by offloading queries from traditional databases.

    In many cases, organizations will be evaluating which platforms to employ to build these applications not just on the raw performance attributes of the platform but also how quickly those platforms can be implemented. As such, the robustness of the IT services ecosystem, including its overall DevOps acumen, will become a more critical evaluation criterion.

    In the meantime, a major transition away from legacy batch-oriented applications toward applications that process data in near real-time that has been gaining momentum now for several years should continue. Most organizations are now going to require the sub-second performance of a financial services application. However, visibility into supply chains in near real-time is becoming a bigger requirement, especially when many of the organizations that make up the supply chain are potentially not as economically resilient as they once were.

    Less clear is the rate at which the transition to near real-time applications will now occur. However, at a time when competition between organizations is about to become more fierce than at any time in recent memory, many organizations are about to discover how big a difference modern applications can really make.

    — Mike Vizard

  • Dell Pushes Computing to the Edge

    Dell Technologies today set its sights on becoming a major edge computing player with the launch of a Dell EMC PowerEdge XE2420 server optimized for space-constrained environments and a smaller version of a pre-integrated Dell EMC Modular Data Center Micro 415 (MDC Micro) ruggedized platform.

    In addition, Dell launched the Dell EMC Streaming Data Platform, a streaming analytics platform based on open source Kafka software. Dell is using Kafka also to provide an embedded management capability known as the Dell Remote Access Controller (iDRAC 9 Datacenter) for its edge computing platforms.

    Matt Baker, senior vice president for Dell EMC strategy and planning, said edge computing applications require a different approach to IT infrastructure because data is being processed and analyzed in real-time. Dell expects that eventually 75% of all data will be created and processed outside of a data center, he said.

    A primary driver of that transition will be the rise of wireless 5G networks, which will make it feasible to build and deploy real-time applications on edge computing platforms.

    Dell, of course, is making a case for distributed IT environment made up of its platform, contending will be easier for IT organizations to deploy and manage.

    The iDRAC 9 Datacenter platform, for example, provides a remote deployment capability that Dell claims can reduce administrator-attended time by up to 99.1% per server after initial setup. The streaming analytics capability, meanwhile, makes it possible to discover trends, fine-tune operations and create predictive analytics to help ensure peak performance and reduce downtime. Dell has also made available an automated certificate enablement tool to enable zero-touch security at the edge and in central locations.

    All told, Dell claims to be collecting nearly 2.9 million data points per server that can be surfaced in as many as 20 different types of reports.

    Baker said Dell has no plans to extend its data streaming analytics capabilities to other platforms, so IT teams will have to decide to what degree they want to standardize on Dell infrastructure versus setting up a streaming analytics platform of their own that is capable of supporting edge computing platforms from multiple vendors.

    Whatever the approach, the one thing that is certain is the way applications historically have been built and deployed is fundamentally changing. Rather than relying primarily on batch-oriented applications that often require large amounts of data to be transferred across networks to either a data center or public cloud, a lot more data is going to be processed at the edge because of application latency requirements. Edge computing applications, for example, will need to process analytics in near real-time to optimize a process or end user experience in milliseconds.

    Naturally, that shift will have profound implications for the management of IT going forward as IT environments become even more distributed than they are today. In fact, the real issue isn’t so much how computing platforms will be deployed at the edge so much as it is how they will be managed, at a time when most IT organizations are already short-staffed.

    — Mike Vizard

  • Eficode Adds Analytics to Managed DevOps Service

    Eficode Adds Analytics to Managed DevOps Service

    Eficode has added an analytics module to a DevOps platform it makes available as a managed service.

    Tuomas Keränen, product manager for Eficode ROOT, said Eficode ROOT Insights provides different types of end users with access to an analytics module designed to make it easier to understand how changes to a software development project will impact delivery timetables. To make that capability more accessible throughout the organization, Eficode has created dashboards for specific types of end users such as project managers.

    Eficode has crafted a DevOps platform from various tools and platforms to create a toolchain based on best practices it has defined that the company then manages on behalf of end customers. Organizations can choose to have that DevOps platform hosted on-premises or in a public cloud. That approach frees organizations to devote more time and resources to building applications versus managing the DevOps platforms, said Keränen. Eficode ROOT Insights is provided as a complement software-as-a-service (SaaS) application.

    As DevOps continues to evolve, it’s apparent that an alternative approach that relies on external IT service providers to manage the underlying platforms is gaining traction. Many IT organizations simply don’t have the expertise required to build and maintain a DevOps platform. The trade-off is that the best practices are defined by the external service provider, which means the IT organization needs to bend its culture to align with those best practices.

    Another factor that potentially will push organizations toward managed DevOps services is analytics. As the amount of data that needs to be collected to drive analytics applications steadily increases, it becomes apparent that DevOps analytics applications are going to be invoked more easily as SaaS applications. Once an IT organization moves down that path, it’s not too long before the case is made for using the analytics platform to also host the DevOps platform. In addition, as machine learning algorithms and other forms of artificial intelligence (AI) are applied to DevOps, the volume of data required to drive an AI model may require an organization to rely more on external service providers to provide that expertise.

    It’s not at all clear how many organizations may prefer a managed service approach to DevOps. Many of the earlier adopters of DevOps have built custom workflows that are designed specifically to optimize their software development life cycle. However, the adoption of DevOps has been uneven at best. As managed DevOps services proliferate, the number of organizations that can effectively embrace DevOps should increase significantly.

    Of course, managing the tension between internal and external IT service providers is nothing new. However, given the complexity of DevOps processes, relying on a managed service requires a level of collaboration that is not easy to achieve. Just as importantly, once an organization decides to partner with a provider of a managed DevOps service, unraveling that relationship later may prove to be all but impossible.

    — Mike Vizard

  • How In-Memory Analytics is Solving Data Woes

    How In-Memory Analytics is Solving Data Woes

    The importance of data to business decisions and operations cannot be understated. On a daily basis, 2.5 quintillion bytes of data is generated. Managing that much data so the necessary intelligence is easily accessible or to make sure insights are not missed, can be incredibly challenging. Luckily, technology does exist that can help to significantly ease the strain of this deluge of data: in-memory analytics.

    Initially adopted by the finance industry—where complex, on-the-fly decision-making is required–in-memory analytics is incredibly adept at handling the analysis of substantial amounts of data very quickly. And as data more ubiquitous, and the development of public cloud services has made specialized hardware affordable to companies of all sizes, in-memory analytics technology is being applied in a variety of verticals from retail, to supply chain to healthcare. In addition, given in-memory computing enables a range of analytics features that are very useful to businesses of all kinds and extremely difficult to achieve with disk-based platforms, the technology is really poised to expand rapidly.

    Slice and Dice Any Which Way

    One of the hardest parts of being a data professional today is leveraging all the data at your disposal. Unfortunately, business intelligence (BI) pros are often constrained in terms of what portion of the company’s data they can and cannot analyze depending on pre-defined data queries and the limitations of their BI tools.

    In-memory analytics, however, enables analysts to explore data without any of those limitations. This creates an experience of train-of-thought analysis that helps businesses make deeper analyses and uncover valuable new insights into their market and their own performance. This means retailers for example, can have a global, precise view of the market and cross-reference data from sales numbers, client receipts and loyalty programs, to develop a better understanding of what customers expect from them.

    Figuring Out “What If?”

    Due to the vast amount of data involved, and the limitations of physical storage discs, the calculation of the impact of any business decision on complex KPIs can take a long time to resolve.

    By utilizing in-memory analytics BI pros can continuously compare and contrast “What If” scenarios—such as running stress tests for financial institutions or setting up disruption test cases for supply chain businesses—with a clear, immediate view of the potential outcomes, so they can be as prepared for the future as possible. This means businesses are able to limit the amount of times they are caught off guard or mitigate the impacts of any unexpected turns.

    Up-to-Date Data

    With how rapidly the world moves today, having data that is as current as possible is pivotal. Static datasets only updated once or twice a day can lead to significant, costly misjudgments in some cases. In-memory analytics on the other hand can support a continuous stream of data from multiple sources so analysts always work with the most relevant set of data. This means supply chain businesses, for example, can have real-time oversight over operations to better cope with any disruption that occurs and ultimately save millions of dollars in potential losses.

    The boom of data science has opened a new field of use cases for in-memory analytics, ranging from the validation of new algorithms derived from ML/AI to industrializing the building of new analytics views and dashboards. If you have invested heavily in data science, in-memory analytics could be the pivotal cog in generating the maximum output from each piece of your organization’s data infrastructure.

    — Antoine Chambille

  • Acquisitions to Fuel Programmable Analytics

    Acquisitions to Fuel Programmable Analytics

    Now that Tableau Software has agreed to be acquired by Salesforce and Looker is set to become a part of Google, the rate at which analytics will be embedded within almost every application is about to accelerate.

    Tableau today is relied on by more than 86,000 organizations to surface business intelligence via data visualizations created by professional analysts and line of business executives. That user base accounts for why Salesforce is willing to spend $15.7 billion to acquire Tableau.

    Competition within the analytics software space, however, has always been fierce. The rise of the cloud has resulted in several analytics startups challenging incumbents for a piece of one of the fastest growing sectors of the enterprise software market. One of those startups is Looker, which created a cloud-based analytics platform that Google is now set to acquire for $2.6 billion.

    Google has already signaled its intent to make Looker a part of its expanding Google Cloud Platform (GCP). As such, Google Cloud CEO Thomas Kurian last week noted one of the primary reasons for the Looker acquisition is to add a software-as-a-service (SaaS) offering that will enable developers to embed analytics within their applications by invoking a set of application programming interfaces (APIs) exposed via a cloud service. Today that analytics service runs on GCP alongside the Google BiqQuery data warehouse. Google, however, has also signaled its intent to make Looker available on multiple clouds alongside the rest of its software portfolio.

    Tableau, which will continue to operate as an independent arm of Salesforce, is playing catch up in the cloud. Tableau is deployed widely in both on-premises and public cloud computing platforms, including as a managed service provided by Tableau through which the company manages a dedicated instance of its software on behalf of customers. The merger with Salesforce will create an opportunity for Tableau to add a full software-as-a-service (SaaS) application instance to its portfolio that leverages the same infrastructure that Salesforce employs to deliver customer relationship management (CRM), marketing and customer service applications. Salesforce CEO Mark Benioff this week said going forward, Salesforce fully expects analytics generated by Tableau to drive a raft of digital business transformation initiatives.

    Most of the analytics that will be embedded within applications will manifest themselves in three forms. The first is embedded software that will be updated continuously as new data is entered in an application. The second is embedded predictive analytics modules that will invoke big data repositories and machine learning algorithms to surface recommendations on how to optimize a business process or customer experience. The third—and more ambitious—goal is an embedded prescriptive analytics capability that automatically optimizes business processes and customer experiences in real time based on events occurring, for example, within an internet of things (IoT) application.

    Every provider of analytics capabilities, from traditional Tableau rivals such as Qlik Software and Microsoft to TIBCO Software, IBM, MicroStrategy, SAP, Oracle and host of others, is pursuing all these emerging use cases for programmatic analytics. Most recently, Information Builders revealed it has embraced Docker containers and Kafka messaging platform as a means for achieving that analytics goal.

    The arrival of programmable analytics platforms will, of course, make implementing best DevOps practices all the more challenging. It’s hard to think of a business process that will not benefit to some degree from embedded analytics. The challenge DevOps teams will face is embedding and then continuously updating all the analytics modules embedded within the applications they deploy. The good news is that as organizations move to embed analytics everywhere increases, so too does the need to embrace DevOps to manage it all.

    — Mike Vizard

  • OverOps Employs Machine Learning to Measure Application Reliability

    OverOps Employs Machine Learning to Measure Application Reliability

    OverOps is adding a series of dashboards to its analytics platform that employ machine learning algorithms to identify which software application anomalies in a pre-production environment are likely to have the most impact on a production environment.

    Company CTO Tal Weiss said one of the biggest challenges DevOps teams face is prioritizing which issues to fix first in an application. The Reliability Scoring capability being added to the company’s namesake platform for analyzing code employ machine learning algorithms to keep track of introduced errors, regressions and slowdowns during every phase of pre-production. In addition to enabling DevOps teams to visually identify the root cause of an issue via a single click, that data is then used to identify which issues will impact reliability.

    Weiss noted that the Reliability Scoring can also be employed to set thresholds of acceptable application performance that would also be used to determine whether there is an issue. The data collected using that capability then can be fed back into a continuous integration/continuous deployment (CI/CD) platform to set up gates that would then prevent suspect code from being promoted, he said.

    The primary benefit, however, should be a major reduction in the number of troubleshooting instances any DevOps team should need to engage in after an application is deployed in production, said Weiss. In fact, the Reliability Dashboards will provide a central mechanism through which developers, testing professionals and IT operations teams can collaboratively track and measure the progress of an application development project, he added.

    The Reliability Scoring tool OverOps developed employs “micro-agents” that operate between application code and the hardware. Weiss said those micro-agents can not only capture data that was never previously available, they deduplicate, classify and gate critical issues as they move into staging and production. The Reliability Dashboards visualize that data in Grafana, a set of open source tools for visualizing data. DevOps teams can also opt to feed that data into any existing dashboards they may already have in place.

    In general, Weiss said the metrics surfaced by the Reliability Dashboard are critical to justifying investments in DevOps over the long term. Organizations expend a lot of time and effort making the transition to DevOps. But most of them don’t really know to what degree they are getting better at building and deploying applications. Reliability Scoring dashboards provide the historical context required to make those assessments, he said.

    Far too many DevOps teams are still starved for data needed to make critical decisions. In the absence of that data, teams address issues as they arise, rather than based on the impact they might have on the business. Worse yet, it’s difficult to identify new issues over those that might be another manifestation of a known issue that suddenly becomes a much higher priority.

    Regardless of the root cause of any problem, however, DevOps teams would do well to remember things that get measured are usually the first things to get fixed.

    — Mike Vizard

  • 5 Ways KPI Analysis Helps DevOps

    5 Ways KPI Analysis Helps DevOps

    Four Vs drive big data solutions: volume, velocity, variety and veracity. Volume and velocity are technical considerations usually receiving a healthy dose of attention among architects and coders. However, variety and veracity often determine success or failure, and they tend to sneak up on teams who haven’t fully considered them. Key performance indicator, or KPI, analysis can head off variety and veracity problems before they escalate.

    When some folks say “KPI analysis,” they mean KPI monitoring and evaluation—the business intelligence perspective. I’m talking about a DevOps analysis discovering which KPIs should be monitored and what data is needed. One step in this analysis traces each desired KPI back through necessary transforms to its required data sources, often termed as facts. Such an analysis clarifies variety and quickly establishes a path to veracity.

    From a strategy perspective, KPI analysis can also mitigate the symptoms of “big bad data” that devour an organization, consuming people and resources rapidly. Here are five ways KPI analysis helps DevOps teams get a handle on big data.

    1. It prevents over-measuring. If you don’t know what you’re looking for, more data probably won’t help you find it. Teams experiencing FOMO (fear of missing out) expand their data gathering, hoping more variety uncovers something interesting. Once your KPIs have been discovered and fully analyzed, stop exploring and start exploiting. Stick to monitoring KPIs directly driving the most impact for your business.
    2. It minimizes bloating. In any computational system, the most expensive operation is moving data. Simply moving stuff around eats processor, network and storage bandwidth. Even with cost-effective storage available, unnecessary data means a bloated infrastructure and less efficiency. KPI analysis identifies a minimum spanning set of data sources. A workload-optimized solution then concentrates on efficient algorithm implementations, yielding results aligned with your KPIs.
    3. It stops wallowing. Allowing people too close to raw big data is extremely dangerous. Off-the-shelf analytics tools often carry a lot of non-KPI variables with them. Cloud-based martech tools are some of the biggest offenders; they are essentially showing off how many ways they can expose their underlying data. Avoiding the temptation to wallow through intriguing but ultimately irrelevant data saves precious brain cells. Customize reports and optimize dashboards around your KPIs.
    4. It de-obfuscates conversations. Nope, not talking about JavaScript here. We want everyone in the organization talking about the same KPIs and only those KPIs. You’ve seen those presentations where someone tries to dazzle an audience with mostly meaningless charts and graphs. Obfuscating your KPIs underneath a pile of other observations wastes time and risks defeating the purpose. Trust your KPIs and focus all organizational conversation on those.
    5. It thwarts non-causality. This is one place where data scientists and analysts really earn their money. Part of a solid KPI analysis determines causality—if your data sources change by some amount, the KPI needle responds by a quantified amount. Understanding those relationships is critical in avoiding false conclusions from data. If your KPI isn’t moving despite changes at the data sources, or your KPI is changing and the obvious data sources aren’t, step back and look at causality and transforms again.

    If you’re seeing these symptoms developing in your organization, it might be a sign automation was rushed in before KPIs were completely analyzed. At that point the toughest symptom to deal with is bloating. You may be stuck with a sized and funded infrastructure, and you really shouldn’t throw out good data already captured. Ongoing KPI analysis can lead your team to optimizations moving forward.

    Ideally, KPI analysis is performed upfront and these symptoms never develop. Realistically, complex systems have cycles of learning before their behavior is fully understood. Even a good upfront analysis may benefit from a revisit as trends start becoming apparent. When KPIs are rolled up periodically, you’ll need a minimum of six periods of results before expected causality is confirmed, maybe more. If that period is monthly, you’ll need ample patience.

    You’re spending too much on a big data solution to afford a big bad data outcome. KPI analysis is an important step, one DevOps teams with both technical and business expertise can excel at with some practice.

    — Don Dingee

  • DevOps Chat: Modern Applications with SignalFx CEO Karthik Rau

    DevOps Chat: Modern Applications with SignalFx CEO Karthik Rau

    Monitoring has come a long way since the days of 2 a.m. alerts, with automation and analytics now integrated in—and integral to—the life cycle of modern applications. It’s a topic Karthik Rau, CEO of SignalFx, knows well, and one we discuss in this latest DevOps Chat.

    In its three years of selling, SignalFx has grown a whopping 300 percent year over year—an astounding number, even for a startup.

    As usual, the streaming audio is immediately below, followed by the transcript of our conversation.

    Alan Shimel: Hi, everyone, it’s Alan Shimel and you’re listening to another DevOps Chat. Today’s DevOps Chat features Karthik Rau, CEO of SignalFx. Karthik, welcome to DevOps Chat.

    Karthik Rau: Thanks, Alan. It’s great to talk to you again.

    Shimel: Always a pleasure to have you on. So, Karthik, let’s just do a little setting the base here, baseline setting. And I’m gonna assume most of our listeners have at least heard of SignalFx, but maybe some haven’t and maybe some have heard it but they’re not sure exactly of who SignalFx is. Why don’t we start there?

    Rau: Sure, Alan. SignalFx is a monitoring and operational intelligence solution for the developers and operators of cloud-native applications. Our founding team, my cofounder and our original engineering team, all came out of Facebook and were responsible for building the monitoring systems at Facebook, back when they had a “move fast and break things” culture, which today everyone calls DevOps, but, back then, they didn’t really have a term for it. So, at a high level, what we do different from everyone else is we are focused very heavily on the analytics part of the monitoring problem. We collect data – time series, telemetry data – across the customer’s entire environment, from the hardware to the middleware to the application, all the way up even through the API layer, and we apply real-time statistical models around that data to identify patterns that are unusual and different, and alert on those trends proactively so that customers can get ahead of issues and be more proactive in their monitoring, rather than reacting to a bunch of noisy alerts.

    So our customers are able to, No. 1, get a much better handle of their distributed cloud-native application architectures, understanding the patterns, what’s happening. They’re able to detect issues as they emerge, which is very important in today’s environments because most people are pushing changes out a lot more aggressively, and so you wanna detect changes immediately, rather than wait and discover stuff after you’ve made a number of changes. And it’s particularly important for today’s application architectures where you’ve got a lot of bursty workloads, like with containers, where you’re spinning up and spinning down capacity in minutes and you really need your monitoring systems to be (a) real-time and discover components immediately and then (b) be a lot more sophisticated in finding issues as they happen.

    Shimel: Excellent. And, Karthik, you know, I should also mention that, in terms of UI, SignalFx is one of the best UIs, web-based UIs that I’ve ever seen. And I’ve looked at a lot of applications, a lot of programs, over the year – over the years. Year? I wish it was “year.” And, you know, so – and I’ve told you this before. I’m just think whoever designs the interfaces there is a rockstar, so just mention that, but –

    Rau: Yeah. Thank you.

    Shimel: You know, we spoke a little bit off-mic, Karthik, and we were going over what are some of the new metrics coming out of SignalFx, how business is going, and you mentioned some really eye-popping numbers, right? First of all, you guys are showing something like 300 percent year-over-year growth for the last couple years, which is – you know, everyone will say, “It’s a startup; they’re supposed to grow like that,” but, dude, until you’ve done it, you haven’t done it, so that’s an astounding number. But also a big move into large enterprises. Is that correct?

    Rau: Yeah. So, yes, absolutely. So we’ve been, as you’ve mentioned, tripling our business year over year, since we – over the past year, but significant growth even above that in the early years. We’ve only been selling for about three years. Our customer base is focused quite a bit on mid- to larger-size companies, so we’ve always been focused on larger accounts, whether that’s the web-scale players, who are operating large-scale applications with four or five nines availability requirements, but also a lot of the enterprise accounts, who what we’ve been really excited about is they’re really moved wholesale into cloud and cloud-native application architectures. And we’ve seen that trend accelerate over the last two or three years, so that’s been a large area of success for us. You know, we’ve got Fortune 500 customers across many verticals – media, retail, financial services, industrials, transportation – so we’re definitely seeing that trend accelerate across the enterprise, not just in a handful of verticals.

    Shimel: Absolutely. But, Karthik, what about for the person out here listening to this, right? And he says, “Wow, that sounds great. I love what Karthik says they’re doing and the Facebook kinda background and all of this great stuff, but I’m not a unicorn. I’m not even a large enterprise.”

    Rau: Well, I think that everyone today is trying to build software quickly, right? Gone are the days where you have a three-year development cycle and you release software and hope you get it right. It’s just not gonna work in today’s world of web services and your competition are tech companies that are moving at lightning speed. So the issue isn’t really – the world is changing. The way people are building and releasing and managing software is fundamentally different.

    And what SignalFx does, the analytics around SignalFx, you can look at it in two ways. One way is, yes, if you’re a large environment, you absolutely have to have it to reduce noise, but another way of looking at it is you could be a small environment and you wanna have a more predictive way of discovering issues, as they emerge, so that you too can move fast without breaking things, right?

    And if you look at it that way, having the kinds of capabilities that SignalFx provides are critical, even if you’re a department within a big company or you’re a startup with 50 people or 20 people. You still wanna be able to do the proactive analysis of, “Hey, this code push that I just rolled out, a canary release, is unusual relative to the rest of my application. And maybe that’s indicative of a problem with my code and I wanna roll it back before rolling it out across all of my users.” Right? You don’t have to be Facebook-sized or Google-sized to have that problem. You’re just building a modern application.

    So that’s why we do have customers across segments. I mean, our focus is certainly on the larger accounts, but we’ve got a lot of departmental deals within enterprises. We’ve got a lot of startups that are also using us, who care about having a more predictive approach to monitoring.

    Shimel: Yeah, no, you know, I think the key there – and you mentioned the word, Karthik, and it’s funny; it’s a word I’ve been hearing over and over again. And that this term of the “modern application.” I don’t care whether you’re big, small or Goldilocks. The modern application, as we call it, right, demands certain things, and one of them is obviously monitoring, but also modern applications demand automation, real-time type of data flows and insight. And it’s not just the guys who develop once every few years – that certainly is not a modern application – but it’s also more than just how frequently you update your code. I think the modern application, you know, what goes are in, the kind of stuff, or at least one element of it is the kind of stuff you’re talking about with SignalFx. Right? These go like hand in glove.

    Rau: Yeah. Absolutely.

    Shimel: So I think that’s – so, to me, more than size of company. I mean, that’s almost a determining factor. Another item I just wanted to mention on the – or bring up on SignalFx itself, as a company, is you guys recently announced a rather large round of funding as well.

    Rau: That’s right, Alan. On the backs of all of our success, we continue to build out our product and continue to accelerate our go to market. We just closed a $45-million Series D round in May and we’ll be using that to continue our investment in R&D. We’re continuing to expand globally. I think I’d mentioned to you offline here that we’ve just expanded into Europe. We also recently expanded into Australia. We’ll continue our expansion geographically, so, hopefully, a lot more people across the seas will hear about us and see us, in the coming quarters.

    Shimel: No doubt in my mind about it, Karthik. I can tell you, from – when I look at devopsy.kinsta.cloud’s demographics and metrics and analytics, it blows me away that only about 36, 35 percent of our audience these days are U.S.-based.

    Rau: Mm-hmm.

    Shimel: About 31, 32 are based in Europe. 15 percent in India. Australia is probably the fourth or fifth largest country, for instance, for our readers. So –

    Rau: Yeah, that’s right.

    Shimel: – you know, the thing about this market is it’s truly, truly a worldwide market. And I know, Karthik, if you’ve had the chance to go to China recently, but I was there for Interop China last month, talking about DevSecOps, and I will tell you that the DevOps market in China is exploding. I mean, just there’s a lot of people there, obviously, as there are in India, but DevOps is really catching fire.

    And, as you and I were talking about offline, Karthik, it’s one thing if you’re chasing that crowd or you’re chasing that wave. In the case of SignalFx, it’s a beautiful thing, where, maybe when you did launch, you were a little out ahead of the market, a little out ahead of the state of art, but they’re catching up to you now, right? They’re coming. And it’s good to be there, waiting for them.

    Rau: Yeah, absolutely. The market – what’s been most interesting about – you know, at SignalFx the last several years, has been, when we launched the company three years ago, our – what we did that was so different from everyone else is we had this real-time streaming analysis engine, streaming analytics engine, that could apply these sophisticated models within seconds across large data sets and help you be a lot more predictive in identifying issues. And no one else was doing it that way and still no one else is doing it that way. And, at the time, people would ask us questions of like, “Well, what does it really matter if you can do things in seconds versus minutes? ‘Cause the human attention span is only minutes and if you wake up in the middle of the night, it might take you minutes to go and deal with an alert.”

    Well, that was kind of in the old days. Now what’s happening is there’s so much more automation happening across the entire operations landscape. I mean, people talk about it as infrastructure as code, right? You basically automate the entire end-to-end process as much as you can. And, more and more, there are these frameworks that enable greater automation, like Kubernetes, and what we’re finding now is people are really recognizing that, “Maybe we don’t need roomfuls of NAC engineers waiting to find a yellow light or a red light to then go and manually invoke a script from a run book, if we can just automate it.”

    Well, guess what? If you’re gonna automate a remediation like that, garbage in, garbage out. You need quality in. You need to have quality signals. You need to be able to untease signal from noise and you need to be able to do it quickly. And if you can do it quickly, then you can automate quickly and you don’t – the whole notion of having a human wake up and spend minutes orienting themselves goes out the door ’cause you can just – or having the roomful of NAC people responding to it goes out the door. You can just automate it. And then the capabilities of SignalFx then are very unique and very critical to enabling you to drive this end-to-end automation.

    And what we’re finding is now more and more of our customers and marketplaces recognizing this, as they’re embarking down this path of leveraging microservices and automation around microservices and infrastructure as code. Having a system like SignalFx, with its real-time analytics, is absolutely critical. So it’s been fascinating to see that evolve over the last few years.

    Shimel: Yeah. No, for sure. You know, Karthik, it was interesting. I saw an interesting metric today. Something – I forgot who it came out of – Gartner or someone. Within two years, something like two-thirds of cloud deployments will be container-based, which kinda blew me away, to tell you the truth. Have you heard anything like that?

    Rau: I mean, that’s an incredible metric. I mean, I would say we’re certainly seeing a tremendous amount of interest in containers. Well, it’s gone from interest to actual deployments, right? So, two years ago, there was a tremendous amount of interest in it. Nowadays, I would say that is the de facto new architecture, so I think the keyword there is “new,” right? So two-thirds of new deployments, I totally believe that, that that will be the case, 100 percent.

    Shimel: Crazy. I mean, we talk about internet time and the time crunch and it seems to be accelerating like global warming is and climate change is, but the idea that we’d see that kind of number in that kind of time just kinda blows me away. So, Karthik, we spent a bunch of time with this stuff, going over the SignalFx, a little bit about the market, right? Let’s take a look at a crystal ball and gaze into where do you see SignalFx, let’s say, going over the next, let’s say, 18 tp 24 months?

    Rau: Well, we continue to invest across our business, right? So our focus right now is we believe there’s a giant problem that needs to be solved in the industry, which is, “How do you get better visibility and monitoring around the new stack? And then, beyond that, how do you get better visibility into how your operations are impacting your business?” So, as I mentioned at the top of this podcast, we think of ourselves as monitoring and operational intelligence for modern applications, so one of the things that we – we see all our customers go through a similar progression, where you’ll start doing the infrastructure monitoring for this new world, where you gotta look at the entire microservice, versus an individual node, and you start to get into application and look at application performance issues.

    But then, very quickly, customers typically start to look at how are all of these metrics affecting their business, right? You know, “How many of my partners are making API calls in my services? And who are my most expensive partners and my least expensive partners?” Or, if you’re a SaaS vendor and you wanted to do a gross-margin analysis by customer, all of the data already exists in your monitoring system, and we see more and more of our customers extending the use of these systems to answer broader questions around operational intelligence.

    So that’s kind of – those are the three sort of key pillars of what you use a system like a SignalFx for, right? It’s infrastructure monitoring, it’s application monitoring, and then it’s operational intelligence. So our plans, as a company, are really focused around those three pillars. You need to invest in product to support all of the use cases around those three areas. And then continuing to invest in our sales and marketing team so that more and more companies out there can benefit from what we have to offer. So that’s our focus over the next 18 to 24 months.

    Shimel: Fantastic. And, as we spoke about earlier, it’s nice to be out in front of the market, but, Karthik, your job, as the CEO, if you choose to accept this mission impossible, is how do you stay out front of it? You’re right? How do you know – how do you – I mean, you think containers are gonna be dominant, right, so you wanna put that cloud-native dominant. What do you think is sort of next big things coming out there?

    Rau: Well, in our space, I think the most fascinating new set of technology is around service mesh. You know, as more and more of the world moves toward leveraging containers and orchestration frameworks like Kubernetes, the service mesh is gonna be a really interesting way of automatically getting visibility into all of the flows between all of these different microservices, having a control plane to operate against all these microservices. And it’s still relatively young. It’s still in its infancy, but there’s a lot of great stuff happening there, you know, what you see Lyft doing with Envoy and Istio and LinkerD. There’s just a lot of really interesting stuff happening there.

    And the theme here is, as developers own more and more of running their applications and the runtime, what you’ll find is more and more of the stuff that used to be this black-box, proprietary thing that vendors would come in and do in the runtime are just becoming available as a part of the core services. So, in the case of service mesh, a lot of the instrumentation of metrics and traces and monitoring data is just you’re gonna be able to get it by virtue of running in a Kubernetes-style environment and you’re not gonna need these expensive, proprietary agents to come in and collect that data for you.

    So that’s great for customers. It creates a standardized mechanism of data collection and it provides a lot of automatic instrumentation, which is great for customers. Of course, then that just begs the next question, “Well, what are you gonna do with all that data?” So we’re focused on ingesting more and more of these new types of data from these new frameworks and making it even more – the more data we get, the more powerful and rich the context we can provide around our alerts and algorithms and dashboards, so we’re really excited to see that trend continue.

    Shimel: Very cool. Karthik, we’re about out of time. We’re probably over time here. I apologize for keeping you on so long. But, hey, man, you guys are kicking butt and taking names, and congratulations. For anyone listening out there who hears Karthik talk about growing 300 percent at SignalFx year over year and raising $45 million and it sounds like, “Well, la dee dah,” I’ve been there and I can tell you it’s not easy. So congratulations. Keep up the great work and we’d love to check back in –

    Rau: Thank you, Alan.

    Shimel: Let’s not wait a year to check back in with SignalFx. Let’s have you on here sooner than later.

    Rau: Absolutely. Let’s do it again soon, Alan. Sounds good.

    Shimel: Karthik Rau, CEO, cofounder of SignalFx, our guest here on DevOps Chat. You’ve just listened to another DevOps Chat. Have a great day, everyone.

    — Alan Shimel

  • Wavefront by VMware Extends Monitoring Reach

    Wavefront by VMware Extends Monitoring Reach

    The gap that exists between the DevOps tools typically made available to traditional enterprise IT sites that have standardized on VMware and what’s typically employed by web-scale companies continues to close.

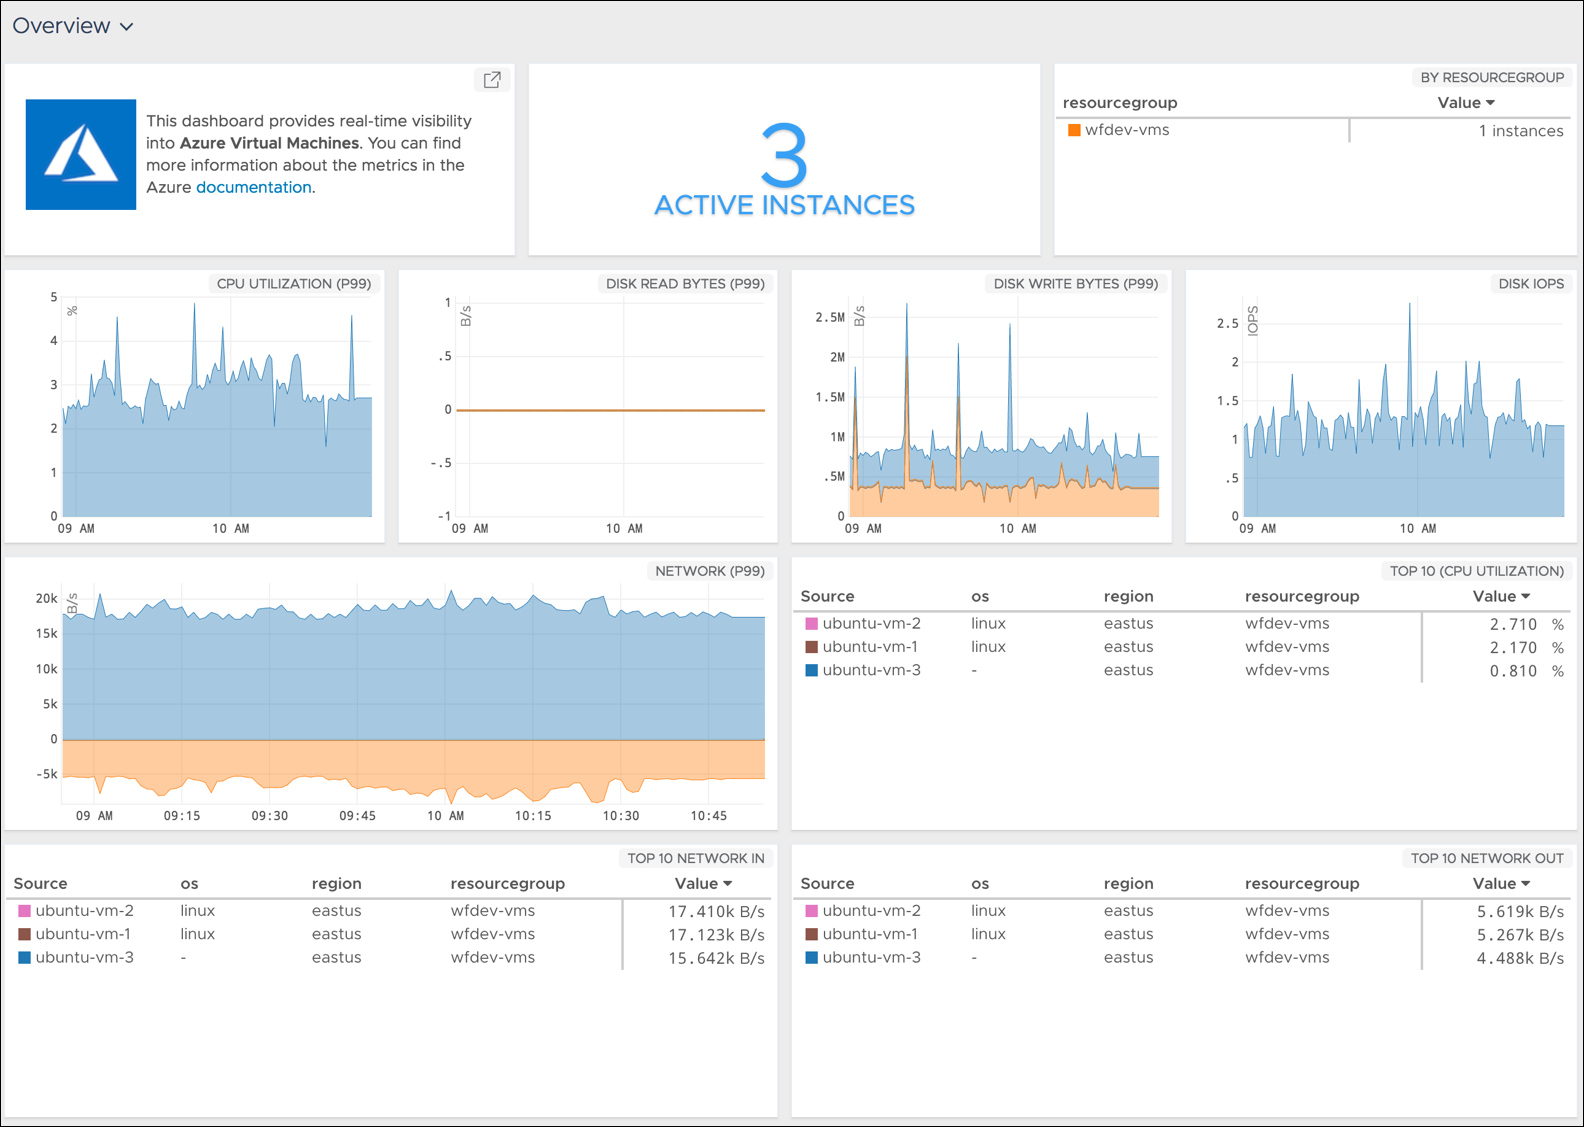
    The latest edition of the Wavefront analytics and monitoring tools from VMware now comes with pre-packaged support for a range of services running on the Microsoft Azure public cloud in addition to a significant expansion of support for a range of services provided by Amazon Web Services (AWS) and Google.

    Rob Markovich, senior director of marketing for the VMware business unit, said Wavefront has added 35 “out of the box” integrations for third-party applications and services to the software-as-a-service (SaaS) application.

    Wavefront has also added pre-packaged dashboards for Kong, Micrometer, Github and Bitbucket, VMware vRealize Operations, Hadoop MapReduce, Yarn, HDFS, Ceph, FluentD, Couchbase, Lighttpd, CoreOS, PHP-FRM, Papertrail, Rollbar, Suse Linux, Fedora Linux, FreeBSD, NetBSD, OpenBSD and Oracle Linux. Any Wavefront dashboard can be customized using more than 100 analytics functions, including correlation and predictive functions on any metric data source, he said.

    Those additions come on the heels of a wave of investments VMware has made over the last few months spanning everything from cloud extensions to VMware vSphere to embedding analytics within the VMware vRealize IT automation framework.

    Markovich said Wavefront is adding integrations at the rate of 10 to 20 a month—the total number he said should increase to more than 200 by the end of 2018. As organizations embrace various types and classes of cloud-native applications such as microservices, there is a much greater need for monitoring and analytics, especially as organizations begin to better understand the level of dependencies that exist between thousands of microservices, he said.

    In addition, Markovich noted the number of companies encountering that challenge is also starting to increase as almost every company begins to realize it is a software company that happens to sell something else. That doesn’t necessarily mean every organization will be updating applications at the same rate as a web-scale company, but it does means existing IT processes will need to be modernized, he said—for example, more enterprise IT organizations are starting to create site reliability engineering (SRE) teams.

    That shift may not result in every enterprise application being monitored, but it will most definitely increase the number of application workloads within those enterprise IT environments that are continuously monitored.

    There is, of course, no single definition of what officially constitutes DevOps. Every organization will tailor DevOps best practices to fit within the confines of their existing IT culture. In some organizations that shift will be driven from the bottom up, while others will be transformed by an initiative led from the top. At this point, the single biggest inhibitor to DevOps adoption has more to do with IT culture than any given set of technologies. But regardless of an organization’s level of DevOps maturity, VMware is betting there will soon be many more traditional enterprise IT organizations employing monitoring and analytics a lot more broadly than ever.

    — Mike Vizard