Tag: analytics

  • Quality Is a Top Challenge for Data-Driven Projects

    Quality Is a Top Challenge for Data-Driven Projects

    Software systems continue to produce more and more data. And making use of it has proven benefits — so much so that many analysts have, over the years, referred to data as the new oil. As a result, the majority of organizations are expending effort into refining their data — in fact, a recent study found that 84% of organizations have either already deployed or have data-driven projects on their roadmaps.

    Corporations like Facebook and Google are the poster children for business models that harvest and monetize end-user data. However, this is only one aspect; valuable data is being produced by internal systems as well, which, if leveraged correctly, can provide insight into software observability and increase process automation for DevOps teams and developers. For example, time-stamped application logs are necessary for informing SLOs to maintain reliability standards. There is an ongoing parallel investment into AI/ML deployed with cloud-native tools to act upon production data to drive further business growth. As such, 63% of IT decision-makers say new revenue opportunities have emerged due to data and analytics.

    The 2022 Data & Analytics Study, conducted by Foundry (formerly IDG Communications), explored how data-driven initiatives continue to be an important investment area for executive leadership. Below, I’ll review the key results from the survey to consider how organizations can continue to make intelligent decisions now and into the near future.

    The State of Data-Driven Investments

    We undoubtedly live in a data-driven world, and investment in related projects continues to rise. More than half (55%) of IT decision-makers plan to increase their data-focused investments — the report found the average spend to be $12.3 million in the coming year. This figure rises to an average of $23 million for financial services, which makes sense given the nature of modern banking.

    Naturally, the use of analytics platforms is increasing in tandem with the amount of data generated. In terms of specific analytics tools, 50% of respondents said they used business intelligence platforms while 47% used relational databases and 19% planned to invest in them in the next one to two years.

    We’re also noticing an increasing use of cloud-based solutions. For example, 27% of an organization’s data analytics workloads now run in the cloud. The report also found an uptick in cloud-based enterprise-scale data warehouse technologies, an area that shows signs of increasing in the coming year.

    Common Objectives

    So, what are the most common driving factors behind these types of projects? Well, automating internal business processes is the top goal for data-driven projects—half of IT leaders described this as a primary objective. This is closely followed by other ambitions such as improving customer insights (46%), aiding customer support (43%) and automating IT operations (43%).

    In terms of type, transactional data tends to be the most useful—54% of companies are using transactional data in their data-driven projects. This includes consumer purchasing behaviors such as sales, returns and credits. The next-most-common type is machine-generated data, which includes information from logs, sensors, telemetry, networks, security systems and/or IoT devices. The third-most-common type is customer profile information.

    Data has a powerful impact in a business context as a means to refine existing digital products. Other respondents added that a data-driven approach to DevOps helps increase visibility and drives continuous improvement.

    Data Quality: Highest Ranked Challenge

    Undoubtedly, particular challenges remain. The greatest hurdle is retaining data quality—41% of organizations reported dealing with this issue. Quality may be poor because data is unstructured or incompatible with other sources. Other widespread challenges include governance issues and integrating data from multiple sources.

    For those undertaking data-driven projects, 44% said they lacked appropriate skillsets, such as analytics training, data management, security, business intelligence and integration expertise. Companies also often faced funding and talent-related quandaries when beginning data-driven projects. For example, 26% of small-to-medium-sized businesses lacked the necessary funding to take on data-driven projects, according to the research.

    Another challenging area (that I’ve covered previously) is optimizing how data is collected and stored. As cloud storage fees rise, organizations will likely want to refine retention and resolution to avoid creating unnecessarily large, expensive data lakes.

    Rising Deployment of AI/ML

    AI/ML is already well-established as a way to advance the use of data. More than half (54%) of companies used predictive analytics or planned to incorporate it into their systems in the next 12 months. Just under one-third (31%) also either used or planned to use anomaly detection in the future. These areas along with other functionalities (such as natural language processing and predictive analytics) can be used to aid applications such as process automation, decision support, customer analysis, virtual agents and others.

    The industry is at an exciting moment for leveraging data in DevOps. Data is becoming more and more accessible to enable DevOps with a full-stack picture of the application life cycle. To direct future engineering investment, data-driven decisions will rely on things like performances and usage habits. Thus, it’s an interesting time to consider how you might leverage data for greater process automation and software development fluidity.

    The 2022 Data & Analytics Report surveyed 872 IT decision-makers (ITDMs) from around the globe working in various industries. The respondents’ average company size was about 12,000 employees. To view the report for more insights, you can pick it up here.

  • Why the Built World Needs Standard APIs

    Why the Built World Needs Standard APIs

    Lately, new ESG initiatives have come front-and-center as companies seek to contextualize and limit their business’s impact on the environment. This is especially true for the built world—a term that refers to the human-made environment that provides the setting for human activity, including homes, buildings, zoning, streets, sidewalks, open spaces, transportation options and more—where monitoring energy efficiencies is becoming more commonplace and even required by law. For example, a New York City law now requires buildings of a certain size to post an energy-efficiency score at their entrances. Yet, calculating such a score isn’t that straightforward—there’s a lot of legacy technology in use within most large commercial and residential buildings, and pulling data from these systems is notoriously difficult.

    A building manager may seek greater visibility into these systems to not only determine a building’s energy score, but to program optimizations, inform building security or enact new digitization. But the answer isn’t to hastily rip out and upgrade old hardware—old equipment like AC units and elevators were built to last 50 years or more and could be functioning seamlessly. Instead, this is another area where REST APIs are set to accelerate by uniting legacy integration software and disparate hardware with a standard layer.

    I recently met with Shaun Cooley, CEO and founder of Mapped. According to Cooley, API-driven standards for built environments could open up transparency into hardware component behaviors and the interrelationships between systems within a building. Below, we’ll briefly consider the history of building protocols and look to standards like Brick Schema that aim to unite legacy and modern physical infrastructure. We’ll consider the competitive advantage APIs bring to the built world and how increasing data accessibility could assist operations.

    The State of Physical Building Digital Protocols

    The built world consists of various digital communications standards. Most buildings have many older on-premises protocols for lighting, HVAC, elevators and other systems. For example, many elevators and fire safety systems were installed by systems integrators in the 1970s and adopted connections using Modbus, a communication protocol based on serial connections. BACnet is also commonly used to control HVAC systems and is a step forward from Modbus in that it can more easily connect to IP networks.

    Fast-forward a few decades to the dawn of the cloud; many companies overlaid sensors onto these old systems, explained Cooley. These power-over-ethernet (PoE) or battery-powered systems relay data immediately to the cloud and often speak in proprietary protocols. A single commercial building could easily be juggling a bundle of these various communication protocols, all originating from installations that occurred at different time periods. These nuances mean that you are “constantly dealing with chaos across your portfolio,” Cooley said. There’s so much data, but getting it normalized and usable is very challenging, he said. One must integrate with many sensors and protocols, which he describes as “the dirty plumbing” that no one wants to build.

    There’s bound to be differentiation from building to building, too, which could place a further strain on managing multiple building operations. Without a window into building data, it isn’t easy to know things like the current occupancy of the lobby or how occupancy affects energy consumption. Unless managers can connect the dots between systems, it’s impossible to understand the relationships between components.

    Making a Data Graph for a Building

    For example, take an AC system in a commercial building. Such a unit isn’t as simple as a single-family home’s typical thermostat and furnace. It’s often a mix of a rooftop chilling unit, pipes, pumps and a VAV damper that controls the air. While protocols are good at describing how individual components are performing, the composition of components is really what defines a building’s system and its efficiency, said Cooley.

    According to Cooley, instead of adopting a vertical data schema, buildings require a graph data model to adequately represent hardware interconnections. This is why he’s rallying behind Brick Schema, an open source uniform metadata schema for buildings. Instead of a vertical data schema, Brick Schema is built on a graph data model, which enables more descriptive relationships in a system.

    End Benefits

    Pulling unstructured data from 20 different data lakes into a clean API could allow easier access to new solutions. “We want to make it very simple to build applications for these sorts of environments,” said Cooley. Typically, system integrators must reverse engineer and connect to legacy building hardware, which can become very expensive very quickly, he said. He recommended using a sandbox based on open standards that can easily be rolled out to any building to reduce those hurdles. A more consumable layer with common endpoints could increase developer usability when creating innovative building applications.

    Similar to how Twilio made SMS easy, Cooley said he hopes for a similar proliferation in the built world. Many applications could be built with such an abstraction layer. For example, managers could better understand energy usage to reduce consumption, meet regulations and save money. Or, such an abstraction layer could inform predictive maintenance to create automated alerts before failures occur. There are also plenty of ways to improve occupant experience or intelligently optimize the lighting and temperature in a space.

    “Entirely new business models and concepts emerge that we hadn’t considered previously,” said Cooley. For example, he described a “tailgating app” that uses Brick Schema for a security use case. The app prevents building occupants from letting other people “tailgate” into the building behind them after someone swipes their badge. To do so, the app interfaces with many separate building systems (the elevator system, surveillance system, telepresence systems and other sensors) to ensure the number of people in the building matches the number of occupants that swiped in. A lingua franca helps to connect the disparate hardware involved.

    The Future of Building Automation

    This is by no means the first attempt to standardize building data. For example, the Green Button Initiative provides a standard API through which to download utility use data for electricity, gas and water and share it with solution providers. However, according to Cooley, this information only goes so far. Building owners will require more contextual data on-site.

    For example, perhaps a building’s window glazing is causing specific rooms to overheat in the sunlight. Thermal sensors would spot this condition, but bulk energy consumption readings wouldn’t ascertain the root cause. Access to real-time granular data such as current occupancy count is also necessary for developing on-site applications that better refine exactly how human involvement impacts energy consumption.

    Of course, as building systems become more intelligent, there is the growing possibility of privacy infringement. For example, systems that use facial monitoring and recognition could end up storing personally identifiable information. In that case, you “need to give data owners the control to decide what applications can’t or can’t access PII,” said Cooley.

    While this field has many read-only applications, Cooley predicts future write operations will enable more automation with building hardware. This could allow applying ML/AI to anticipate elevator floor calls. Or, a predictive system could cool a room only when a meeting is scheduled. When such data is readily accessible and available for developers, it presents many innovative opportunities to optimize and interact with the built world.

  • Natural Language Query (NLQ) is Key for Self-Service BI

    Natural Language Query (NLQ) is Key for Self-Service BI

    Modern business intelligence (BI) and analytics software solutions offer more ways to explore data and find insights than ever before. However, ensuring everyone in the enterprise can use analytics independently, when they need it, remains a challenge.

    For analytics to be adopted across the full enterprise, your tools need to be tailored for all users.

    While many BI solutions today provide streamlined experiences, some data literacy and knowledge is required to fully understand them. Dashboards, for instance, are considered self-service BI tools, but they are often still too technical for the average person to use effectively.

    Today, only two out of five (40%) organizations report their people can analyze data without getting help from IT, according to Ventana Research. To better enable business users to interrogate their data independently, certain BI vendors now provide a natural language query (NLQ) capability that sits alongside their dashboards and reporting. Rather than having to search for answers in a traditional dashboard or chart, NLQ allows analytics users to ask questions of their data directly.

    An Overview of NLQ

    Natural language query is a self-service BI tool that provides the ability for an analytics user to ask a question using non-technical language and get an automatically generated answer instantly. Using data modeling and machine learning technologies to parse questions for key terms, NLQ scans related databases and generates a tailored report or chart that provides relevant insight.

    The integration and implementation of natural language query capability, as well as the complexity of the questions and the types of data supported, varies between vendors. The most common and traditional approach is search-based NLQ, which places a free text search bar somewhere within the user interface (typically on a dashboard) that allows BI users to begin typing a question and get a list of reports and charts generated quickly as potential answers.

    A smaller number of vendors also include support for voice commands in their NLQ solution.

    As NLQ increasingly becomes a part of BI ecosystems, however, some vendors have evolved their natural language offering to account for additional barriers: A user still has to know what question to ask, and how they can use it to avoid inaccurate or irrelevant results to their question.

    The new approach is called guided natural language query, or guided NLQ, which takes the concept of NLQ further by programming the solution itself to guide the user as they type a question, helping them structure it using pre-defined sequences and suggested prompts.

    This eliminates the burden of knowledge or any potential problems in accurately interpreting the semantics (language) of a user’s question, as the system itself assists them in building it, from start to finish. They don’t need prior technical knowledge or need to go to IT to get started finding answers from data.

    When employed correctly, guided NLQ can help make the use of analytics more pervasive and open up analytics for every type of business person in the enterprise—not just experts.

    Self-Service That Suits Every Enterprise User

    The aim of NLQ is to help workers not accustomed to traditional, structured BI tools find insights and information they need to inform and make business decisions, while also being a helpful tool for advanced users throughout the enterprise.

    For non-technical analytics users, NLQ is an easy way to get detailed answers from their data faster than exploring a dashboard or chart and use it as a springboard for their ad-hoc reporting.

    Similarly, advanced users can leverage NLQ, whether guided or traditional, to quickly generate a report or chart and further build upon it.

    Generated insights using NLQ can be added into existing analytic content, such as dashboards, reports and data stories, to enhance them with additional detail, relatively quickly and easily.

    Finally, NLQ can be embedded into the interfaces of your users’ workplace applications, to make analytics far more ubiquitous in their day-to-day workflows. They can ask a question, get an answer, and start exploring data much faster and more easily than via dashboards alone.

    Ultimately, having an awareness of your users’ varying self-service BI needs, and how the new wave of tools such as Guided NLQ can help to further open up analytics to more people, will help you ensure your analytics tools are adopted and usable by everyone throughout the enterprise.

  • Using Data Fabric for Real-Time Processing

    Using Data Fabric for Real-Time Processing

    Charlene O’Hanlon and Scott Gnau from InterSystems talk about silos in organizations and how data fabric enables organizations to process, transform, secure and orchestrate data from disparate sources in real-time. The video is below followed by a transcript of the conversation.

    Announcer: This is Digital Anarchist.

    O’Hanlon: Hey, everybody, welcome back to Tech Strong TV. I’m Charlene O’Hanlon, and I’m here now with Scott Gnau, who is the VP of Data Platforms at InterSystems. Scott, thank you so much for taking the time and getting on the call with me, I really appreciate it.

    Gnau: And likewise—thanks for having me. It’s great to be here.

    O’Hanlon: Alright. So, tell me a little bit about InterSystems.

    Gnau: InterSystems is a creative data technology company, we’re based in Cambridge, Massachusetts. We’ve been around for about 40 years, and we actually build data integration, data platform technology that’s used by a lot of very sophisticated applications around the world—in fact, more than half of medical records in North America go through our systems, 15 percent of global equity trades touch an InterSystems data platform or interface along the way.

    So, we’re known for solving very large, complicated, business critical problems that are centered around data.

    O’Hanlon: Well, data is the new oil, right, is that what I’ve heard? Time and time again, so many companies now rely on the data to make their business decisions and find areas of opportunity and so much more just, you know, ways to do their business better. So, data—you guys are definitely in the right space, for sure.

    Gnau: Absolutely.

    O’Hanlon: [Laughter] So, let’s talk a little bit about, then, the issue of silos when we’re talking about data and access to data, especially when we’re talking about things such as customer experience or uncovering those opportunities within the business, whether it’s improving internal processes or external applications and issues and things that do touch end users.

    So, we’ve been talking for a long time about breaking down silos when it comes to data, but do you think that that’s something that’s feasible or do you think that it’s kind of one of those wishes that will never really come true?

    Gnau: [Laughter] I’ve kind of given up on the breaking down the silos, and I’ll back into that with, you know, I’ll hit on a couple of things that you said. Because I think some of the things you said are actually really, extremely relevant, right? Data being the new oil and, you know, people have been saying that, and it’s absolutely the case. If you look at the wealth that was created in the 18th Century, it was railroads, and if you look at the wealth that was created in the 20th Century, it was energy and oil, right? Look at the wealth that’s been created in the last 20 years. It’s all about data centric kinds of companies, right?

    O’Hanlon: Right.

    Gnau: And that’s a really cool thing. And the difference really is, you know, companies can leverage that data not only to understand their business and have a rearview mirror view of what happened in the business and be able to make better decisions about it, but actually synthesize that data into building new businesses for themselves and new ways to interact with customers and so on. So, it’s absolutely critical and important.

    And sadly, I’ve been in industry, I guess, about 35 years. It feels like just five, but a long time. And throughout that career, we’ve been talking about how do we break down silos in data and silos in data processing? And, you know, silos crepe up for many different reasons. They can creep up because you’ve deployed an application that’s very specialized to go solve a problem that’s extremely important and the data that gets collected is kind of in that application and not shared easily, and that becomes, eventually, a silo in and of itself.

    Certainly, there are business model and political silos that get created, right? I’ve got a business unit model and the mortgage folks don’t wanna talk to the consumer lending folks don’t wanna talk to the deposit folks and so on. And it’s also very easy for silos to build up because of geographic differences in the business, right?

    O’Hanlon: Mm-hmm.

    Gnau: And so, this has been going on for a long time, and for a long time, we in technology have tried to solve and advise our clients, “Hey, don’t let silos control you.”

    O’Hanlon: Right.

    Gnau: I would say that the problem of silos and how they come up has actually gotten larger and is increasing at almost an unimaginable pace. Certainly, with the advent of the cloud and microservices and easy to spin up applications, more and more silos can come up very, very quickly. The fact that data and relevant data, the oil of our businesses used to be created inside the business, inside the firewall by our application, so we actually had some semblance of control over it. Now, a lot of the data that we need to use, understand, consume, and drive decisions from may live its entire life cycle outside the firewall of our business and out of our control.

    So, you think about one of the drivers of silos, and it just has now gone kind of exponentially very different.

    O’Hanlon: Mm-hmm.

    Gnau: Certainly, the pandemic has created more geographic silos, but also, the need to be able to deploy data and decision making very quickly as many of us have been remanded to our home offices and trying to manage customer relationships and run our businesses remotely in a new and a different way.

    So, I think kind of the drive for silos is going to continue to increase. And so, I think it’s also then unimaginable to think that we will live in a world without data silos. So, if that were the case, it’s kinda like, how do we come up with an approach that lets us leverage and build beyond that?

    O’Hanlon: Yeah. So, you know, it’s a very good point that you make, the fact that we’ve had so many silos, the number and the velocity of silos has increased multifold, I would imagine, since the onset of the pandemic. And with this remote and hybrid work environment that we’re now entering into, I don’t think those silos are gonna be going away.

    So, short of I don’t know what, short of whatever an organization needs to do to break down those silos, how can an organization work effectively to access that information and to get the information they need and really kind of make the most of it without being able to break down those silos? Is there a way that they can still utilize that information as effectively as they could if there was—you know, if everything was kinda linear and they could just kind of skip across the data meadow, if you will, and kinda pick the flowers as they went along? I don’t know where that analogy came from, but [Laughter].

    Gnau: Well, listen, it would be less interesting if it was equally kind of a serial thing when you go pick up those flowers.

    O’Hanlon: Right, right.

    Gnau: And certainly, we talk and work with our clients, really, about this concept that we call the data fabric and a lot of technology ins and outs and all that kinda stuff with data fabric, which we probably won’t get into a lot today, but it’s almost at a mindset. And the way I describe it, being a pilot myself, is—think about being able to have a control tower kind of impact to how you manage and integrate your silos.

    So, think about control towers in flight, right? What is the purposes of having control towers? Well, obviously, the mission is to provide safe flights. How do they do that? Well, they connect different kinds of data together and synthesize that data for decision making, right? They don’t consolidate it, they don’t fly the planes, necessarily, but they collect that data and then disseminate it in a way to kind of control and coordinate the flow.

    O’Hanlon: Right.

    Gnau: They also, it’s not a single point of contact kind of consolidation, right? There’s a control tower at every airport, right? And they connect to each other as well to manage traffic between their segments and sectors in that grid. And so, the notion of control tower is a way to think about, how do you apply that technologically speaking into thinking about your infrastructure more as a data fabric and the things that are necessary from a mindset—again, not a specific technology or a vendor, necessary—but just a mindset of how to manage through the notion of silos.

    And so, the first thing, really, is something that’s also kind of nontraditional in data processing, at least during my career, it’s all about connecting data and not consolidating data, right? And for many years, it was like, “How do I consolidate all this stuff into one place to make it more manageable to take cost out?” and all that kinda stuff. Again, in a cloud-centric world, almost unmanageable.

    O’Hanlon: Mm-hmm.

    Gnau: So, instead of thinking about consolidating it, really think about how do you connect the different data across different places? And that obviously becomes a key part of your data fabric—the connectivity, the pipes, and the widgets, and how they fit together. Connectivity isn’t enough without context.

    O’Hanlon: Mm-hmm.

    Gnau: So, data that’s created in the silo may have a certain context inside of the silo, but that context needs to be reflected externally just like the control tower needs to understand what kind of plane you’re flying, because they’ll understand the operating capacity of that plane—how fast does it go, how high can it go, and what are its maneuvering capabilities, right?

    Same kind of thing in a control tower kind of aspect to data fabric—connect the data and provide context for the data so that, as the data get connected, there’s some relevance to what is happening and something could actually be derived from it.

    O’Hanlon: That makes a whole lot of sense, and to your point, having the data remain kinda siloed and just being able to kinda select the data that you’re looking for, you know, that’s most relevant to you at that time, I imagine actually, is a little bit easier than kinda sifting through an entire haystack for one little needle. So, that’s a really interesting concept.

    Is this a technology that is currently being used within the data management space, the data science space?

    Gnau: You know, there are more and more people talking about it, and I’m sure there’s some folks that maybe have different words to describe it. We’re thinking, and some of the analysts that we work with as well, are talking about the data fabric. I’d say first and foremost, it’s a mentality, but like I said, connect, don’t consolidate. Provide the context. Have the control towers communicate amongst themselves so it’s not a single control tower but multiple different control towers for the context or the application that’s required and kinda think about the network effect of being able to build that out.

    Once you have that mentality, then it comes down to a checklist of, you know, certainly a list of what is the existing technology that we have and what is the existing technology that we use, how are the data created, how are the data stored—you know, kind of just a roadmap of what ya got. And then, think about the connectivity and the context provisioning that you want to create and look at other technologies that might need to be added to the mix to make that work in an end to end state.

    So, it’s a mindset first, and then it’s a collection of some technologies to enable that, and it’s a combination of the existing stuff that you’ve got, and certainly, an application that’s been deployed in a business-critical nature, you’re not gonna yank that out for some technology decision. So, again, it’s all about that connectivity and fitting it together and piecing it together.

    The other thing that most of the clients that we’re talking with about this are very pragmatic, it’s not a—like anything ever really should be, it’s not a 10-year plan, but it’s an, okay, how do I map this sector? How do I put a control tower at this airport and this airport and how do I leverage that, right? So, how do I go connect this silo and that silo, and then let’s go get the next silo and let’s go get the other business unit and figure out how to kinda build that out over time.

    And what’s really cool is, the value accelerates as you start to collect more of these things together. And, you know, you’ve got three or four and then you add the fifth one—the value doesn’t go up 20 percent, the value actually, of what you can do with that can go up dramatically, much higher, because of being able to understand all of the customer interaction points and create new programs, or leverage that data to actually go build a new line of business that your customers weren’t expecting.

    O’Hanlon: Mm-hmm. Right, right. Interesting. That’s really, really fascinating to me. Now, does this also kinda democratize the data? Does it enable other parts of an organization to access the value from a lot of this data by using this data fabric without the need for maybe a data scientist or somebody who’s a specialist in this in an organization?

    Gnau: Yeah, absolutely, absolutely. And again, it’s a mentality and needs to be kind of thought of with a design going in, right?

    O’Hanlon: Mm-hmm.

    Gnau: So—right, in today’s world, thinking about security and privacy on one plane and then democratization of data on the other plane, they’re almost kind of at odds. So, there needs to be some forethought that goes into what is appropriate for the appropriate eyeballs in these different spaces, and then again, making sure that the technology stack that’s been built out has the capability to deliver that. But certainly, companies that—in my experience, at last, companies that have the most success in kind of refining their oil, their data, are the ones who are actually getting data anywhere that the data need to be for a decision that’s local, right?

    So, you know, people talk about real time decisions and real time AI models and all that kinda stuff. All really compelling, all really valuable, but all completely worthless if you can’t leverage that to deliver a yes to a customer when the customer asks a question, right? And so, democratization and the architectural democratization of the data is an important key component to making your data fabric really successful and really showing up with a lot of value for the business.

    O’Hanlon: And I would imagine that AI, machine learning—you know, those technologies can actually add a whole lot to making this a much more intelligent way of gathering data as well.

    Gnau: Yeah, and it’s a symbiotic relationship, right? So, you know, machine learning and AI are all the rage and all really good stuff. A lot of the math behind it is not particularly new. What’s interesting is, the math behind it dictates that the more data you add to the model, the more accurate the prediction becomes, right? And that is very different than some of the previous kind of data mining and data science stuff that went on.

    And so—okay, that means you need lots of data. How do you get lots of data? Well, you don’t if it’s in a bunch of silos that don’t talk to each other with no context and no connectivity.

    O’Hanlon: Right.

    Gnau: So, I actually think they’re kind of symbiotic in that an effective data fabric could actually enhance the capabilities of your AI programs, and your AI programs can actually enhance the value of your data fabric in return.

    O’Hanlon: That’s really, really fascinating. [Laughter] I love this topic. I think this is definitely something that more organizations should be considering, because you know, especially if you think about just the sheer volume of data that’s out there and, I mean, really, what organization today is not basically putting their entire business on the shoulders of data without having that information that they need to make those business decisions to uncover those opportunities to just basically survive and thrive in today’s environment. I really—short of having that data, I just don’t know how organizations today can do it.

    So, I think anything that’s going to make it easier for them to uncover those areas of opportunity and find those nuggets of information that’s in all of that data, I think, is gonna be a huge, huge value add for organizations.

    Gnau: Yeah. I mean, and the last piece, really, of success for a data fabric and why I think data fabric is so important—I tried to come up with something that started with a C, because I said connect and then context. But the last one really is lineage, because lineage creates trust.

    O’Hanlon: Mm-hmm.

    Gnau: So, you know, it’s interesting, the other interesting thing about some of the AI models out there is that the answers they create are actually sometimes not intuitive.

    O’Hanlon: Right.

    Gnau: And as human beings going to execute these things, we’ve gotta really trust that the models and the data are effectively connected, so that we’re gonna risk our business on these decisions, right?

    O’Hanlon: Yep, yep.

    Gnau: And so, you know, connectivity, context, and ultimately lineage or trust of the data are kind of the three key components, again, of the mentality. Nothing to do with technology, but you’ve gotta kinda build in what’s your framework, what’s your appetite in your business for these pieces and then go look at the technology landscape to start building it out.

    O’Hanlon: That’s a very intelligent way of going about that, too, so—I love that. Scott, thank you so much for having the conversation with me about data fabrics. I know we’re gonna be hearing more about it in the future. I think it’s a great mindset and a great way to approach data access and data use in an organization. So, thanks again for your time and your expertise, I really do appreciate it.

    Gnau: Thank you.

    O’Hanlon: Yeah. Alright. Alright, everybody, please stick around, we’ve got lots more Tech Strong TV coming up, so stay tuned.

    [End of Audio]

  • Allstacks Adds Free Dashboard to Track Software Dev Benchmarks

    Allstacks Adds Free Dashboard to Track Software Dev Benchmarks

    Value stream intelligence platform provider Allstacks today added a free live dashboard populated with anonymized data that DevOps teams can use to benchmark their own progress.

    Hersh Tapadia, Allstacks co-founder and CEO, said the company is making this data available to make it easier for DevOps teams to uncover bottlenecks in their software development processes.

    As part of that effort, the dashboard includes pre-configured benchmarks for the following:

    How many days per week do benchmark teams write code?
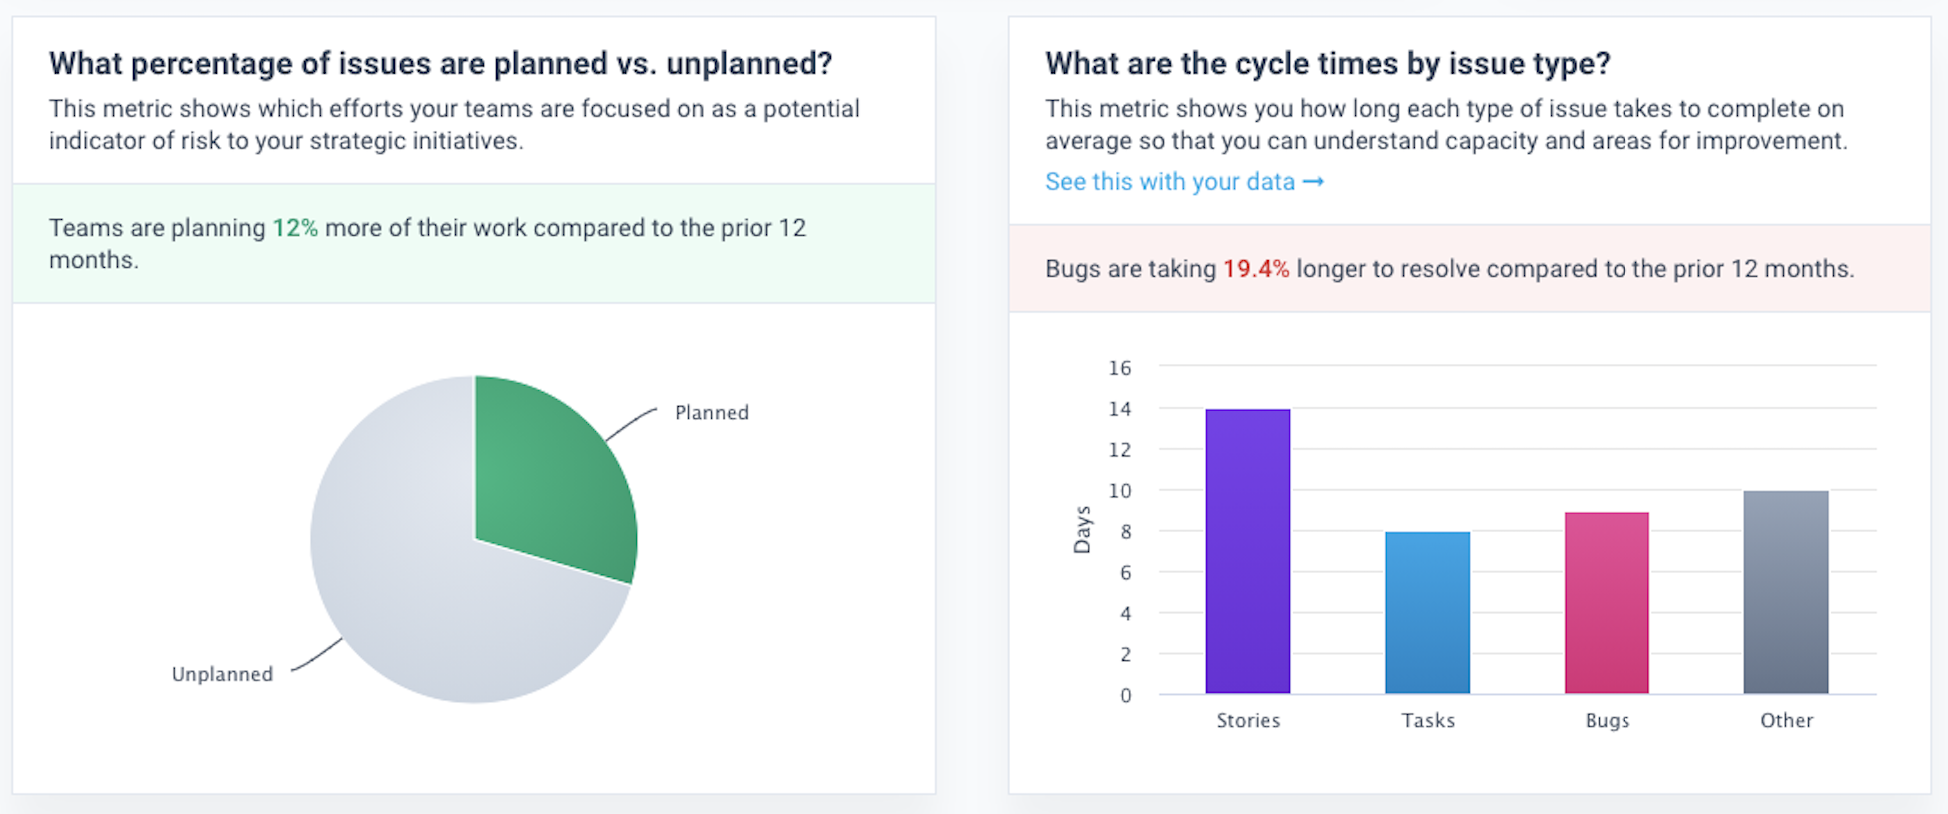
    What percentage of issues are planned versus unplanned for benchmark teams?
    What are the cycle times per issue type for benchmark teams?
    What types of code do benchmark companies produce?
    What is the average commit size for benchmark customers?

    Allstacks

    Allstacks has committed to making 12 months of data publicly available on the dashboard and said it will update that data on an ongoing basis. Allstacks customers, however, can also access five years of data to compare historical trends.

    Tapadia said Allstacks plans to add additional benchmarks to a dashboard that can collect data via the various application programming interfaces (APIs) that most DevOps tools now routinely provide. The overall goal is to increase transparency into software development processes, he said.

    Allstacks’ value stream intelligence platform uses machine learning algorithms and artificial intelligence (AI) models to identify projects that are at risk of not meeting delivery goals. That data is then used to analyze the impact those missed deadlines are likely to have on various business objectives.

    Value stream management platforms automatically take technical metrics, gathered via a DevOps process, and match them to a set of key performance indicators (KPIs) defined by business leaders. The challenge many organizations still face is making sure they have the tools in place to collect the appropriate technical metrics and then define the KPIs that truly matter to the business. Once those metrics are gathered and KPIs established, organizations are then able to apply advanced analytics to the massive amounts of DevOps data they collect.

    The concept of value stream management traces its lineage back to lean manufacturing methods, which called for each step of a manufacturing process to be continuously measured. As software development has evolved from being a craft to a process that is highly automated using DevOps best practices, an appreciation for the value of monitoring the impact of missed software development deadlines on the business has grown as organizations realize how dependent they are on software.

    As a result, more organizations realize there is a clear disconnect between their business goals and development processes, noted Tapadia. Business leaders are especially anxious to understand how a software development project delay might impact future revenue projections. Rather than being a set of tools employed mainly by IT leaders to track software development projects, value stream management platforms make it possible for other stakeholders to track KPIs spanning multiple software development projects. It then becomes easier to make informed decisions about how to reassign resources across various projects as different bottlenecks are encountered.

    It may be a while before organizations achieve that level of transparency into their software development processes, but as software continues to ‘eat the world,’ it’s only a matter of time before value stream management becomes a required set of DevOps tools for every organization.

  • Why DataOps is Critical for Digital Transformation

    Why DataOps is Critical for Digital Transformation

    Data lies at the heart of all digital transformation. In fact, today, as organizations look to further accelerate their ongoing digital transformation initiatives, companies are looking to extract even more value from their data, to better drive corporate decision-making, help grow the business, improve customer satisfaction and gain a competitive advantage. 

    Inspired by DevOps, DataOps, which Gartner defines as “a collaborative data management practice focused on improving the communication, integration and automation of data flows between data managers and data consumers across an organization”, has grown in popularity in the past decade as organizations seek to accelerate the delivery of business value from their data. But taken even one step further, enhanced data operations (i.e. more than DataOps) can help organizations maximize the business value of the data they own and also the infrastructure in which the data resides to increase data quality, reliability and availability in a hybrid cloud environment. This enables organizations to further improve business resilience and digitalization through collaborative, data-centric operations in an increasingly complex, interconnected world. Particularly as hybrid and multi-cloud environments proliferate and it becomes harder for teams to understand, analyze and streamline data usage.  

    DataOps Enables Digitalization

    By 2023, IDC predicts that 52% of worldwide GDP will come from products and services delivered by digitally-transformed enterprises—and according to Gartner, 91% of enterprises are already involved in some sort of digital initiative. This means that organizations already engaged in digitization are paving the way for a new future of business—commerce, production and innovation. But digitization is only half the battle—the other half (i.e., digitalization) comes from investing in understanding those digitally-driven insights and using those learnings to fuel business growth. 

    In the face of stifling market competition and evolving customer demands, the key differentiator in market leadership today is data and operationalizing that data. Hence, the difference between the market leaders and followers boils down to this: Data operations. Data operations not only plays a vital role in empowering ongoing digital transformation initiatives (think hybrid cloud operations, DevOps optimization and application modernization; data is at the core of all of these efforts) but also serves as a foundation for faster, better-informed innovation—fueling organizational growth and propelling businesses ahead of their competition.

    Who is Driving Digitalization?

    To gauge where your organization stands on your digitalization or digital transformation roadmap, you must first identify who within your organization is driving it and who’s involved. The latter is an easy enough guess—because, essentially, it’s everyone. 

    Although digital transformation is defined as the transformation of the digital operations of an organization, it reaches far beyond IT to all major functional departments and requires a cultural change to reach its fullest potential. That includes everyone from the chief information officer (CIO) and chief data officer (CDO)—collaborating with key stakeholders to map out and define digital transformation strategies and efforts and communicating goals and objectives—to the technical and professional teams—working closely with business units to design and operationalize new architectures and technologies to advance digital transformation initiatives. At the core of all of these modernization efforts is data; the metric for business success in the digital age. As such, integrating DataOps into your digital transformation efforts from the start is mission-critical. 

    As the market becomes increasingly competitive and business leaders look for new ways to grow and expand their business, data will remain a key catalyst in achieving those lofty digital transformation goals. By gaining intelligence from their data, companies can realize the ultimate goal of data empowerment—where all employees have simplified, secure levels of access to the high-quality data they need to do their jobs—enhancing operational efficiency, improving business outcomes and fueling business transformation at scale. 

  • The Power and Potential of Stored Procedures

    The Power and Potential of Stored Procedures

    One way of saving time when writing code is with stored procedures; prepared SQL code that you can save so the code can be reused over and over again. Stored procedures are a powerful vehicle for speeding up your code and giving you gains in performance. 

    Stored procedures have many benefits—they can be easily modified, are reusable and they possess the ability to automate a task that requires multiple SQL statements. Another advantage of stored procedures is the ability to access or modify data in a database.

    Before incorporating stored procedures, it’s important to know exactly what a stored procedure is, how it differentiates itself, how to create a stored procedure and how to use them in embedded analytics.

    Performing Tasks With Stored Procedures

    A stored procedure is defined as a set of SQL statements and other PL/SQL constructs that are stored in a relational database management system as a group that you can save and reuse. A stored procedure can be comprised of multiple SQL statements like SELECT, INSERT, UPDATE or DELETE. These statements run as a unit and are used to solve a specific problem or perform a set of related tasks.

    Stored procedures are among the most frequently used and most popular database subjects. Using stored procedures can help simplify and speed up the execution of SQL queries.

    Stored procedures can reduce network traffic between servers and clients, for example. This is a result of the commands being executed as a single batch of code rather than multiple. Rather than every single line of code being sent for execution individually, only the call to execute the stored procedure is sent to the server.

    The other benefits of using stored procedures include maintainability, performance and efficiency and complex business logic. And maintaining one stored procedure is easier on the server than maintaining copies on multiple machines. Procedure scripts are stored in one location and they can be freely used in other applications, too. In the event of a definition change, only the stored procedure will be affected—not the application that calls it.

    Advantages of Stored Procedures

    Once you compile a stored procedure, it can then be used many times. This can save a lot of time writing, especially if you are doing ad-hoc queries. This also gives you a slight performance edge on the first execution of a stored procedure over the first execution of an ad-hoc query.

    A stored procedure is ultimately a function call on a database. You may include IF statements, LOOPS, security checks and more to ensure the correct data is being sent back to the call of the stored procedure.

    Another advantage of stored procedures is that they are easily modified. Simply change one or more statements in a stored procedure with the ALTER PROCEDURE command and it quickly updates the results sent back to the calling app. Unlike a middle-tier component which includes business logic that would need a potentially costly re-deployment, a quick change to a stored procedure takes seconds.

    Another benefit of using stored procedures is the security it provides to its data source. The security of an application can be enhanced when using stored procedures by restricting unauthorized access. You may grant someone access to a procedure that updates the database table without allowing access to the table itself. You may also use stored procedures to “hide” the underlying table names from the end user of the stored procedure. Since the caller of the stored procedure has the name of the stored procedure and not the name of the tables used in the stored procedure, they cannot directly access the tables with your data.

    Best Practices For Creating a Stored Procedure

    Creating a new stored procedure is fairly straightforward. Here are the three basic steps:

    1. Within the SQL Server Object Explorer, right-click on the Stored Procedures node under Programmability.

    2. Within the New Stored Procedure Template, modify the CREATE PROCEDURE statement to include the tables, parameters and query options to return the desired data from the stored procedure.

    3. Within the Toolbar, click the Execute button to compile and save your stored procedure.

    There are multiple tools you can use to create stored procedures. Using the interactive SQL Server Management Studio is the easiest, as it gives you an easy way to start connecting to many different types of database servers, including Azure and SQL Server Analysis Services.

    Behind the Scenes in Embedded Analytics

    More organizations are using data to predict future outcomes and stay competitive, offering their customers what they want when and where they want.

    Embedded analytics business intelligence software holds the key to unlocking the power of data. Stored procedures can be incorporated into embedded predictive models and continuous computational language code for data streaming scenarios.

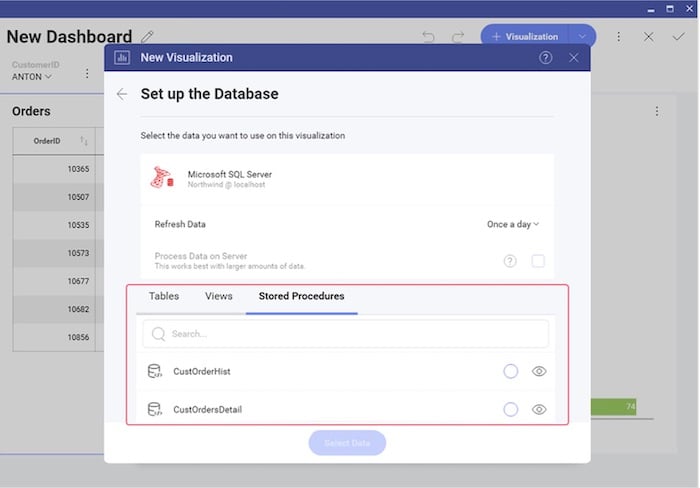
    To create a new visualization on a database that supports stored procedures, first review the list of stored procedures that are available. You will treat the stored procedure you select just like any other data source. The only difference is a parameterized stored procedure, which you can use in a Filter by passing variables to the stored procedure.

    Some embedded analytics platforms, for example, offer complete programmatic control over stored procedures and parameters via code. To pass a stored procedure name, as well as any required parameters, use the ChangeVisualizationDataSourceItemAsync function. This is an example of passing a stored procedure named CustOrderHist and passing the CustomerID parameter in the Reveal platform.

    The Power of Stored Procedures

    Stored procedures are a powerful tool to query a database and return results to a calling app. They are secure, offer performance advantages and are easy to maintain and modify. Stored procedures can be a good avenue for simplifying the way you present data and deal with parameters in your application code versus using error-prone and lengthy ad-hoc queries. As you develop applications, you may want to consider incorporating useful stored procedures in your next project or visualization database.

  • Why an Embedded Analytics Maturity Framework is Essential

    Why an Embedded Analytics Maturity Framework is Essential

    Contextual analytics, or embedding analytics directly into a business application’s transactional environment and core workflows, is the most sophisticated stage of business intelligence (BI) currently available to organizations today. It is one level ahead of the traditional integration of analytics, which is a standalone capability presented as a separate dashboard or reporting module.

    Today, there is an increasing shift among organizations toward embedding transactional analytics into their enterprise applications. Because contextual analytics is the most advanced option in the market, there is also an increasing need for assessing our analytics readiness first.

    The fundamental difference of contextual analytics lies in how it offers analytics to the user to explore data or derive insight within their transactional environment rather than accessed as an external tool. This approach requires a deeper evaluation of the product’s analytical maturity level using a formal framework. Having such a framework can act as a deployment guide for your developers for every stage of embedded BI implementation, including contextual analytics.

    But first, what makes contextual analytics so different that it necessitates a readiness evaluation?

    Contextual Analytics Vs. Embedded Analytics

    With contextual analytics, dashboards, reports and charts are no longer separated but are part of the main user experience. This integral change necessitates a closer look at your data and integration capabilities to align what it brings with all aspects of your software, including existing analytics.

    Embedding these elements directly into core software workflows isn’t a replacement for any existing analytics, but is instead another big step toward making data and analytics a more seamless part of your end users’ everyday work.

    It should be stressed that contextual analytics accommodates various levels of implementation and business requirements. Analytics can be embedded lightly, such as in the form of basic in-line charts and graphs users can see as they explore your software, or embedded deeper to offer AI-assisted insights and real-time alerts that trigger action from users while they work. It can be integrated with an experienced BI vendor partner or in-house if you possess the skill set internally.

    Avoidable Pitfalls of an Improvised Approach

    The need to assess your application’s analytical maturity and readiness for embedding analytics directly into the transactional workflow comes down to avoiding unnecessary BI roadblocks. 

    For many organizations, BI and analytical capabilities are traditionally lower in priority than other aspects of the software. Intending to add BI features later is well-meaning and understandable, but leaving developers to add in features intermittently and leaving it to your users to demand them when needed creates an issue of visibility. Vendors typically lose sight of what their application currently is capable of analytically, or what development needs to make the addition of a new feature not only technically achievable but worth the time and cost investment.

    If you take the time to reassess your application’s analytical capability, your developers and leaders can better understand that your product could be at an earlier stage of readiness than previously believed, and prepare accordingly before seeking out a contextual or other BI solution.

    For example, approaching contextual analytics ad-hoc could mean you find an unexpected older dashboard module, a cost that could have been accounted for in a formal maturity assessment. 

    What it comes down to is this: Implementing a basic dashboard module or data export feature, completely separate product features, is fundamentally different from fully embedded analytics in your users’ core workflow experience. Pursuing a formal evaluation to guide the introduction of contextual analytics—or even a form of embedded analytics at an earlier stage—means your users and product receive the best type of analytical capability your business is ready for today.

    The Five Stages of Embedded Analytics Maturity

    Based on our experience, there are five possible stages of product development, as illustrated in the embedded analytics maturity curve below. As contextual analytics is the final, most advanced stage of an embedded analytics integration available to product owners, the need for a formal assessment of maturity is most important, should it be the target state.

    Accelerating the implementation of contextual analytics comes down to your skillset, which will allow you to identify and evaluate your state of readiness accurately and determine a BI solution’s flexibility. If you do not have the internal expertise, implementing contextual analytics is easier with the help of specialized BI vendors that can help you in your assessment, and offer a contextual analytics platform built around openness. We recommend you look for vendors and partners that allow for:

    • Advanced APIs that lower total integration time and ensure the need to rearchitect the software is minimal to zero.
    • Customized experiences to make your desired contextual linkages, such as showing a user a relevant embedded chart when they click on a table of a client, possible.
    • An open platform that allows for options for on-premises, cloud, multiple operating systems that guarantee long-term security, scalability and flexibility with your analytics.
    • Rapid adaptation to your product development roadmaps with automated processes and administrative tools to lower total cost of ownership
    • White-labelling to make the rebranding and blending of the analytical solution and your native application components seamless.

    Ultimately, having an awareness of your product’s readiness and taking the time to examine your application’s current state means you avoid costly integration mistakes, save time and ensure developers implement the best solution according to your exact needs now.

  • Harnessing the Value of Log Data Analytics

    Harnessing the Value of Log Data Analytics

    Each day, the average enterprise’s cloud applications, containers, compute nodes and other components throw off millions of tiny logs. Each log is a file whose data describes an event such as a user action, service request, application task or compute error. Logs also capture messages that applications and other components send to one another.

    There’s a wealth of information and value hidden in those logs, which is why businesses are so keen on using them to address business needs like customer engagement, IT security and cloud operations. 

    The need for understanding and managing this data is so high that Markets and Markets valued the market for log analytics data at $1.9 billion in 2020. Analysts predict this to grow to $3.7 billion by 2025. It’s not just the sheer growth of data driving this market—it’s also the demand to gain business insights. 

    That’s why ChaosSearch recently conducted a survey to better understand how businesses are currently using and managing their log data. Insights were collected from practitioners at 50 medium-to-large enterprise organizations. What the survey found is that organizations see a lot of value from tapping into their log data to achieve better outcomes across both business and IT functions. That said, these practitioners face challenges handling the scale requirements and they know there are still more opportunities for them to expand the scope and discipline for log management.

    Top Use Cases

    This study confirmed that businesses are using log data in a number of ways, spanning both business and IT functions. We see that more than 90% of respondents are using log management and analytics for at least two primary use cases. It’s not surprising that the top use cases for log management are security (70%) and IT monitoring (68%), but many are prioritizing BI & analytics (46%) and business operations (28%) as well.  


    It’s interesting to look more closely at the security use cases: Investigations (45%) and insider threats (45%) top the list of SecOps uses for log data. Audits and compliance (32%), threat hunting (32%) and anomaly detection (30%) also made the list. 

    Growing Desire to Support Business Operations

    We also saw that these practitioners want to use log data to support business operations—specifically to drive better business outcomes and improve competitiveness. For example:

    1. A global industrial equipment manufacturer attached IoT devices to farm equipment to track weather, temperature, humidity, time of day, depth of planting, soil conditions, seeds planted and geo-routing on farms. This raw data is continually collected and analyzed within the central log analytics solution, thereby allowing the vendor to deliver farm productivity reporting and recommendations back to their clients.
    2. A biopharmaceutical firm tracks cell culture logs with alerts on temperature and humidity. The company uses its log analytics platform to store long-term data to run queries that help in hypothesis testing. They also conduct various long-tail analyses that reveal trends and allow scientists to make informed decisions about future experiments. 
    3. A large online retailer leverages log data from web visits and other customer activities to develop 360-degree profiles of customers and analyze the steps in the “customer journey” to identify opportunities for improved efficiency and increased revenue capture.

    Tackling Challenges of Growth and Complexity

    Even with more interest in using log data for security and business operations, the surveyed practitioners called out a range of challenges. The top three being: Complex infrastructure (48%), managing costs (42%) and managing growth (34%). They also said the lack of centralization, reporting and data quality were problems. These challenges are perhaps exacerbated by the expectation that data will continue to grow and data retention will increase. 


    There are a lot of variables that drive the volume of log data generation, like the number of users, devices, applications, IT environments and infrastructure elements. The survey found two things were universal—data growth rates are high and are a source of pain and data retention is an increasing priority. 

    Among the participants, 94% ingest at least one TB or more of data per day, with 18% in the 10TB + range. Consider this—the average daily ingest volume for these companies was 7.9 TB! 

    The problem is, despite the massive amounts of data being ingested daily, only 28% of respondents are capturing 80% of log data or more today. And 78% believe that capturing more than 80% of log data is ideal. That’s a big gap. 

    Practitioners Rate Most Important Log Management Capabilities

    We also learned that these practitioners are generally satisfied with their existing solutions, but many of them still expect to bring in a new solution for log management and analytics within the next three years. That’s because they want better scale and a cloud-native solution. 

    When we asked about important capabilities for a log management platform, scalability (58%), resilience (54%) and advanced analytics (52%) topped the list. 


    Budgets Increase to Meet Demand for Log Analytics

    To address these challenges and opportunities before them, survey respondents are growing their budgets; 86% anticipate their budgets will grow by at least 20% and 36% expect an increase of 50% or more. These budgets will not only support more data capture and increase retention periods but also help them go after the growing use cases for supporting the business. In fact, 68% said they expect the number of use cases to grow in the next 12 months.

    There is no doubt: Companies who value log data and invest in capturing data will harness insights that will propel their businesses forward.

  • DataOps: How to Turn Data into Actionable Insights

    DataOps: How to Turn Data into Actionable Insights

    Enterprises‌ ‌have‌ ‌struggled‌ ‌to‌ ‌collaborate‌ ‌well ‌around‌ ‌their‌ ‌data, which can impact everything from digital transformation to advanced concepts like AI and ML.‌ ‌DataOps is not without challenges; building, managing and scaling data pipelines requires careful thought around reusability, portability across infrastructure and applications and long-term maintenance and governance. And these are just a few of the issues facing enterprises. For this reason, DataOps technology stacks need to focus on providing key capabilities include data extraction, integration, transformation and analysis.

    The Importance of DataOps

    The enterprise is undergoing a seismic shift from siloed application development and data repositories to more composable and reusable architectures. Additionally, there is a growing demand for speed and agility as well as the influx of disruptive technologies such as the cloud, IoT and AI. Organizations that want to win big must act and adapt quickly to deploy and scale new software and solutions that provide customers with a superior experience and satisfy their rapidly evolving needs. To do that, they also must be able to rapidly aggregate, integrate and analyze data sources.

    Even with this need for speed, the tools and processes for the creation and processing of data are not standardized‌ in‌ a way that promotes rapid innovation‌ and ultimately helps organizations transform. DataOps is critical to address the challenges involved in acquiring, storing and governing data. In addition, companies are dealing with increasing complexity in their IT environments. In a recent survey, more than 80% of enterprises have a hybrid cloud or multi-cloud strategy. In order to have cost-effective and secure management of increasingly large amounts of data, enterprises must adopt DataOps.

    Managing Data Growth

    DataOps has been around for about a decade, but has recently gained momentum because of the overwhelming challenges companies face today in dealing with large, complex sets of data that are being generated at increasingly faster rates. With new technologies like the internet of things (IoT), cloud computing and the power of big data now integrated into everyday use, companies are generating at least 50 times more data than they were just five years ago. And with more data comes a need for greater efficiency and higher demand for data experts.

    DataOps potential impact on businesses might lead you to think of it as a radical new methodology. But many companies have already been using similar practices to deal with some aspects of data management, particularly around data warehousing and analytics. And just like DevOps, DataOps isn’t a product, but rather a cultural shift supported by many products—many existing products. So it’s important for businesses looking to adopt DataOps to consider what they already have, such as enterprise data warehouses and ETL tools, and what they may need to acquire, replace or modernize. In the end, companies will end up with several systems to support the data pipeline.

    DataOps and Big Data Challenges

    Most enterprises have invested in significant data infrastructure to extract, load and store their data to take advantage of Big Data analytics and technologies. However, these infrastructures are often layered, hard to manage and full of legacy tools that hinder the transfer and integration of data. Additionally, organizations have invested significant resources in tools such as data warehousing and data marts. These data warehouses have been used to model data but have been typically implemented with a predefined data model. A business intelligence (BI) system, an enterprise data warehouse or any other set of tools might assist in the execution of a data transformation job.

    The technological revolution is creating unprecedented opportunities to make things happen with data. By analyzing the data that powers modern business, we are able to provide value in every dimension of our organizations. As is the case with every transformation, the benefits of building an integrated, self-service analytics environment will be realized by users rather than IT. Leveraging the power of data science, business leaders can achieve operational excellence and compete effectively against the growing waves of competitors. For the data science and analytics staff to be successful, they must be exposed to all of the necessary technology and processes to support effective use of data.