Tag: analytics

  • EP 17: Lies, Damn Lies and Metrics

    EP 17: Lies, Damn Lies and Metrics

    In this episode of DevOps Unbound, hosts Alan Shimel and Mitch Ashley are joined by Helen Beal of the DevOps Institute, Viktoria Praschl of Tricentis, Frank Ohlhorst, principal analyst with Accelerated Strategies Group and Alex Hidalgo of Nobl9 to discuss how to use DevOps metrics effectively to improve delivery performance and help teams become high-performing with a culture of continuous improvement. The video is below and a transcript of the conversation follows.

    Alan Shimel: Hey, everyone. This is Alan Shimel and you’re watching DevOps Unbound. DevOps Unbound is sponsored by Tricentis and we’re happy always for their sponsorship and helping up put this show together. DevOps Unbound is an every-other-week session with experts from around the world talking about relevant topics to DevOps. In addition to that, about once a month or every six weeks we will do a live roundtable which is open to you, our audience, to come on, come in, ask questions live, and really kind of steer the conversation. We do have another live roundtable coming up. If you check the devopsy.kinsta.cloud website you can register for that. Today’s conversation, though, is prerecorded and unfortunately that means I get to ask all the questions, not you.

    But let me introduce you to what I think is an amazing panel we have lined up for us today. Well, actually, before I do that let me tell you what we’re going to talk about today on DevOps Unbound. So, it’s the issue of metrics and kind of the ghost in the machine, the dark side of metrics – lies, damn lies, metrics – whatever you want to call it. How do we measure success or failure? How do we measure progress in things, in areas like DevOps or digital transformation? What does success really look like? Our panel is going to talk about that today. Let me introduce you to them.

    First, I’m happy to introduce Frank Ohlhorst. Frank, if you wouldn’t mind saying a few words about yourself?

    Frank Ohlhorst: Sure. And I’ll be quick as not to bore people.

    Shimel: Okay.

    Ohlhorst: I’m Frank Ohlhorst. I’m a journalist, author, and consultant. And I currently work over at DevOps as a contributor, at Security Boulevard as a contributor, and I am also a contributing analyst. And that’s pretty much my story, other than I’ve got 30-plus years – I hate to date myself – 30-plus years in the IT field and I’ve worked both for the federal government, I’ve been a developer, and I’ve put a lot of effort into cybersecurity.

    Shimel: Excellent. Thanks, Frank. Next, let me introduce you to one of my friends from the other side of the pond. I’ve known her now for eight years or more. The one and only Helen Beal. Helen, welcome.

    Helen Beal: It’s a pleasure to be here as always and spending time with you and the others. So, thank you very much for the opportunity. I’m Helen Beal. I’m Chief Ambassador at DevOps Institute, and therefore one of the co-creators of ADOC, which is the Assessment of DevOps Capability, which I may mention once or twice during today’s session. I’m also chair of the Value Stream Management Consortium, and prior to all of that I was coaching in DevOps in a number of different companies across Europe and the Middle East for several years.

    Shimel: Thank you and welcome, Helen. Next up, let me introduce you to Viktoria Praschl. Viktoria, if I mispronounced your last name I apologize. I just realized when I looked at it that I thought I remembered it, but maybe not. Go ahead.

    Viktoria Praschl: It was totally correctly pronounced, so you did a good job.

    Shimel: Thank you.

    Praschl: Hey, everybody. Happy to be here today. I’m Viktoria Praschl. I’m with Tricentis, a software and quality assurance company based out of Austria and Vienna. And I’m responsible for our UP and sales and transformation team where we work a lot with customers on how they transform their organization when it comes to DevOps and quality assurance.

    Shimel: Excellent. Thank you, Viktoria. Our last panel member today also is somewhat of a regular; he’s been with us a number of times. And that’s author, expert Alex Hidalgo. Alex, why don’t you give them a little background and welcome?

    Alex Hidalgo: Thanks so much, Alan. Hi, my name is Alex Hidalgo. I am the Director of Site Reliability Engineering at Nobl9, which is a startup focused entirely on providing the best possible service level objectives, the best possible SLO platform. I’m also an author of Implementing Service Level Objectives, and I’ve been working in this space for – in some way or another the last two decades or so. My current area of research is really into how to bring reliability lessons from other industries into the tech world and what we can learn from others.

    Shimel: Excellent. Thank you, Alex. And then, last but not least, my cohost for DevOps Unbound, my partner in business, Mitch Ashley. Mitchell?

    Mitch Ashley: As always, good to be with you, Alan. And I love our panel. You all are fantastic; I’m excited to hear what you say. As Alan mentioned, business partner and cohost. I run Accelerated Strategies Group, an analyst firm that’s focused on DevOps, cloud native, cybersecurity. And also, I serve as CTO with MediaOps, the company that puts this event on. And both a practitioner and product creator in software, software as a service, cybersecurity for a number of years. I’m not going to name or number how many they are, so you’ll have to guess.

    Shimel: [Laughs] Okay. I’m not guessing. But anyway. All right. Let’s get into this week’s DevOps Unbound. So, I remember a VC mentor of mine getting up in front of – we had launched a new company, he stood up and said something to the effect that in this brave new world we all live in everything can be measured and we measure everything, and it is based upon those measurements we determine who wins and who loses and by how much.

    So, that was 20 years ago, maybe more, a little more than 20 years ago: 22 years ago. I wonder, is it still true? Or have numbers, like everything else, with fake news and all of that, kind of lost their meaning and lost their importance in today’s organizations? Helen, can you –?

    Beal: I’m not sure it’s ever been true. From my experience with metrics I think what I’ve always observed is just people fall into one of two camps. So, either they’re not measuring enough, or they don’t have enough metrics, or they have far too many. I think there’s a cognitive load limit on how many metrics we can handle and we probably need about a handful.

    I think it’s true that we need to have telemetry everywhere, which is of course a very popular DevOps adage. I think we need to have the facility to be able to get to the metrics that we want, but we have to be able to choose them and be able to think of them as an adaptable framework. So, for example, deployment frequency, of course a very popular metric in DevOps, is very useful if you’re moving from deploying every three months to once a week or more. But once you’re deploying several times a day it’s a much less interesting metric.

    The adage I always use is if you can’t measure it you can’t improve it, which is a Peter Drucker phrase. And I do have a problem with that as well because I think you can improve things without measuring them. But the thing is that you’ll never know. And to me that’s the most important thing about measurement: It’s about being conscious about what you’re doing.

    Shimel: Guys, any thoughts on that?

    Ohlhorst: I think it also comes down to an issue of context. People can measure whatever they want out there and they often do, and they spend so much time measuring that they don’t take into account the context of the measurement. You can measure certain processes in the DevOps process and they really don’t matter when it comes down to it when you’re looking at trying to achieve a particular goal.

    Shimel: They don’t. You know what, Alex, we’re going to let you go, and then, Viktoria, you follow up.

    Hidalgo: Yeah, I think one of the big problems that I often see is that people end up trying to measure themselves against others. They hear “Oh, at my last company” – or “I heard at Google or whatever they’re able to deploy X number of times a day and let’s aim for that.” But why? Do you need to deploy that many times a day? Is it actually applicable to you or your application or your organization or your customers? Are you actually gaining anything from trying to do things the way you know others are? Every situation is unique. Every company is unique. Every organization is unique. Every application is unique. And that means you really need to take a step back and think about “What is right for us? What do we need to improve upon?”

    Praschl: Yeah, that’s what I really wanted to say, basically similar, that you take a step back and you really need to look at what’s your baseline. Where are you and what do you want to achieve? What are the outcomes you’re looking for? And I think it’s very important: The metrics will change over time depending – as you mature your processes and as you mature in your organization you will have to constantly change and adjust your metrics which you are measuring. So, I think the key thing is to really initially take a look: “Where am I? And what are the most important initial metrics where I start with?” And then, constantly, basically changing and improving toward further goals.

     Shimel: Great. I think – I’m reminded of the adage “Just because you can doesn’t mean you should.” And I think that’s where we have – and not just in DevOps, frankly, in IT in general. That’s where we run into problems. Because it’s digital almost by definition it’s very easy to grab metrics on all of these digital things, on all these. But just because you can doesn’t mean you should. And just because you can doesn’t mean it’s necessarily indicative. I think, as Helen mentioned, when you’re going to a release a quarter to a release a week, ooh, that’s big news. That’s good metrics. But – and to Alex’s point, not everyone needs to be Google or Amazon and release hundreds of times a day or whatever it is – dozens of times a day. And I think that’s where we get ourselves kind of wrapped around the metrics axle.

    Ashley: I think it goes back to the question of why. If you don’t understand why you’re measuring something, then why do it? Because everybody is not going to be on the same page about how you want to utilize that information. I think about the VC quote that – I remember I was there for that too, Alan. And in a financial world winners and losers, how much return on investment, that’s pretty clear. But I also think there’s a lot of fear around numbers because people are afraid that it’s going to be used against them or it’s not going to be understood, what they really mean. In a continuous improvement context it’s really to – that’s an aid to help you get better and know if you’re getting better, and you have to decide if it’s the right things, which you’ve got to put that context, as Frank mentioned.

    And we have to be on the same page about what it is we really – what does it mean to put a release into production? Is that really – is that a canary release? Is it a real – across every data center that we are in the cloud? What does it mean to do a release? So, you have to get to that specificity. We’re all in agreement that’s – and that’s important to us because we either want to measure ourselves by it or improve at it.

    Beal: I think it’s been implied by a lot of the speakers already, but I just wanted to really want to say explicitly as well that I don’t think metrics shouldn’t be inflicted on people. They should belong to the team. The teams need to generate them themselves. You can set things like KPIs at a higher level and have them connect, but things like OKR should be really generated and owned by the team themselves. And that really speaks to some of the cultural elements at DevOps, which are much harder but not impossible to measure, but things like distributing of autonomy – sorry, distributing authority and having autonomy at the team level to choose and define and improve the work, and that move from leadership from being managers and leadership becoming coaches that are moving impediments out of the way.

    I think, Alex, you were inferring this as well, the importance of the team-level metric.

    Hidalgo: Yeah. One of the things I’d like to kind of bounce off there is I explicitly try to always use the word “measure” because “measure” means something different then “collect.” I think Helen mentioned earlier it’s good to have telemetry everywhere, and so you have numbers everywhere, you have metrics everywhere, you have time series everywhere. And you run into the multiple comparison problem where you don’t really know what you’re looking at anymore. You run into spurious correlations. Have you ever seen that website where it can track people drowning in pools correlates almost perfectly with the number of Nic Cage movies released each year and things like that? And that’s where you end up when you have too many numbers.

    And that’s why I always like to say you measure, because “measure” means you’re taking the important signals out, and you measure flour to bake a cake; you don’t just collect flour. Otherwise, you’re going to not end up with a cake. And it has to be an intentional act, and this kind of – like Helen just said, you can’t inflict metrics on people. You need to let them collect it correctly and measure it correctly.

    Ohlhorst: If we look at DevOps from the pipeline’s perspective it starts to become clear maybe where we should be measuring things or why we should be measuring things. And one of the first things that a lot of organizations run into when they implement a DevOps strategy is they run into bottlenecks because they did not consider certain things. So, perhaps the first place to start with measurement is to try to identify bottlenecks and then go from there. This way you’re improving your process while you’re getting some value out of the metrics, and you’re also establishing what type of metrics you need.

    Beal: I’m glad Frank brought that up because I really think that – for me, there are two classes of metrics, though, that are the most important and underpin everything. And one thing I will say about the DevOps pipeline is in my opinion it doesn’t start early enough. There’s that fuzzy front end and I think we need to expand it right back to where the idea happens. But my duality of metrics is basically if we measure flow and we measure realization of value we really have a concept of what the customer experience looks like. So, we know how fast we’re able to deliver the things that they need and we’re starting to understand whether we are actually delivering the things that they wanted.

    Hidalgo: And I just wanted to add: Frank’s point about bottlenecks is great, but we can get meta about it. We want to make sure we’re very carefully selecting what we’re measuring. And identifying bottlenecks might be a great start but we need to carefully select which bottlenecks we even want to address in the first place. Just because we can see that something slows down somewhere it doesn’t mean that that’s necessarily an area of focus.

    Beal: We could be waiting six weeks for a security check and that’s really hard to get that out of the way, but we could maybe – and Viktoria may be having an example around, I don’t know, test automation or something. Viktoria?

    Praschl: Yeah, I mean, also test automation and _____, you have tons of metrics you can actually measure just from a curious perspective, and if you don’t measure the right things there as well it will seem as if it’s at a standstill. But I think it’s also very important to – I liked the bottlenecks you just mentioned, Frank, because one is the team level, but then you also want to see how does it look from an end-to-end process? How does my overall customer journey look like? And I see quite often companies, actually, they start and they identify the right metrics on the team level, they get the teams there, but then they are failing on the overall picture to bring everything together. A lot of people struggle with that. That’s what I see.

    Ohlhorst: I think the mistake that a lot of the teams make nowadays is they either look at this and they try to relate either DevOps to a waterfall ideology where there’s a beginning and an end and you can measure certain points or they look at DevOps as this rigid structure on how you do things, where the whole idea behind DevOps is it’s flexible and it can be easily modified to meet specific needs. So, I think people run not only into an issue of where “Okay, where do I establish metrics? Why am I doing metrics?” but also how you interpret those metrics. I mean, like we were talking about before, release frequency and things like that are great for what we use as a term is “vanity metrics.” It’s “Hey, we accomplished something.” But when it really comes down to it, what did we accomplish and how did that improve the process? And I think people are losing sight of that.

    Beal: It’s been said already, I think, here but I think that focus on outcomes is really, really key. And I think there’s a couple of other things I wanted to bring up. One is that we talk a lot about being data-driven in DevOps and I’m starting to think actually about being more insights-driven. And the other conversation I’ve had recently is about doing less hypothesis-driven development and more impact-driven development, which I think is another really interesting iteration on our ways of working. And it reminds me of when Alex was talking about this idea of having telemetry everywhere, which is wonderful. And so, the idea then is that you can get any metrics you want. And you don’t want all of them but at least you have the ability to choose them. But as Alex pointed out, there is this downside to this, that we are just overwhelmed with data. And I think that’s something that AI can help us with there as well. I mean, it’s just a fact: There’s far too much data in the world for us to cope with. We need somebody or something probably that we’ve created, a machine to help us with it. So, Alex, I wonder what your thoughts were on AI in the context of measuring our journeys.

    Hidalgo: You’ve asked a very interesting person about this because I’m actually fairly dubious that a lot of these models will actually help. You need a lot of data, a lot of data, to train a model. And most people actually don’t have that much. We may be talking about “Oh, we have too much data” and “We’re swimming in data” and this and that. Very few people have enough data to properly train models. Can this work in some contexts? I think so. And I think a lot of smart people are working on the problem. But I do think there’s a little bit of an overblown focus on it today because I think it’s a lot of trying to fit a square peg in a round hole. We need to – like everything else, as we’ve been talking about, you need to be careful and you need to think about what outcomes you’re really looking for and then decide “Is AI, is machine learning the right thing here?” Because it – just because it’s a buzzword, just because lots of people want to do it doesn’t mean it’s always going to work. You need to make sure that you’re picking the right tool for the right job.

    Ohlhorst: Yeah, and the same can be said with automation when it comes down to it. If you don’t know the possibilities or the probabilities around a process how can you automate it unless you have the data to provide you with that insight?

    Hidalgo: Which, I should say, those words just remind me of what we can do with data is statistics. And actually, when you see me flinch a bit about “Oh, should we use ML?” or “Should we use AI?” I think a lot of the places where people are doing ML they’re actually just using stats. And that’s great because statistics can actually compensate for not having enough data. That’s kind of what it does best in some sense. So, I am a huge fan of using models. I’m a huge fan of using math. Just, again, let’s make sure we’re using the right math. Do we need to build an ML model if a simple regression tells us everything we need to know?

    Ashley: Yeah, I do agree with you about the AI, machine learning of it. It takes a ton of data, if that’s a measurement, in the data world. I want to go to something that you said, Helen. I really like the word “outcome.” What are the outcomes that – have we achieved an outcome when we’re developing software or creating an experience or something out of the process? Because ultimately, that’s what matters. We can improve the things within it. We can automate the processes within how we create software. But it’s all for a purpose. It’s all for – if we’re not doing a better job of delivering on an outcome, maybe those things we’re working on internally are sort of navel-gazing, if you will, looking internally but it isn’t really that valuable. Let’s work on the things that we can connect to an outcome. That’s what I would propose.

    Beal: It’s funny. The other day – it was at DevOps Enterprise Summit and she went up to speak because she used the phrase “time to market,” and I kind of in the Slack chat went “Oh, time to value,” because obviously there’s no point in getting something out the door if it’s useless, whereas with “time to value” at least we’re recognizing that it’s been – giving something useful to something. And then, John Smart corrected me with “time to learning.” And I thought, “Oh, no, actually, it has moved.” We’ve moved from time to market, time to value, and now we’re in time to learning, where we’re recognizing that actually only – something only becomes useful when we’ve seen it have value and we’ve learned from it and decided to do something else.

    But yeah, it’s the same as this kind of impact-driven development as well, this idea that we really focus on having an idea about what we’re trying to do, and then, importantly, measuring that it did what we thought it was going to do. And we’ve been traditionally really bad at doing this in the technology world because we’ve been really project-driven. And when we’re project-driven we have huge amounts of requirements which are (a) really difficult to track, the impacts of, because we deliver them all at once and we weren’t doing things like canary testing which does allow us to look at a much more granular level. And the other problem with being project-driven is we’re always under so much pressure to deliver. Our testing always gets squished because our development overruns and our launch date never moves. So, by the time things go live we’re so exhausted, and then we disband the team and put them into other places anyway, so no one ever goes and has a look and says, “Did that really deliver the four million quid that we – or $4 million that we said it would?”

    I wonder what other people think about how metrics change as we move from project to product.

    Shimel: So, I’ll quickly jump in here on that, and that is – and it’s, Helen, something you mentioned, Alex mentioned. I think what we’re guilty of – and that’s part – in the abstract we talked about the dark side, and it’s not that “Mitchell, I am your father,” but there’s a dark side of these metrics which are that in the absence of facts or in the absence of knowledge we try to fashion metrics to compensate. So, with something like DevOps where there’s a lot of cultural aspects that come into play, there’s a lot of intangibles that come into play, and they’re almost by definition hard then to measure because they’re intangible; they’re not tangible. And so, we compensate by coming up with what some may consider frankly nonsense metrics that make us feel better or make us feel like somehow we are measuring the immeasurable. And I think that is an important part of this whole thing. Measure what you can, but are there things that are just immeasurable? Anyone?

    Beal: Yeah, I – sorry, me again for a second. I don’t believe so. As a coach and a consultant for a long time I was discovering clients that felt that their biggest problem with deploying DevOps or implementing DevOps was the cultural side. So, that seems like something that you can’t measure. And it’s true that you can’t really get data out of Jenkins to tell you what’s happening in your culture but there are other ways to do measurement. And I think it was Viktoria – sorry if it wasn’t Viktoria, but somebody said the important of baselining your current state, and that is absolutely essential. And I think people don’t always do that. They kind of dive in to try and get metrics without really kind of going “Okay, this is where we’re starting from figuring it out.”

    So, from the human aspect – I mean, talking about ADOC, which I mentioned earlier, the Assessment of DevOps Capability, we have 5 different dimensions in that and each dimension has 12 subtopics, so we have 60 topics in total. And I’m starting to sound like we’ve got way too many metrics, but there’s a lot of subtlety in the way that it’s baselined. And the first dimension is human aspects. And within that we’re really getting a feel across an organization, team by team, where they feel their level of capability is around things like psychological safety, around transformational leadership, around how much autonomy and mastery and purpose they have in their daily role.

    So, you’d be surprised, I think, about how possible it is to measure cultural capability without necessarily having a knowledge of how many – or relating it to how many artifacts you’ve got in your artifact repository. There are other ways of doing this. And sorry, I interrupted you, Alex.

    Hidalgo: No. I think those are all great points, but we do have to, as with everything else, approach it with a little bit of caution because especially if these are self-reported, if these are numbers that you’re looking at like “Are you happy on your team?” “Do you think your organization is headed in the right direction?” – those normal kind of questions and then asking people yes or no, or do you put it on a sliding bar from one to five? And studies show most people are going to just take a one or five anyway. And that’s not saying this is bad. It’s just something else that’s another caveat. It’s another “Let’s make sure we’re looking at this correctly.” “Let’s understand that some percentage of our employees are just going to click through it because they don’t want to fill out this form.” If it is this self-reporting thing, you know?

    Beal: It’s such an important point you make, Alex. And it’s something that we deal with when we engage with organizations. There’s such a lot to talk about, because what you’ve actually identified there isn’t a problem with the tool; it’s a problem with the culture. And if people are not feeling that they are part of the change that the organization is trying to make and they’re not empowered to have their say and their voice and be involved in it then they will skew their answers.

    So, we absolutely have to help people understand how important their answers are, what impact they’re going to have on their future and their ability to grow themselves in their organization and make them feel part of the change. But yeah, humans can be a tricky business. But back to your point about data volumes, again, in this kind of assessment environment it is quite important to have enough data to weed out variations from people that maybe don’t care or are skewing for other reasons.

    Hidalgo: Which, again, you can do some basis statistics to ensure that you are dropping your outliers. You – to be able to get very useful data out of this stuff, again, you’ve just got to make sure you’re looking at it in the right way.

    Shimel: Viktoria?

    Praschl: Yeah, I think quite often we just force metrics on teams, so that’s why I like it a lot, what you said, Helen, that you need to also understand the culture. So, where is the team from a metrics perspective? Do they understand why we are measuring? Or are you already in a stage where they say, “Okay, I understand why we are measuring certain things,” but now we need to constantly figure out which metrics we are measuring?

    So, I think it goes back to the team and explaining the “why” and then really helping them or work with them together, once you have the outcome, what do we do with that? How can we improve? What do we do with the outcome of the metric? What do we do with the numbers? So, I like it a lot, what you just mentioned on assessing the culture.

    Beal: Yeah, and that’s a great point. We baseline but we baseline for a reason, because we – I talk about the improvement culture a lot, so that four-step process where we start by establishing the long-term vision direction, then we establish current state, then we establish our next target state, and then we PDCA or experiment between those two states. So, kind of the finishing part of that first cycle is defining the hypotheses and executing them, and then we start again. And we’re not baselining now; we’re comparing it against our baseline at a time period of three, six months and what’s happened with our experiments in between.

    Praschl: Yeah, because I think most companies, they just don’t know. They don’t know where they stand. They don’t know where the team stands. They don’t know where the culture stands. So, that’s the starting point to get everything rolling.

    Beal: And it’s a big investment, Viktoria, for people to go down this path not to know how far down the path they’ve got.

    Praschl: I think for that you need the executive buy-in as well. So, it’s like making sure that you have from the top also the support that you do that. And then, as you go into this constant learning process, I think it becomes very important there.

    Hidalgo: And trying to look at how far down the path you’ve gone, that – it’s going to, again, be different for everyone. Is it more important how far or how far you have to go? And is there even an end to the path? Or is this a process that’s ongoing forever? And just another example of having to be thoughtful about what’s being measured.

    Beal: I don’t believe there’s an end to the path, which is why I use words like “capability” over “maturity,” because “maturity” indicates that there is some kind of a horizon that you can reach. But of course, no matter how many more capabilities you’re building yourself we live in a market that’s forever inventing new ways of doing things and new tools to support the things that we’re doing. So, it’s an ever-moving target that we’re trying to respond to.

    Ashley: I think there’s a whole nother side of metrics I don’t know if we’ve touched on yet, and that is the metric itself can be valuable and inform us about some things, but I also think the analysis of what’s – why? What are the potential causes? In a quality process you do a Pareto diagram to kind of analyze what you think are potential contributing factors and what maybe is influencing why it’s happening in a certain way to try to get to – if you’re – for example, if you’re doing a process improvement what parts of this – a lot of things go into whatever created that metric; how do we know what we might work on first or doing some experimentation with?

    But the ultimate thing is there’s a lot of learning that comes out of that process. It really kind of helps you understand “Wow, I had no idea that’s actually how it was working.” And now that we know that with a little more fidelity we can make some adjustments.

    Beal: That’s powerful. I wanted to respond to Alex, actually, and then I forgot – it went out of my mind. But this idea that the team needs the right metrics – and Viktoria and I have both said those metrics should not be inflicted on the team, but the other thing is most organizations are made up of multiple teams, and different teams, like Alex said, have different capability patterns. But it’s very interesting to try and understand, for example, why one team is really good at something like diversity and inclusion or really good at AI ops or something, and not saying that the other teams are bad but trying to learn from those success stories. And I think it’s probably the Phoenix Project that put it, it was making local discoveries and global improvements.

    And I think that kind of mindset of looking for the strengths and spreading the strengths across a business is really important when we’re doing things like measuring people on their journey because the – we talked about culturally that people are kind of either scared of this stuff because they’re expecting to get beaten up about it or they’re cynical and they’re not giving true answers. But there’s another side of this, that people are also quite afraid of being assessed or even assessing themselves because somebody’s going to go “Well, you’re shocking at deployment frequency. What are you going to do about it?”

    And it’s like we have to change that whole mindset in an organization that they are a dynamic learning organization. It’s all about continuous learning and not about beating people up over the head or removing their annual bonuses or the like, which are things that I’ve seen in various places.

    Ohlhorst: Which gets us back to that key point of the “Why are we measuring?” Making sure people on the team know why we are measuring things, not only from a cultural perspective, but also from a value perspective so that they know that by them giving their answers based upon queries that there is value to that, and that is the “why” behind it. And ultimately, the goal is to improve processes or accelerate SDLC or whatever it is, but there is a goal there that is not just random data being thrown out asking “What flavor of gum do you like?”

    Praschl: Yeah, I think it’s also –

    [Crosstalk]

    Praschl: It’s important to get them to understand the “why.” It’s usually a long and not as easy of a process. But once they have this and understand it you have the buy-in and the outcome will be way more worth it if you do that way.

    Hidalgo: A thing that I’ve found that can help with this kind of stuff is people underestimate how powerful interviews can be. Instead of just asking people to self-report or just collecting random numbers out of your computer system sit down with people and talk to them. Not for five minutes. Schedule an hour. Sit down, find out what is this person thinking? Make sure you’re talking to the right people, not just in terms of an organizational structure, because you do want to make sure you’re talking to people at all levels of the company and all roles. But also make sure that the people you’re interviewing are comfortable with it in the first place. Not everyone has the personality to want to sit down for an hour.

    So, another example: Select carefully. Measure carefully. But I’ve found so much value in just – instead of trying to do this in some – a method that is based around metrics. We’re talking about metrics. Sometimes you don’t need metrics. Sometimes you just need the human interaction and you can walk away with that if you really want to then throw that in that kind of scale and attach a number to it maybe. But you can learn a lot just by talking to people.

    Beal: I think the best assessments are always a combination of quantitative and qualitative data. And I think we’re seeing this increasingly in the data world as well. About 80 percent plus of most businesses’ data is unstructured, which by its very nature is that kind of textural response data, whether it’s on social media or in your logs in Splunk. We’re seeing more and more people understanding that it’s not just about what’s in an RTMS. So, I absolutely agree with you, Alex. Yeah.

    I think there’s a big advantage, though, which I’m going to point out, around ADOC. So, some organizations are very large, so when you’re spending an hour with people and there’s 8000 people it’s quite impossible to speak with 8000 people. So, actually having an ability to empower everybody to be involved in the change by giving them a platform on which to share their opinions is quite useful. And of course, you can put open text fields in there as well and get those snippets and insights that you would miss if you were just getting a one to five or yes or nos.

    I did want to maybe slightly disagree with one thing you said, though, which is about the people that don’t want to talk. It always kind of worries me – and this is the big thing about, I think, diversity and inclusion and things like Heloxi that they are trying to give equal voices to people, is I don’t want us to fall into that trap where we think “Oh, that developer is really quiet and introverted; we won’t ask them what they think because they don’t really like talking.” It’s like they’ve probably got just as much right to their opinion as everyone else and we shouldn’t avoid hearing it because we just think maybe they don’t like chatting as much as other people.

    Hidalgo: I totally agree. But from my point of view you’ve just got to make sure that whoever is comfortable with the process – people don’t want to feel singled out. Just like everything else, depending on the person, depending on the culture, depending on the team, they might feel like “Why am I being picked? Is this a bad thing?” So, it’s just looking thoughtful. That’s all I meant. Definitely don’t want to exclude anyone. Definitely want to make sure we’re getting every possible voice. Just want to make sure people feel safe about it.

    Beal: Totally. And that psychological safety is so important. I learned this from one of my clients years ago. We didn’t use to do things like participant briefings, and now I think it’s really important to get everybody that’s involved in this type of work and talk to them about what DevOps is and the “why” that we’ve all talked about – so, organization performance and succeeding in a disruptive market and all that kind of stuff – and then give them the comfort about anything that they share is between them and the people that are collecting that information. And they may be quoted but they’ll never be associated with what they said. Their words may be used as an example but they can be completely honest. And actually, they are being asked to be involved because their opinion is so highly valued in the organization and we want to gather their insight, so they shouldn’t feel fearful or that their job is at risk. They should feel honored and hopefully excited to be involved in a process that’s intended to make their future more fun and secure.

    Hidalgo: The only other thing I’d add there is – and again, I totally agree; I think we’re actually –

    Beal: Finally agreeing.

    Hidalgo: – in agreement here. Yeah. Yeah, exactly. But the one other thing I would add is that even if we have a strong suspicion or even have the numbers to prove that our organizations or our teams generally are psychologically safe and we’re building a good culture here and this and that, you don’t know what it was like for people at previous companies. People can carry baggage for a long time. It can take people a long time to adjust, especially as your career goes longer and longer. You have these memories and not all of them are great. And so, even if you think “Ah, our company as a whole, we are scouring very high,” for individuals it may not have anything to do with the current organization at all; they could still be carrying some scars from previous ones.

    Beal: Yeah, and there’s –

    [Crosstalk]

    Shimel: Viktoria?

    Praschl: It’s about creating the safe space. So, some probably will take longer to open up, but usually if you see that others are joining and the more comfortable you feel, you also get those people to open up down the road.

    Shimel: I think we’re all humans, to borrow a phrase, and we bring our own experiences, outlooks, prejudices to whatever metrics we’re going to measure and to whatever we’re going to be in. And I think we can’t lose sight of that either.

    Beal: Right. Those scars that Alex was talking about, I just wanted to talk about one other element of this, which is that the scars are negatives. We’re never badly affected by positive experiences, if that makes sense. So, from a neuroscience perspective we basically train our minds to be fearful. We keep on avoiding – we have an avoidance response that’s trained into us. So, I think I really like to try to use neuroscience when I’m helping people through a DevOps change because there are things we can learn from it, things like neuroplasticity and these different avoidance and approach responses that we have in different scenarios. And actually looking at an organization as a whole is great, looking at different teams and how they compare, but actually understanding, as Alan has just said, that how individual humans operate and in the context of their previous experiences and just how we’re built, because we’re all built differently from _____ anyway, is really important. And that’s really where the transformational leadership comes in and having people that understand how to be coaches and how to understand people at a personal level.

    Ohlhorst: Interesting that we’re talking about the process from almost applying a “flight or fight” type of ideology to it, that here we are talking about software development and DevOps in particular and pipelines and all that, and so many people so often forget that there are people involved in the process. And that is where you come up against the most challenges.

    Shimel: Yeah. It’s about the humans. Guys, we are – we’re about out of time, though we could probably sit here and talk for the rest of the day. But it wouldn’t – I don’t know if anyone would want to watch, and we all have other things to do. What a great conversation on metrics and DevOps and people and everything else today. Maybe we’ll come back and we’ll run a part two of this or something. But for now I need to pull the plug.

    I want to thank our friends at Tricentis for making DevOps Unbound possible with their sponsorship. Alex, Helen, Viktoria, Frank, great conversation, man. Great conversation, men and women. Good stuff. Mitchell, you want to take us home?

    Ashley: What I’m struck by is the richness of just the word “metrics” and what all it can mean and the depths of it and aspects, whether it’s the human side of it, whether it’s the “why,” whether it’s the outcome. There’s several – I think there’s several good takeaways there from this, and so I hope it’s helped everyone kind of think about maybe why you’re doing what you’re doing and how you want to lead that going forward.

    Shimel: Excellent. All right. This is Alan Shimel for MediaOps, devopsy.kinsta.cloud, here on DevOps Unbound on TechStrong TV in the TechStrong TV network. We’ll see you in about two weeks with another great DevOps Unbound episode, but for now this is it. Thank you, everyone. Thank you for watching. Take care..

    [End of Audio]

  • Turbocharge Enterprise Apps With Contextual Analytics

    Turbocharge Enterprise Apps With Contextual Analytics

    Software product managers and developers typically treat analytics as a standalone capability—something to be integrated into their application’s dashboard or reporting module. As a product feature, analytics is undoubtedly a valuable tool. But offering it merely as a tacked-on function is an approach that lags behind where your users are today.

    When data analytics is limited to dashboards, users must switch away from their transactional environment whenever they need to interrogate data or derive insight. This disrupts workflows and interrupts trains of thought, creating friction for the user. Moreover, a standalone analytics capability doesn’t provide context or guided analysis. Users must look for anomalies or trends manually. As a result they’re less likely to dive into analytics to support good business decision making.

    Contextual analytics, on the other hand, gives users a powerful tool right at the point of their daily work. Contextual analytics is defined as any analytics solution that is integrated directly into an application’s core workflows. This approach delivers the benefits of analytics in the situational framework where decisions must be made.

    Embedding analytics in this fashion creates significant value for the user. Charts, tables and metrics sit side-by-side on the screen, alongside the application’s central functions. With one click, the user gains instant, guided and dynamic insight.

    Such an improvement is helpful for all kinds of business activity. Retail store managers can instantly access demand forecasts while creating weekly work schedules. Inventory managers can view trends and analyze stock without leaving their ordering screen. Supply chain, finance, logistics, sales and marketing, manufacturing—any process involving routine data processing can profit from contextual analytics.

    A Rich Workflow Asset

    When embedded into transactional workflows, contextual analytics can deliver two forms of understanding. The first comes from predefined visualizations, ranging from simple KPI numbers to line and bar charts and even contextual dashboards. These visualizations are presented based on user action; a customer’s purchase history, for example, can pop up in chart format while viewing the account record, enabling the user to make decisions about sales incentives or priorities for service.

    Second are dynamic analyses and alerts. These indicate that either thresholds have been crossed or anomalies in a record have been discovered, prompting the user to explore and take further action. Pop-up alerts can be invaluable in sales, production, finance or many other disciplines.

    For both predefined and dynamic contextual analytics, outcomes can be based on simple aggregations of transactional data or as the result of sophisticated data science modeling (e.g., propensity to purchase). Specific outcomes can be set by either the product manager or the user to maximize utility.

    Contextual analysis is ideal for supporting or triggering actions according to any business need. The capability enhances transactional workflows by providing metrics pertaining to a particular transaction; it will also trigger a new workflow via an alert or suggestion for action, based on the output of a data science model.

    contextual analytics

    Of course, none of this means that dashboard-based analytics aren’t still important. Users will always need to conduct broad data analysis. Dashboards and/or report analytics allow users to monitor overall business performance, drilling down when necessary into the details behind the numbers.

    With the secondary addition of contextual analytics, however, users can be continually guided in their decision making as they work. They receive a constant flow of deeper insight, supporting management tasks intuitively at a granular level.

    Deployment Framework for Developers

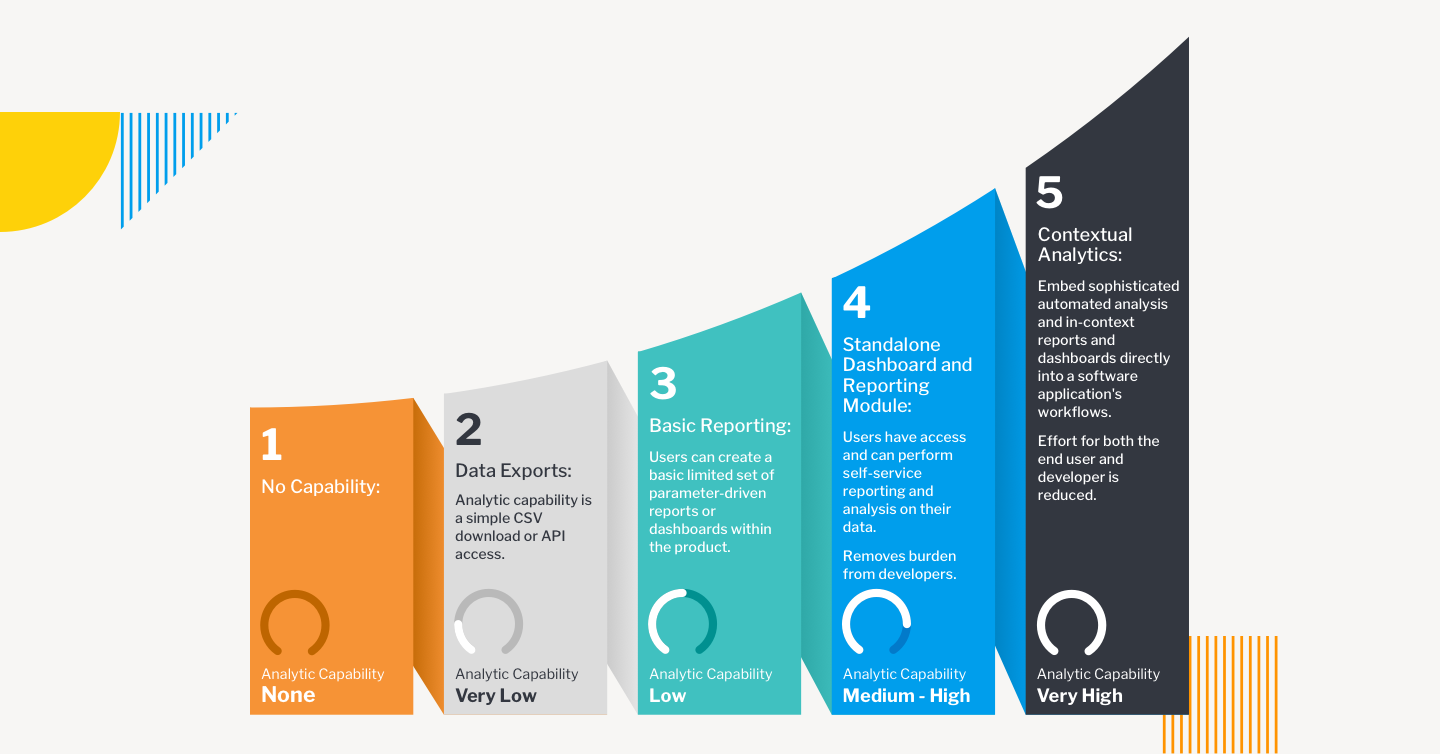
    Embedding transactional analytics into enterprise applications can be directed according to a maturity model. There are five possible stages of product development:

    • Stage One: No Capability. The main engineering focus is on bringing a new application to market. Minimal Viable Product (MVP) attributes lead development, and reporting capabilities are rarely included.
    • Stage Two: Data Exports. Analytics are provided based on customer feedback, but only through a CSV download or API access that allows the end user to analyze data in their preferred tool. The burden of building analyses rests with the customer.
    • Stage Three: Basic Reporting. A limited set of reports are supported by analytics, and in-house developers are tasked with creating the capability, often to the detriment of new features for the core product.
    • Stage Four: Standalone Dashboard and Reporting Module. This is often the end journey for most enterprise applications. Self-service reporting and analysis are available via out-of-the-box dashboards and reports.
    • Stage Five: Contextual Analytics. Sophisticated, automated analysis is available as part of the application’s core workflows, as well as at the dashboard. Users are guided to optimal decision-making at both the transactional and reporting level.

    These stages are not mutually exclusive. Especially for stages four and five they can be additive, so that end users will have a variety of mechanisms to access the data they need, at the time they need it.

    contextual analytics

    Accelerating Implementation

    Elevating the end user analytics experience is easier to achieve than it once was, thanks to BI vendors that specialize in embedded and contextual analytics built on an open platform. The best vendors are able to adapt quickly and easily to product development roadmaps, aligning features to meet specific needs and following up with administrative tools and automation processed to support the lowest possible cost of ownership.

    Working with an analytics vendor means development teams will have maximum support from prototype and design to integration, deployment and subsequent iteration. Options for Windows and Linux, on-premises or cloud will ensure the versatility, security and scalability required for highly marketable offerings.

    How Customers View Analytics

    As a product feature, analytics can often be dismissed as an afterthought—but your users don’t see it that way. BI analytics is increasingly seen as critical to business governance. Users want to glean as much insight as possible from the data they’re collecting—and on multiple levels. This means your users want to get more from your product, even in ways they haven’t yet imagined. Contextual analytics can provide that enhanced appeal for your application, putting your product out in front at a time when enterprise applications are more essential—and more competitive—than ever before.

  • Open Source Vs. Proprietary DataOps

    Open Source Vs. Proprietary DataOps

    Core DataOps concepts are making their way into data engineering teams and, from there, into the broader enterprise. Data engineers are retooling how they create data products, and much of this work revolves around creating data pipelines.

    DataOps pipelines offer the kind of observability that traditional data integration and ETL processes don’t or can’t. They allow you to continuously integrate and test new data sources and deliver data in streaming or batch contexts with higher levels of quality and reliability than traditional, siloed approaches. They can also support machine learning efforts by preparing data for training, testing and deployment.

    DataOps pipelines shorten the cycle time between a data consumer’s request and how quickly and reliably the data producer can fulfill it, all while observing service quality throughout its life cycle. The challenge teams face when building pipelines is how to construct them. The two approaches, as I see it, are do-it-yourself using open source, or through commercial product acquisition.

    Open source certainly has its vocal adherents and some visible successes, but there are trade-offs to taking the open source route.

    Building Or Buying Your Pipeline

    One advantage of open source is in its flexibility and availability. Open source licenses, excluding the SSPL, gives users incredible freedom over what they can do with the software. If you have the skill, you can compose a DataOps pipeline that can take any data, enrich it and route it to the right place. That flexibility, though, is also a downside. While you can do anything you want, you also have to do it. Open source projects like Kafka, Pulsar, Spark, Airflow and Flink don’t know anything about the data they’re handling. That’s up to the developer.

    This may not sound like a problem, but today’s data engineers are handling dozens of data types in hundreds – or even thousands – of different formats. If you add in operational data, you’re also looking at data flooding in from firewalls, containers, SNMP traps and HTTP sources. And that’s just what’s coming at you. You also need to fetch data from object stores, multiple activity hubs and other messaging sources. No open source project natively supports the variety and volumes of data required in a modern DataOps pipeline. Every new data source you add means starting from primordial components rather than higher-level abstractions, adding time and undifferentiated effort to your work.

    You’ll also need essential features like per-source backpressure, support for a range of protocols and data stores, role and permission management and so on. That’s a lot for overworked data engineering teams to build and maintain over the life of a pipeline.

    There’s no ‘easy button’ for proprietary products, either. Many commercial products only support a handful of sources and destinations and may have excessive licensing costs related to data ingest rates or per-connector licensing fees. Also, they can be challenging to scale, from an operations perspective. Seeing a cool drag-and-drop interface may look great during the demo, but it quickly becomes a cluttered mess when you’re looking at thousands of similar data processing pipelines.

    The advantages to commercial products center around the features enterprises need, like governance, management and security. They may also integrate with other components more readily than open source. Finally, having someone to call when you need support is also essential when running in production, although open source core companies also offer support.

    Take a Higher-Level View

    As you’re evaluating DataOps pipeline options, keep two things in mind. First, regardless of which path you choose, ensure your chosen technology offers observability and monitoring features. DataOps is about reacting to change faster, and you can’t react if you don’t know what’s going on. Building observable DataOps pipelines ensures you are delivering a valuable data product to the range of data consumers in your enterprise.

    Next, get past the technology. DataOps is more a people discipline than a technology practice. A key component of a successful DataOps implementation is aligning metrics and incentives across teams. If the staff running the DataOps pipeline are disconnected from the business outcomes their data products inform and influence, they’re not incentivized to run the pipeline as a mission-critical infrastructure component. It’s key to align all of your teams with shared metrics and incentives.

    DataOps Determination

    Before you decide on your DataOps pipeline implementation, there are some things you should do.

    • Determine who your customers are and what their expectations are around data delivery, enrichment, user experience and observability requirements. Are you only serving data scientists, or are you also serving infrastructure and operations, business intelligence and marketing? Knowing your customer allows you to make better decisions.
    • Test the software in a real-world environment. Everyone dislikes being told to perform a proof of concept before you buy/build, because POCs are time consuming. Remember – they’re less time-consuming than picking the wrong tool and looking foolish later.

    Engineering teams sometimes choose technologies that are in fashion rather than selecting the right tool for the job. Taking a pragmatic view of performance, manageability and engineering effort, as well as involving a wide array of stakeholders, will give you a higher chance of success with DataOps.

  • VMware Enhances Management Portfolio

    VMware Enhances Management Portfolio

    VMware today rolled out a series of updates to its automation and monitoring portfolio as part of an ongoing effort to simplify management of highly distributed IT environments.

    Updates to the VMware vRealize Cloud automation portfolio include VMware vRealize Automation 8.4’s tighter integration with the open source Salt automation framework the company gained by acquiring SaltStack last year, in addition to a range of tools for provisioning and governing instances of VMware software running on Google Cloud, Microsoft Azure and VMware Cloud on Amazon Web Services (AWS).

    There is also a set of tools to enable organizations running NSX network virtualization software for vSphere to migrate to NSX-T, an instance of network virtualization software that can be deployed anywhere.

    VMware vRealize Operations, meanwhile, is being updated to support a total of 57 AWS services along with the ability to predict the cost of deploying VMware Cloud on AWS. The latter capability includes tracking potential savings generated by powering off idle or unused virtual machines as well as snapshots, orphaned disks and oversized virtual machines. There are also now ten additional dashboards for tracking various costs, including return on investment, total cost of ownership and potential cost savings. IT teams can also more easily track capacity utilization trends on AWS.

    VMware is adding support for the open source Telegraf Agent to enable IT teams to collect metrics from any platform, in addition to providing an update to VMware vRealize Log Insight 8.4 and vRealize Log Insight Cloud that enables these monitoring tools to store data collected from multiple cloud services more efficiently. IT teams will also be able to collect logs from both Microsoft Azure and AWS.

    Finally, VMware is expanding its network monitoring tools to provide greater visibility across multiple clouds.

    Fidelma Russo, senior vice president and general manager for cloud services at VMware, said the rate at which IT teams are consuming the software-as-a-service (SaaS) editions of VMware management and observability tools or full-blown managed services has increased sharply since the start of the COVID-19 pandemic, as IT teams managed on-premises and cloud instances of VMware software from home.

    It’s not clear what percentage of VMware’s installed base are now consuming the company’s automation and monitoring tools, but as the number of VMware instances deployed on public clouds increases alongside on-premises IT environments, so, too, do the management challenges. The choice IT teams generally have to make is deciding between automation and observability tools that are optimized for a specific platform versus adopting frameworks that work more broadly. With the acquisition of Salt and support for Telgraf, it is apparent VMware is moving to expand the reach of its management portfolio beyond its own software.

    In the meantime, IT teams are not only being asked to manage more complex IT environments, but the expectation that, through automation, they will be able to more effectively implement cost controls. This is happening at a time when many organizations have not been quite so sensitive to the total cost of IT. The challenge, of course, is those organizations are being asked to spend money on automation today in the hopes of spending less because of it tomorrow.

  • IBM Deepens DevOps Insights on Mainframes

    IBM Deepens DevOps Insights on Mainframes

    IBM today extended its effort to enable IT organizations that have mainframes to embrace DevOps best practices by updating the analytics tools it provides.

    Tom McPherson, vice president for IBM Z Software, said a version 6.0 update to the suite of IBM application discovery and delivery intelligence (ADDI) for IBM Z tools surfaces more granular insights by leveraging a new version of Wazi Analyze that now analyzes code immediately after a change is made. That capability is critical, because most of the workloads running on a mainframe are highly tuned. Any issue that is likely to occur can usually be traced directly back to the latest software update made to the environment, McPherson said.


    Wazi Analyze also can now be deployed as a set of containers, which McPherson said means IT teams can opt to run the analytics application on a platform other than the mainframe.

    ADDI also has been updated to improve Assembler support by making it easier to analyze multi-level dynamic assembler macro calls. A set of application programming interfaces (APIs) for feeding that data back to a continuous integration/continuous delivery (CI/CD) pipeline has also been added.

    Finally, IBM revealed it signed a licensing agreement with ITP Software Systeme GmbH, Munich (ITP) to enhance application analytics capabilities. That capability will be added to a future release of DevOps for IBM Z Hybrid Cloud, which includes ADDI and IBM Wazi Developer, to enable organizations to determine how best to modernize legacy monolithic applications as they transition to a microservices-based, cloud-native computing environment.

    Naturally, not every monolithic application is going to be converted into a series of microservices. However, McPherson said, it’s clear there is a need for analytics tools that will enable IT teams to more easily determine which elements of an application are better suited to being reconfigured as microservices that could be deployed on, for example, a Red Hat OpenShift cluster.

    For the last several years, IBM has been encouraging IT organizations that have mainframes to embrace DevOps best practices as part of a larger effort to position mainframes as another type of distributed computing platform. The overall goal is to lower the total cost of mainframe ownership by reducing the need to rely on specialists to manage mainframe application environments. Each year, more of those specialists retire. IBM wants to make it more feasible for organizations to replace those specialists with IT generalists, like those that typically manage distributed computing environments. At the same time, management of distributed computing environments is becoming more automated, thanks to the rise of DevOps.

    Of course, mainframe processes have been highly automated for decades. IT teams managing mainframes may still rely primarily on waterfall-based processes to deploy applications, but the underling infrastructure is designed to scale up and down on demand as application workloads require. Convincing IT teams that, for decades, have employed the same processes to manage mainframes often requires a significant amount of cultural change.

    Regardless of motivation, however, the winds of DevOps change are now blowing through mainframe environments just as fiercely as they have through the rest of IT.

  • The Digital Transformation of Decision-Making

    The Digital Transformation of Decision-Making

    The ability to make effective business decisions has historically relied on factors such as experience, qualifications, talent and, in many cases, luck. Strategic and tactical choices are also informed by ‘borrowing’ the insight and knowledge of others. In many situations, ‘follow the leader’ can be an effective approach, and one need only study any sector of industry or commerce to see organizations everywhere mimicking each other, with competitive advantage based on relatively small acts of incremental innovation.

    Today’s ambitious businesses have many more options at their disposal to inform decision-making than previous generations. The extent, for instance, to which businesses can now collect, store and analyze data has been transformed by improvements in technology. The result is many businesses are now sitting on enough data for advanced analytics to inform smarter, more efficient decisions.

    The Role of Advanced Analytics

    Stepping back for a moment, advanced analytics is a set of tools and techniques that use existing data to develop insights to inform business decision-making – in particular, improving the accuracy of predicting future events based on certain actions. In practical terms, it is particularly useful when organizations are planning to implement a new business activity, where it is employed ahead of legacy processes that simply can’t deliver the same levels of insight.

    Online shopping is a prime example. When a consumer clicks on various items on a website, they will often be given other suggestions – sites often will present this information with the words ‘Frequently bought together,’ for example. This is based on what has already been viewed and uses advanced analytics to predict what else the shopper might be interested in. It’s just one of many ways retailers now rely on advanced analytics to intelligently cross-sell, and as many people will know, it’s very effective.

    In a wider sense, advanced analytics can be used in a huge variety of scenarios, irrespective of industry, market or type of customer. In doing so, businesses stand to reap a number of potential benefits, including:

    • Smarter decision making. By generating data based on strong logic and reliable information, advanced analytics can draw on both past and present data to make more reliable, more confident choices about what to do in the future.
    • Focused knowledge. By understanding the factors that improve business outcomes alongside those that are negligible, leaders can focus their attention and investment on what is more likely to deliver the desired impact.
    • Risk management. In an era of heightened risk, and the need for greater risk management, advanced analytics can identify risk based on available data, helping to inform business models that minimize risk, or help businesses make decisions based on insight rather than hope. This can also help improve governance and mitigate regulatory and compliance risk.
    • Strategy automation. Because advanced analytics takes care of analyzing data, teams have greater flexibility and time to focus on wider strategic considerations, which can help make the business better.

    Advanced Analytics in Action

    Advanced analytics employs various techniques across an ever-increasing range of use cases. For example, data mining is applied to ensure organizations make use of the most relevant data, extracting what is useful from the raw data. This data can then be subjected to further analysis for a multitude of objectives, such as understanding customers better or building more effective strategies.

    In addition, ‘big data’ analytics can be applied to both structured and unstructured data, and can be particularly helpful when the data generated isn’t in a proper format, or for organizations with massive data volumes to process.

    Then there’s predictive analysis, where machine learning algorithms are applied to current and past data to identify relationships and patterns. The algorithms then build a prediction model that can inform decision making. In general, the more data that is available, the more accurate predictions will be. It can’t, however, deliver 100% accuracy, and random, unpredictable factors such as a mass healthcare crisis illustrate the obvious limitations on predictive analysis.

    Taking this a step further, prescriptive analysis helps determine the best way to implement a business decision. Even when a decision is close to being made, there can be more than one possible implementation path to follow. Prescriptive analysis uses current and past data to suggest possible outcomes before actions are set in stone, recommending the best implementation options.

    Advanced analytics is a rapidly growing niche of the technology industry, regularly described by industry experts and commentators as among the most important, transformational IT trends. Given the pivotal role of decision-making across every organization, this perhaps shouldn’t come as a surprise, and for businesses everywhere, it’s now only a question of when they apply it to improve their fortunes, not if.

  • ZeroNorth Adds Analytics App to Advance DevSecOps

    ZeroNorth Adds Analytics App to Advance DevSecOps

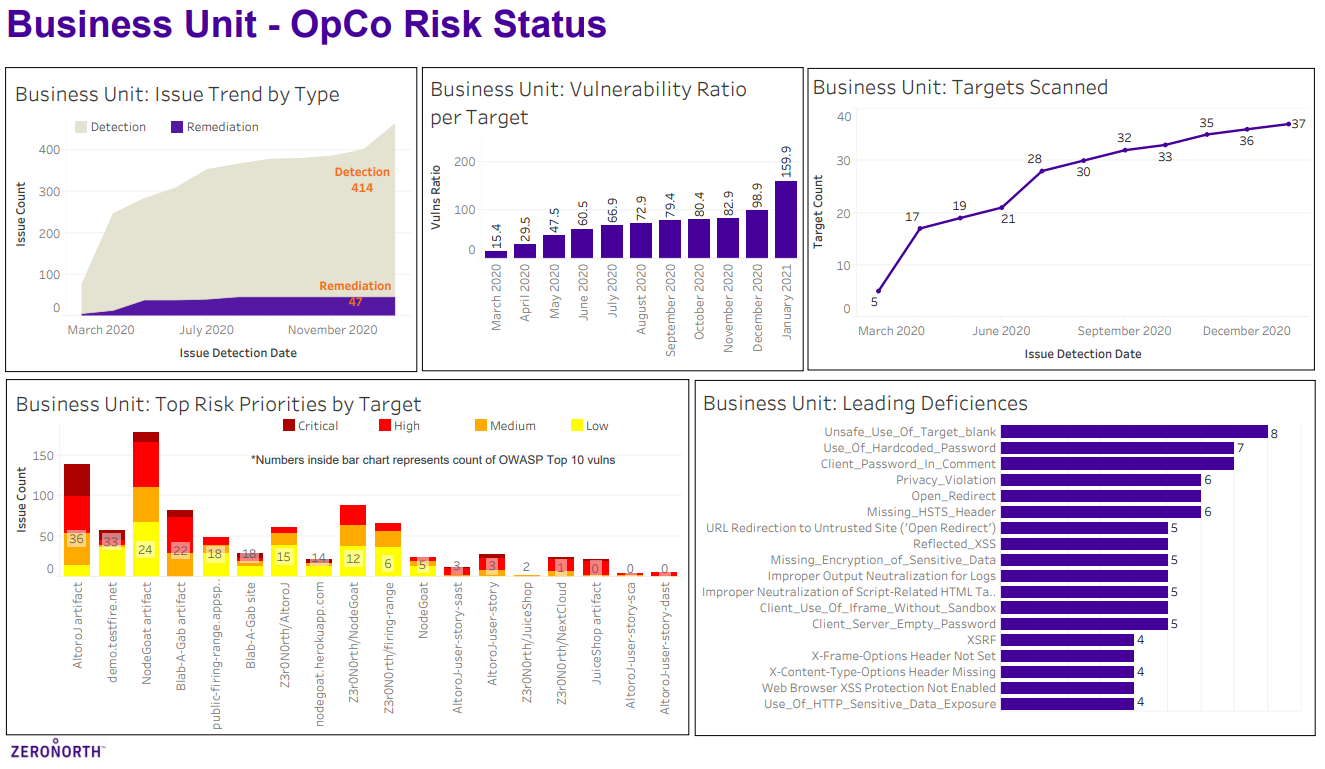
    ZeroNorth today added an Advanced AppSec Risk Analytics module to its platform for orchestrating DevSecOps processes.

    John Worrall, ZeroNorth CEO, said the analytics tool pulls vulnerability data generated by a variety of security tools to provide both DevOps and cybersecurity professionals with a single source of truth for assessing security within an application environment.

    The ZeroNorth platform is designed to enable IT organizations to orchestrate multiple vulnerability scanning tools within the context of a larger DevSecOps workflow, and can apply analytics to a large pool of security data. That data can be viewed in the context of specific groups, such as a business unit or specific application development and deployment team, or within the context of whichever application generates the most revenue for the business, Worral said.

    Additionally, the Advanced AppSec Risk Analytics module will surface types of vulnerabilities detected and the vulnerabilities most encountered, ranked by criticality, along with other trends in types and number of vulnerabilities detected/remediated, such as the number and criticality of vulnerability findings per specific scanner. It also tracks the applications and entities scanned, number of vulnerabilities detected per application/entity and the applications/entities that have the highest risk.

    ZeroNorth

    Armed with that analytics data, Worral said it becomes easier for IT teams to prioritize and focus their efforts, in addition to identifying areas of the business that may need additional cybersecurity resources and training. IT leaders can also get a snapshot view of the top application security risks to better assess the organization’s overall security posture, Worral noted.

    The Advanced AppSec Risk Analytics module will also surface vulnerability remediation bottlenecks spanning multiple applications within the context of a software development life cycle (SDLC), Worral added. Longer term, Worral said the data collected by the ZeroNorth analytics application will also create an opportunity for the company to apply machine learning algorithms to DevSecOps.

    In general, Worral said the only viable path toward achieving DevSecOps is to foster more collaboration between developers and cybersecurity teams. Getting those teams on the same page in terms of the security data that needs to be analyzed is a crucial first step, Worral said.

    It’s still early on in the adoption of DevSecOps best practices within organizations, however, it’s apparent a lack of cohesion between software developers and cybersecurity teams about which vulnerabilities to prioritize is a major source of dysfunction. Cybersecurity teams tend to create long lists of vulnerabilities discovered within applications without providing much context. Developers are then left to weigh, on their own, when to address a vulnerability versus focusing on writing additional code needed to make an application delivery deadline. Developers take potential vulnerabilities seriously, but there are only so many hours in a day to write code.

    Unfairly or not, developers are being held more accountable for application security. The challenge – and the opportunity – is to find a way to make the entire DevSecOps workflow a whole lot less contentious by helping DevOps and DevSecOps teams more aware of which tasks should be prioritized when.

  • An Analytics Workload is a Critical Data Management Tool

    An Analytics Workload is a Critical Data Management Tool

    From an organizational perspective, an analytics workload is a way to gain a data-driven business advantage. Analytics workloads can serve a primary objective that translates to an actionable business impact (such as analyzing A/B testing results, understanding user retention or finding anomalies in a flow, for instance) or can serve in a supporting role for analysis (such as improving dataset quality, preparing a dataset for user consumption or adhering to a data-related regulation).

    Ideally, a workload should have a measurable ROI and should be monitored on key performance metrics such as business impact, time to deliver, cost of execution and total spend versus allocated budget. Managing workloads this way is extremely challenging for data teams. In reality, the impact of big data analytics projects – and the effort and resources spent on them – tends to be unpredictable.

    You can place workloads on a spectrum: on one end, you have workloads that are very close to their business consumers. On the other end, you have workloads that serve auxiliary and support purposes. The latter are the hardest to track, budget and measure their return on investment (ROI).

    Query vs. Workload

    When data platform teams are tasked with evaluating and implementing the infrastructure needed for an analytics workload, they tend to look at it from a technical requirements perspective. An analytics workload is a set of queries that read and write datasets; it consumes compute, storage and memory resources and has an expected level of availability, robustness and performance.

    One traditional approach for improving cost and user experience in a workload is to focus on specific queries – identifying the slow, heavy and expensive ones and optimizing them one by one. While many single queries can be made better (faster, cheaper) by rewriting and optimizing, this approach often misses the big picture, leaving money on the table.

    Knowing Which Queries to Focus On

    Stripped of workload context, queries can only be evaluated on cost or response time. But business-critical queries may not be the most expensive, nor the slowest ones. Having the full view of the workload allows for prioritizing efforts much more effectively.

    Behavior Fluctuations

    The most important query on Mondays is probably very different from the most important query on Fridays, so the effectiveness of optimizing one or both queries may be small. The workload perspective enables you to identify patterns and leverage insights for effective optimization.

    Cloud Elasticity

    Unlike legacy data platforms, the cloud enables a brute-force approach to solving performance problems by adding elastic resources on demand. While this approach can work to improve a specific query, cost quickly gets out of control when applied to all queries. Understanding the workload is key to distinguishing when a brute force solution is right, and when you need to spend the time to build a different data flow.

    Cloud Decoupling

    In legacy IT environments, where queries were competing for a limited pool of resources, optimizing a single query had significant impact. But in cloud environments where resources scale elastically, queries compete with each other on a much smaller scale, if at all. Therefore, optimizing single queries has very little impact on the overall performance of workloads.

    Measuring Performance by Looking at the Median

    The heaviest or slowest queries are in the top percentile of queries. When trying to improve the overall user experience, the median performance can matter more, but it is indirectly affected when handling the extremes, so it tends to be less effective.

    The Long Tail

    In many workloads, a few highly visible queries can paint a misleading picture. It is common to have less than ten queries responsible for 20% of the load, and thousands of undistinguished “simple” queries responsible for 80%. Therefore, when data teams are trying to reduce cost, focusing on the most expensive queries may draw attention away from lower-hanging and easier optimization opportunities in “simple” queries.

    “Big Picture” Optimization

    Actions that improve a query (such as changing the layout of a dataset) may result in unintended consequences to other queries. Only a workload perspective can help evaluate the wider impact across other queries.

    The Cluster Approach to Optimizing Big Data Analytics

    Another traditional approach to optimizing data platforms is analyzing behavior from the cluster perspective. Most data platforms offer decent cluster monitoring of technical metrics, such as CPU load and RAM usage.

    But, focusing on cluster-based KPIs will draw attention away from the elements that have the highest impact. Understanding the workload entails understanding the business logic of queries: repeating query patterns, hidden dependencies, failure modes.

    Looking at this from a cluster perspective limits you to technical parameters, such as CPU usage. Without understanding the workload, data teams will miss issues such as a repeating calculation (to be made into an ETL flow) or an inconsistent calculation flow (like having different ways to compute the same business KPI).

    In environments where clusters are shared between different workloads, data teams often encounter additional challenges:

    Workloads Have a Business Context, Clusters Don’t

    From a cluster perspective, there is no inherent prioritization between queries, and data teams find it difficult to focus only on business-critical workloads. The outcome is often reverting to focusing on specific queries, which doesn’t offer an effective solution.

    Workloads Have Different Needs

    Take, for example, an ETL workload which may require a large amount of RAM, run hours and which must be finished by 7 am. An interactive data product workload may be composed of thousands of queries that each must return in under 2 seconds. Analyzing the cluster as one unit can lead to suboptimal behaviour of both workloads. While this example can be considered simple to detect, many workloads that seem similar can have widely divergent needs.

    As data lakes gain momentum as production-grade, big data analytics architecture, data teams need to shift attention from optimizing queries to measuring, analyzing and optimizing workloads. In the early days of big data, data warehouses were isolated data platforms tasked to deliver insights for a very specific set of business questions. But as the cloud rapidly evolved, the mere migration of data warehouses to the cloud is not enough. The next stage is moving production workloads to the data lake.

    Storage is so much cheaper, and organizations want to run queries on any dataset, whenever they need it. It’s this heterogeneous collection of many different queries that requires workload-level visibility to ensure each workload can truly meet performance and budget requirements.

  • Datadog Expands Scope of Monitoring, Analytics Services

    Datadog Expands Scope of Monitoring, Analytics Services

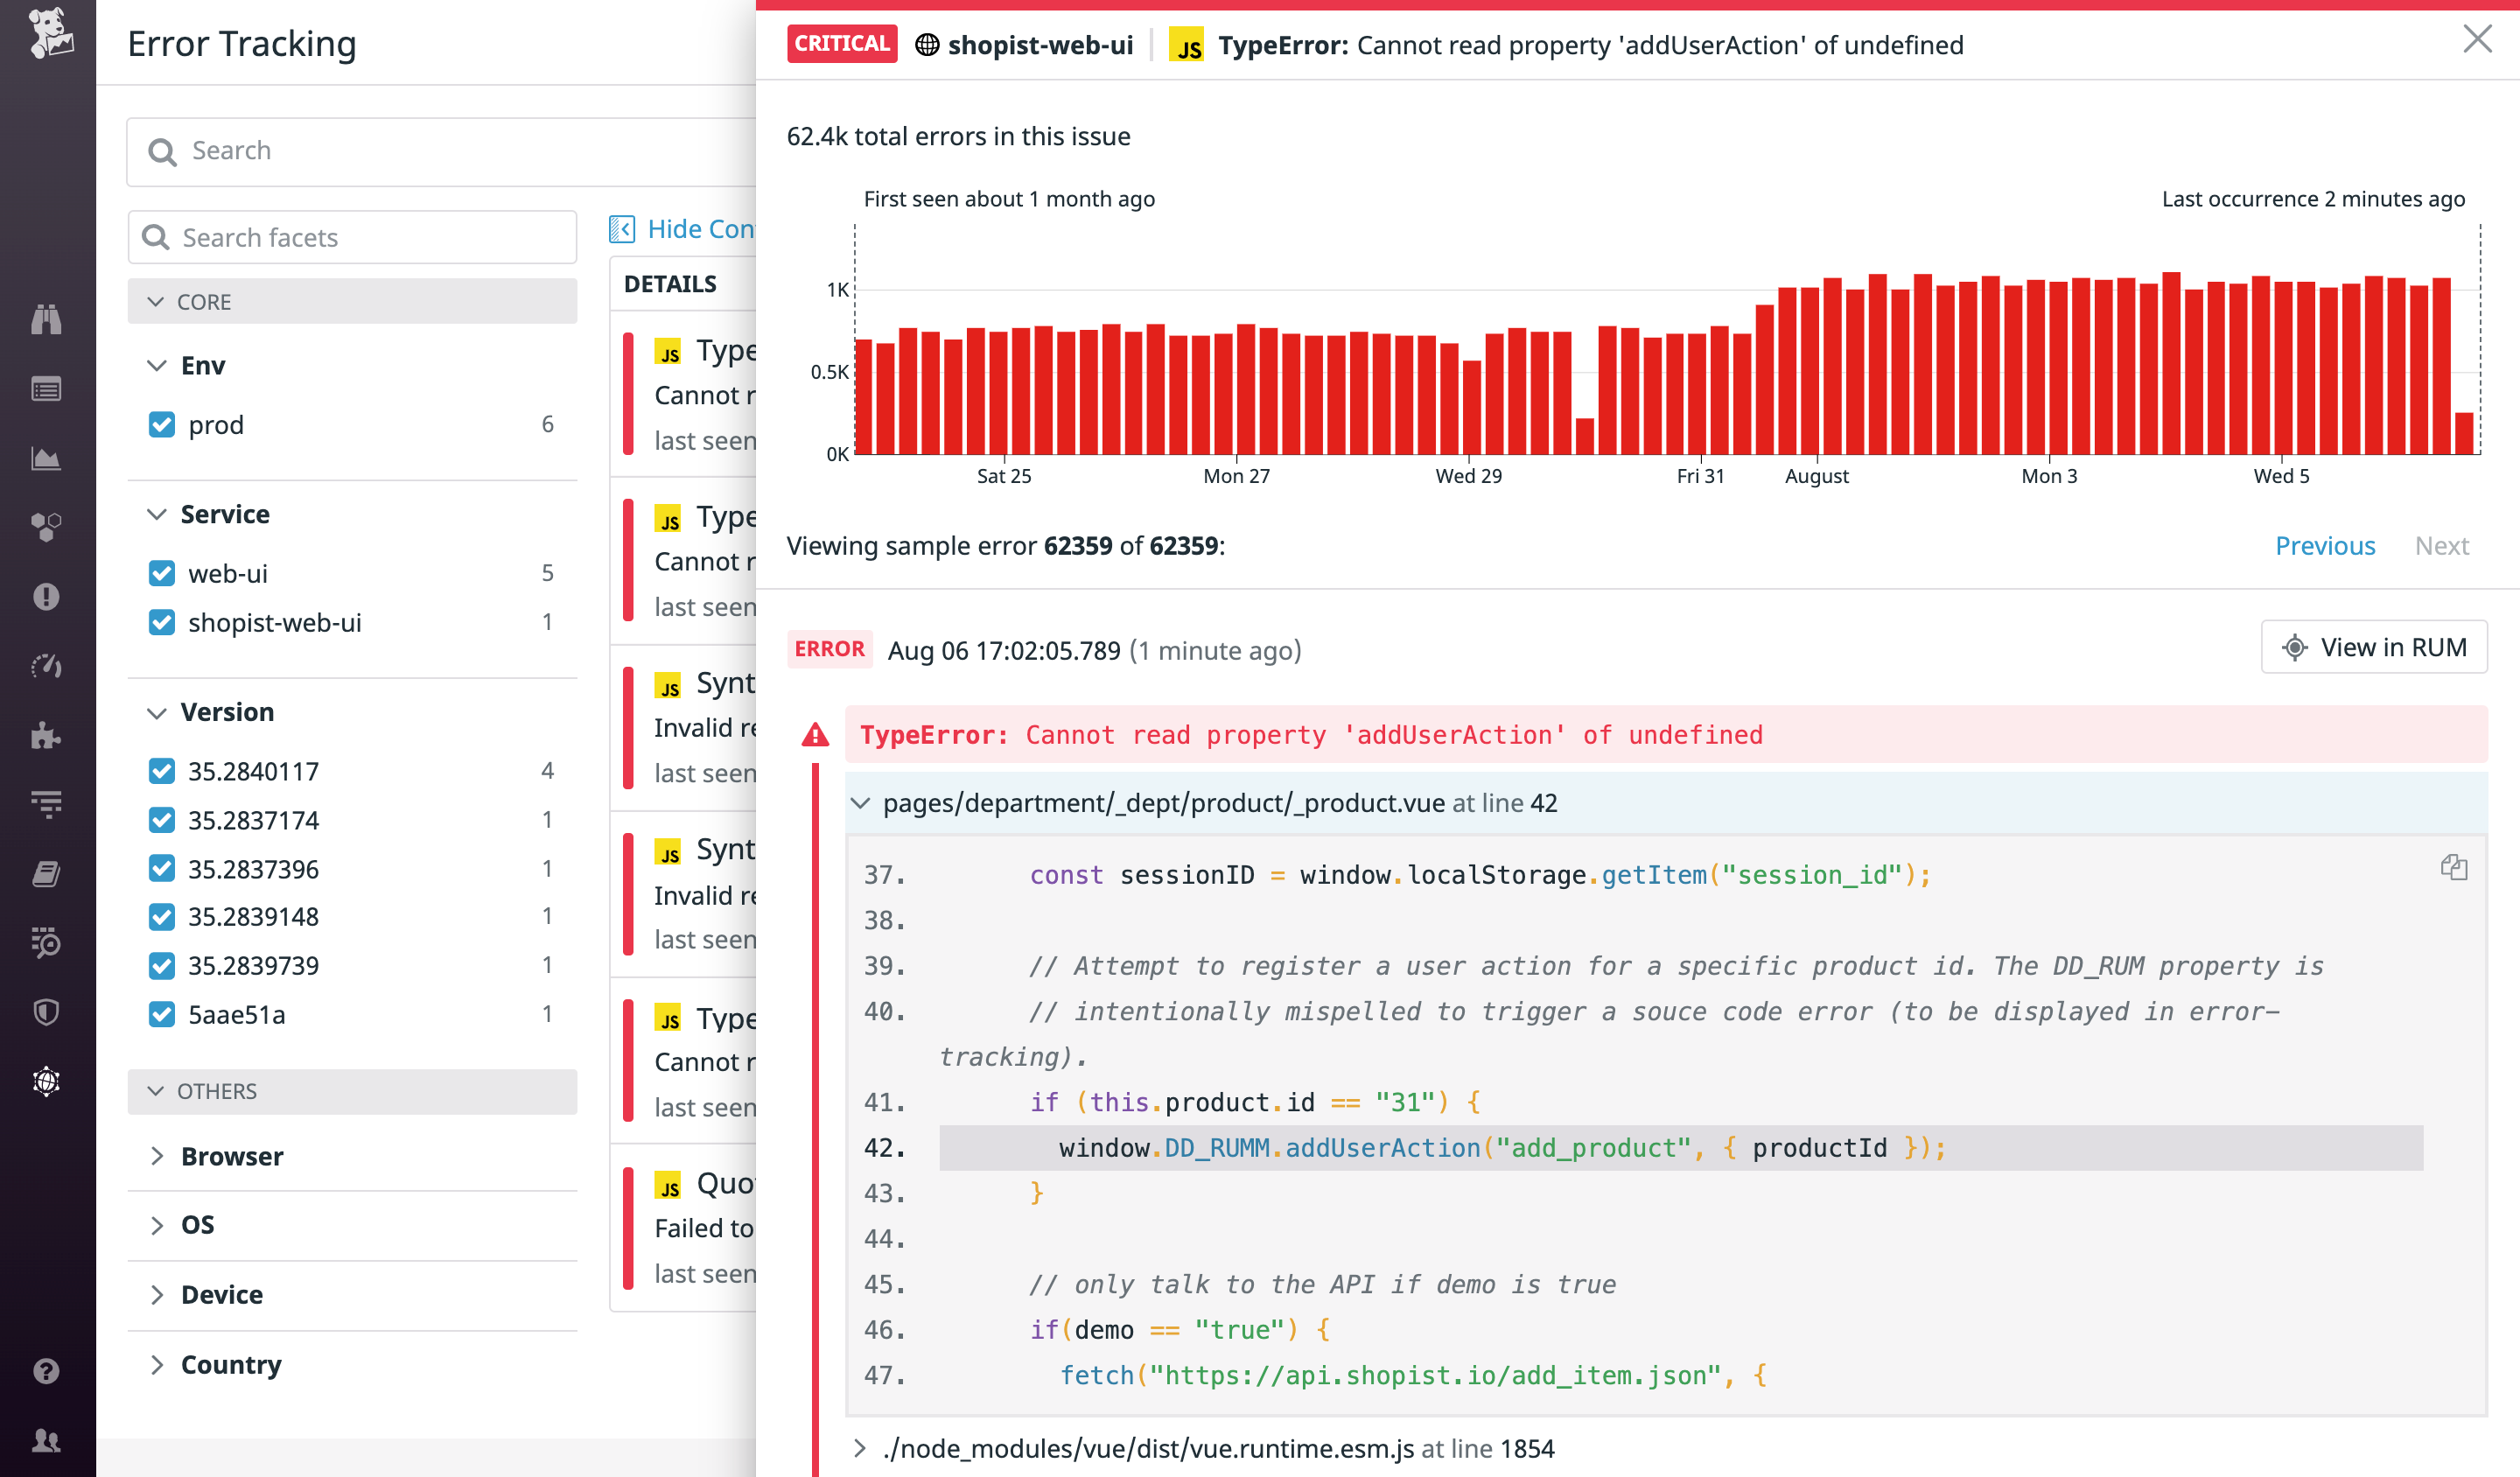
    Datadog, at its online Dash conference today, launched an incident management platform along with additional analytics tools to identify application errors and performance and compliance issues.

    Amit Agarwal, chief product officer, said these latest additions to the Datadog platform are intended to further consolidate IT management and monitoring. IT organizations should not find themselves acquiring and support 20 different tools that essentially all do the same thing, he said.

    The Datadog Incident Management service accomplishes that goal by streamlining incident response workflows by unifying alerting data, documentation and collaboration in a centralized pane of glass. Those workflows can then be used to create playbooks that automate incident responses.

    At the same time, Datadog has made generally available Continuous Profiler, to specifically measure the performance of code in a production environment, and launched Error Tracking, which automatically aggregates all related application errors in real-time to surface actionable issues more easily within the context of a DevOps workflow process enabled by the command-line interface (CLI) that Datadog provides.

    Datadog is also launching Compliance Monitoring, a service designed to identify misconfigurations that cause compliance-issue drift as soon as they occur. Once problems are identified, Datadog Compliance Monitoring immediately alerts the DevOps team.

    Finally, Datadog has launched a marketplace to make complementary third-party applications more accessible to end customers. Participants in the Datadog marketplace include Fairwinds, Trek10, RapDev and IO Connect.

    As more organizations embrace observability as a core tenet of best DevOps practices, Agarwal said the need to consolidate monitoring tools to provide greater context is great. Those tools need to address application issues not only in IT infrastructure management but also in security and compliance requirements, added Agarwal.

    Given the cost of maintaining all those platforms, however, it makes more financial sense for IT teams to rely on a service that makes all those capabilities available via a single integrated platform, he said.

    In the wake of the economic downturn brought on by the COVID-19 pandemic, Datadog is making a case for consolidating IT monitoring and management to reduce total costs. The company is betting many DevOps teams would prefer to allocate resources to developing applications rather than provisioning and maintaining DevOps tools.

    More IT organizations are simultaneously expected to embrace unified monitoring as they make the transition to microservices-based applications. Given the dependencies that exist between all the microservices that make up a modern application, monitoring is now a requirement for almost any cloud-native application. A cloud service provides the added benefit of being able to scale monitoring infrastructure resources and up and down as required.

    Of course, Datadog is not the only provider of unified monitoring tools with the same ambitions. However, it does have a significant base of customers that provides a foundation from which it can continue to expand. The only real issue is determining to what degree organizations will be willing to consolidate management functions, given all the vested interests involved.

  • Pinpoint Dives Deeper into Software Delivery Analytics

    Pinpoint Dives Deeper into Software Delivery Analytics

    Pinpoint has extended its platform for managing software delivery to include the ability to analyze historical events to facility team reviews as well as more accurately predict where bottlenecks are likely to emerge based on the past performance of the DevOps team.

    Company CEO Jeff Haynie said the company’s namesake software is employed today mainly to identify existing software development bottlenecks. Pinpoint is now making greater use of machine learning algorithms and advanced analytics to surface additional insights and recommendations, he said.

    Designed to collect data from multiple tools and platforms spanning a DevOps process, Pinpoint automates most of the tedious tasks associated with collecting the metrics required to manage a distributed development team, Haynie said. With more developers working from home in the wake of the COVID-19 pandemic, that ability to collect metrics automatically also plays a key role in allowing application development managers to set more meaningful agendas for meetings that now occur via videoconference rather than in a physical conference room.

    In effect, the application development process can no longer be managed by simply walking around the office to find out what everyone is working on, he noted.

    The analytics should also serve to make events, otherwise known as ceremonies, more meaningful because they can include metrics detailing what was actually required to achieve a specific goal, he added.

    Ultimately, the goal for any DevOps team should not be to simply write more code faster. IT leaders need to make sure the right code is being delivered at the right time to ensure application development projects stay on track.

    Providers of various DevOps platforms have been investing in tools to manage the software delivery process. However, each of those offerings is optimized for a specific platform. The Pinpoint dashboard can be integrated with any platform, including Azure Team Foundation Server (TFS), GitLab, GitHub and Bitbucket. Assignments made in Pinpoint can also then be automatically reflected in these platforms as well as project management applications such as Jira, said Haynie.

    One of the biggest issues with software engineering is that, from a business perspective, it’s been a “black box” that has made it difficult to plan. The more dependent a business is on software, the more problematic that issue becomes. Many issues could be avoided if only there was more visibility into how software development resources are being applied when and where. In fact, as more organizations prioritize digital business transformation in the wake of the COVID-19 pandemic, the more critical it becomes to maximize use of limited software development resources.

    Of course, organizations have been trying to manage software development projects using spreadsheets and project management applications for decades. The tools are not likely to be replaced anytime soon simply because of the level of process inertia attached to them within most organizations. However, given the current state of application development, it should be apparent those tools are not enough to get the job done on time.