Category: Application Performance Management/Monitoring

  • Mastering the Shared Responsibility Model

    Mastering the Shared Responsibility Model

    It’s no secret that cloud-native application development is growing exponentially, with Agile development, IaaS and PaaS from providers like Amazon, Microsoft and Google, enabling innovation at a pace that is challenging for security to keep up with. 

    A global pandemic and the resulting remote work mandates have only accelerated this movement. And with this change in distributed work and agile application development comes greater security considerations—and a higher degree of risk to the business. Security in the cloud is a shared responsibility, but too many organizations find it difficult to fully understand their role in the security of their applications. There are many elements of securing cloud-native applications that cannot be delegated. They require careful attention as part of a risk-based application security program that extends from design to development throughout their application development life cycle.

    With the appropriate visibility, risk-based thinking and automation, cloud-native applications have the ability to be more secure than ever, while enabling faster development and delivery at the same time. But to get to this point, organizations need to understand their responsibilities. 

    Cloud infrastructure security and compliance are necessities for ensuring how applications and data are deployed and operated in the cloud. But what about what is in those applications? Applications are made up of lines of application/infrastructure code and open source libraries built by developers, DevOps, product managers, security champions and other roles. 

    How do we know the components that make up the application are effectively secured? It is too late and not enough to solely rely on a secure cloud posture. Reducing risk early in the development lifecycle will dramatically reduce costs and business risk. Some sources have assessed the cost impact of fixing a risk in early production to be four to five times as much as one uncovered during design, and up to 100 times more than one identified in the maintenance phase.

    Modern applications are delivered through sophisticated “plumbing” of secure cloud infrastructure to our device interfaces. Just as we require clean and safe water to transit the physical plumbing into our homes, we need our applications to remain secure and high-quality as they transit cloud services.

    The IaaS/PaaS Shared Responsibility Model

    The best way to think about security in this cloud-native world is by using a shared responsibility model, with IaaS customers only responsible for certain elements of the security of an application that lies on top of the infrastructure. 

    In the traditional shared responsibility model, IaaS vendors are responsible for the configuration, management and security of infrastructure elements such as networking, databases and compute engines, in addition to physical security, redundancy and more. But each of their customers is responsible for the security and privacy of everything on top of that, from design to code to deployment.

    The Traditional IaaS/PaaS Shared Responsibility Model

    The Customer Side of the Shared Responsibility Model

    What’s missing from this model are software design, code risk and CI/CD security and integrity—and these areas are the most difficult, time-consuming and require a well-thought-out and comprehensive application security program.

    With new approaches to application security, organizations can better understand the risk of their cloud-native applications and automate a significant amount of risk remediation activities at the design or coding phases before deploying to the cloud. This requires taking a broad but contextual view of AppSec across the entire SDLC—and the modern nature of attacks requires a complete view of the SDLC to understand where the most impactful business risk lies.

    Organizations must evaluate the full picture of their risk—from design to code to cloud:

    1. Visibility—Understanding your risk starts with visibility into your security and compliance risks with a real-time inventory of assets, application and infrastructure code behavior, developer knowledge, third-party security alerts, sensitive data and business impact.
    2. Secure by Design—You need to make sure that security is addressed at the design stage—before any code has been written or committed.
    3. Change Management—Organizations need to focus on the risks that matter early in the development process and based on business impact. Material changes to the applications and infrastructure should be carefully evaluated while other changes can be approved more quickly or ignored, thereby accelerating product delivery.
    4. CI/CD Security and Integrity—As an ever-running, highly-trusted and sensitive process, CI/CD is often overlooked. Many attacks in the recent past exploited this Achilles’ heel of the development cycle by embedding attackers’ code within native code commits or other automatic CI/CD processes. Organizations should ensure CI/CD operations are secure with integrity and security checks in place.
    5. App & Infra Risks Together—To properly secure your applications, you must correlate the risks of your applications and infrastructure in one platform.
    6. Automation—Automation must also be employed to limit mistakes caused by human error, ensure consistency in enforcement of policies and increase the speed of the DevSecOps process. Organizations must carefully manage this process, because automation can also introduce a new category of issues, such as race conditions, untimely triggering, incomplete state validation for edge cases, etc.

    Infrastructure-as-Code (IaC)

    The human element of risk has changed with IaaS and PaaS due to the power that cloud administrators now have. Instead of purchasing, configuring and deploying servers over a period of months, an admin can spin up a Kubernetes cluster or an S3 storage bucket, load customer data and expose it to the Internet with relevant identity and access management (IAM) policies in record time via infrastructure-as-code (IaC) using GitOps instead of ClickOps.

    The rise of IaC has enabled us to view, evaluate and respond to infrastructure changes in the same way we would any application code change. Organizations must apply the same governance rules and automation to review changes in infrastructure before they reach production, along with real-time analysis of cloud misconfiguration. 

    The main challenge is context! All IaC tools in the market today are looking at security misconfiguration as a single dimension (for example, an S3 bucket missing encryption; a cloud database missing SSL for incoming connections, etc.) and this creates a lot of noisy alerts. The risks of cloud infrastructure and the applications that run on top of it are inherently connected—it is harder to connect the dots and understand the true risk of changes than it is to accept alerts at face value!

    When securing your applications in the cloud, don’t rely on traditional tools and processes. Today’s technologies enable new approaches that help you understand and remediate risk in entirely new ways and make cloud-native applications more secure than ever.

  • Plutora Enhances VSM Platform with Release Insights

    Plutora Enhances VSM Platform with Release Insights

    Plutora has enhanced its value stream management (VSM) platform to provide dashboards that enable DevOps teams to better optimize application delivery.

    Jeff Keyes, vice president of product marketing and strategy for Plutora, said dashboards added to the platform will make it possible for application release managers to leverage predictive analytics to manage application delivery in a more progressive way rather than always having to react to an unexpected event.

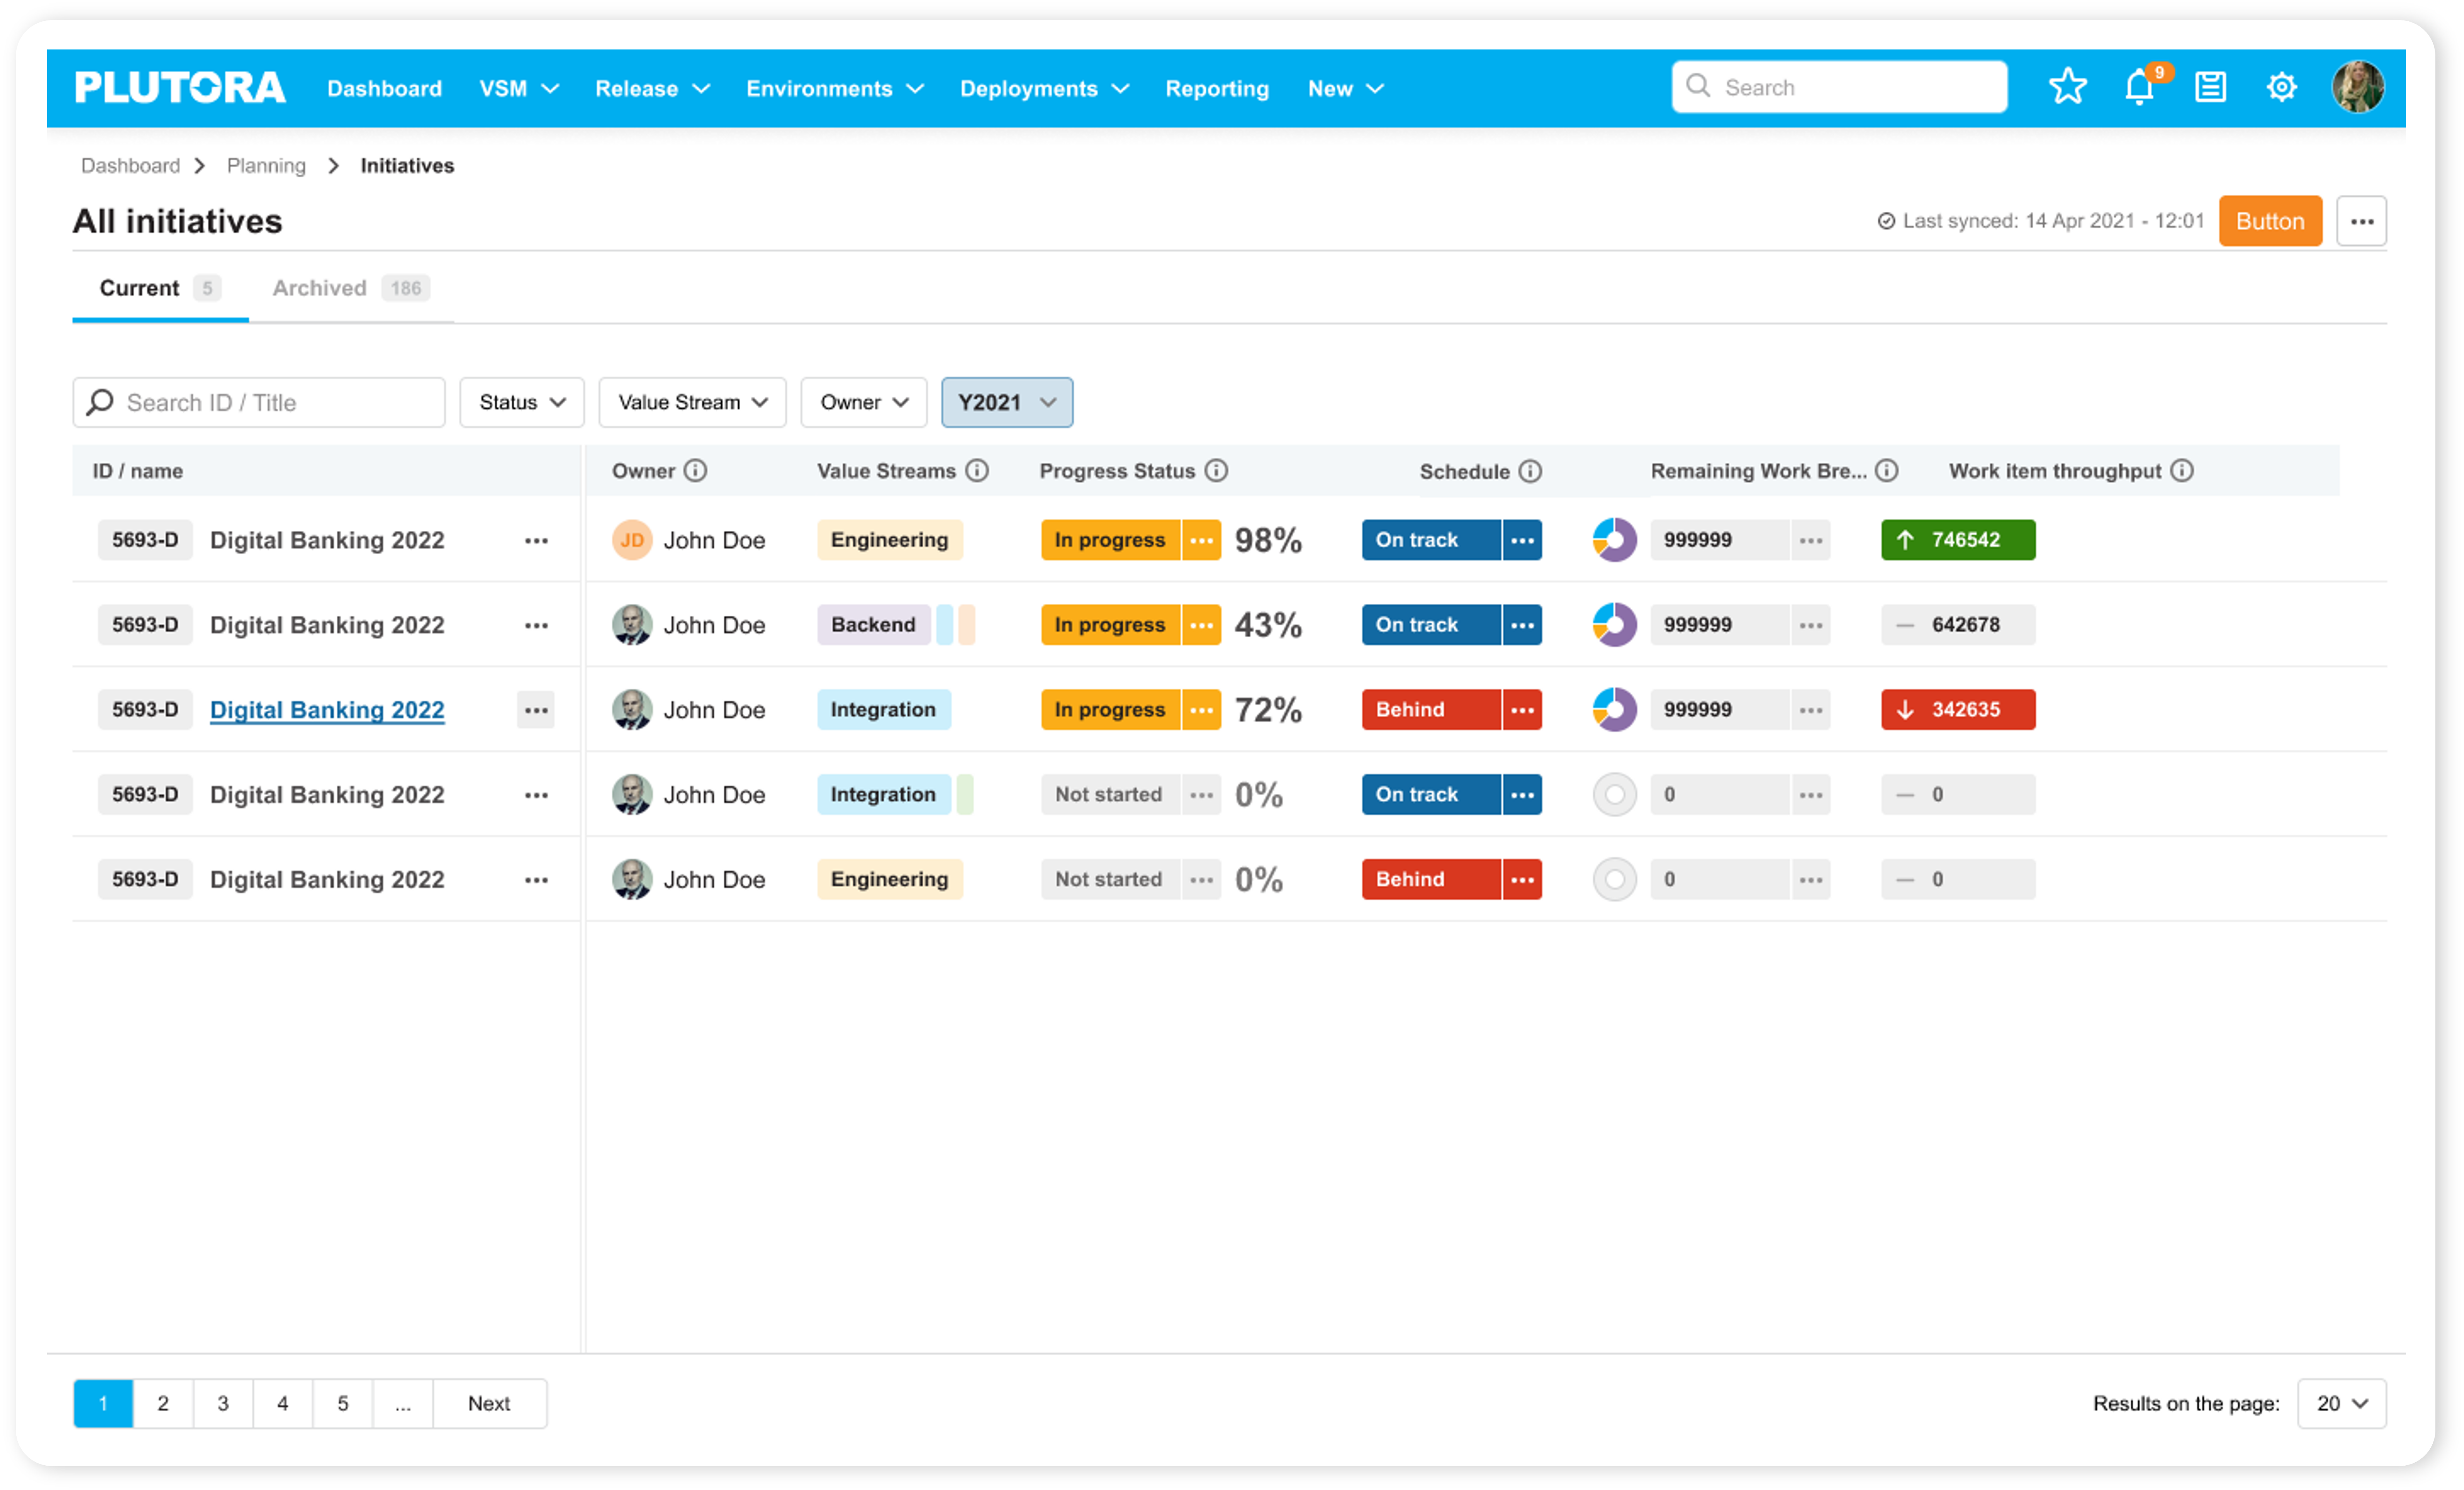
    To enable that approach, Plutora has revamped its release insights dashboard that surfaces problem areas and hot spots in addition to adding analytics that track both software builds and larger project initiatives.

    That latter capability is especially critical for executives that currently find it challenging to keep track of multiple software development initiatives, especially those that may have fallen behind schedule without senior leaders being aware of the implications, said Keyes.

    While VSM platforms are typically used by senior IT and business leaders to keep track of how software deadlines are impacting key performance indicators (KPIs) for the business, Keyes said it’s become apparent that application release managers need access to more advanced analytics to optimize application deployment schedules. The Progressive Release Management capability surfaces insights via dashboards in the Plutora platform; that makes it simpler for application delivery managers to optimally orchestrate allocation of resources.

    Release managers, of course, already have access to a wide range of platforms for automating the application delivery process. However, Keyes said, those platforms don’t provide enough insights into how to optimize application delivery across a DevOps workflow made up of disparate tools and platforms. Plutora enables release managers to employ value stream flow metrics and more traditional DevOps metrics to reduce cycle times and improve overall DevOps throughput.

    Keyes said once organizations are provided with that insight, they should also be able to reduce the overall fatigue level many DevOps teams currently experience by removing friction within those workflows. In fact, that fatigue level is a major reason why there is so much turnover in many DevOps teams, he noted.

    It’s not clear how many organizations have a dedicated application release team, but optimizing the software delivery process is a major challenge for almost every DevOps team. While many organizations routinely make use of continuous integration (CI) tools to build applications faster, continuous delivery of applications has proven to be a more elusive goal. This is largely because each platform on which applications are deployed tends to be unique. As a result, many DevOps teams still rely on spreadsheets to manually manage application deployments.

    However, as the pace at which applications are being built continues to accelerate, it’s clear that application delivery is becoming a bottleneck. VSM platforms provide a means of applying analytics to optimize a process that can then be used to make better-informed decisions that might convince more organizations to automate application delivery. That assumes, of course, that the organization had the foresight to invest in a VSM platform capable of surfacing those insights in the first place.

  • Nobl9 Adds Hydrogen Platform to Surface Technical Debt Issues

    Nobl9 Adds Hydrogen Platform to Surface Technical Debt Issues

    Nobl9 today unveiled a Hydrogen platform that makes it simpler for DevOps teams to identify technical debt issues as they manage service level objectives (SLOs) as code.

    Hydrogen enables DevOps teams to define SLOs using a simple wizard or by embedding code within their application as part of a DevOps workflow. That code is then used to automatically collect data from platforms such as Datadog, New Relic, Prometheus, Splunk and others with requiring any additional instrumentation.

    Nobl9 COO Kit Merker said that approach also makes it possible to surface technical debt that inhibits achieving those goals via the Hydrogen platform. Armed with those insights, it then becomes easier for DevOps teams to focus on reducing or eliminating that technical debt because Hydrogen automatically generates a ticket in the Jira project management application—widely used by DevOps teams—to make sure the issue is addressed. Otherwise, in the heat of a DevOps sprint, the issue is likely to be forgotten as the application development project continues to move forward, noted Merker.

    The ability to identify that technical debt is an outgrowth of the ability to manage SLOs as code that is enabled by the core Nobl9 software-as-a-service (SaaS) platform. Hydrogen extends that capability by automating workflows whenever a specific service shows indications that it cannot meet objectives because of a dependency on a legacy platform that needs to be upgraded, added Merker.

    There is also a service health dashboard that organizes SLOs into logical groups that are mapped to features via labels, which Merker noted makes it possible for multiple stakeholders to easily identify which issues affect a particular service most. Hydrogen can also trigger a variety of automated workflows to prompt additional investigations that escalate as services worsen.

    Overall, Hydrogen is designed to provide engineering teams with more accurate context that can be used to prioritize which issues should be addressed first during any technical debt planning cycle, said Merker. Hydrogen can enforce code release policies based on technical debt budgets that are enforced via integrations with continuous integration/continuous delivery (CI/CD) platforms.

    Technical debt generally refers to any code change that is required to optimize a service that is not immediately addressed. The more legacy platforms there are in an IT environment, the higher that technical debt tends to become. At a time when more organizations are building and deploying microservices-based applications, that technical debt, over time, tends to adversely affect applications that are much more dependent on external services than a traditional monolithic application. A single technical debt issue can have a cascading impact on multiple microservices-based applications that would, otherwise, would be difficult to detect.

    The challenge, of course, is that technical debt doesn’t always get the attention it deserves when most of the IT team is focused on rolling out the next great application. However, as application environments become more complex it may only be a matter of time before all the technical debt that is being accumulated becomes unsustainable.

  • Prioritizing Scalability, Reliability and Security in Engineering

    Prioritizing Scalability, Reliability and Security in Engineering

    As digital products and services are more deeply embedded in critical industries and infrastructure and the implications of problems grow in scope, engineering organizations are renewing their focus on building platforms that are scalable, reliable and secure. More importantly, they are recognizing that this isn’t the responsibility of an SRE or CSO, it’s an ethos that must be carried each day by every engineer on the team. This is an important shift—from teams and cultures that valued speed of delivery above all else to teams and cultures that make high-quality systems the foundation of everything they do.

    This isn’t easy, and big cultural changes don’t happen overnight. There are many things that can go wrong when the team is operating in the legacy mode of prioritizing quick time-to-market but there are also some strategies and best practices for beginning the process of cultural change across your engineering organization.

    The Old Way of Doing Things

    You’re the engineer on call, and you get woken up at 3:00 a.m. by an alert that tells you an app is down. Groggy and annoyed, you look at the message and have no idea what service it’s referring to or where to begin.

    After nearly an hour, you can’t figure out who owns the service or how to get it up and running. So, you call that senior engineer on your team—you know the one—the person who gets called every time there’s a tricky question or problem. Thankfully, they answer your call in the middle of the night and help you bring the app back up. But in a month, the same scenario happens again; only this time, when you go to call that senior engineer, they’re no longer there. They quit to go work at a company that cares about reliability.

    Best Practices for Today

    How can you avoid this vicious cycle? Here are some best practices you can implement to begin shifting focus away from speed and toward scalability, reliability and security.

    1. Evangelize the Narrative That the Systems you Work on Matter

    At the end of the day, your systems are there to serve your customers and users. Leadership and teammates who embody these values are incredibly important. People should worry about letting their customers down, not about being yelled at by their manager or receiving a bad performance review.

    2. Set Explicit Expectations about Uptime

    When you say that your app needs to have 99.99% uptime, it doesn’t have the same impact as saying 52.6 minutes of downtime a year. Translate uptime numbers so they’re tangible—and on people’s minds every time there’s an outage.

    3. Don’t Sweep Problems Under the Rug

    After the dust settles from an incident, it’s important to get together and talk about it. Be transparent about what happened, which person or team made the error and what the implications to users were. The idea isn’t to point fingers or assign blame but to bring the team together so that you can learn, evolve and figure out how to prevent this from happening in the future.

    Here are some questions you can use:

    1. Who wrote the code?
    2. How was it tested?
    3. Should our automated testing have caught this?
    4. Who reviewed this code?
    5. Were they the right people to review the code?
    6. Why wasn’t it caught in the staging environment?
    7. Who released it and who went through the release validation checklist?

    Formalizing this process lets everyone on the team know that mistakes are part of the job and that there’s a standard way that problems are handled. This is a great way to help engineers feel free to do their best work without fear or avoidance.

    4. Define Individual Owners for Every Piece of the System

    If there’s any confusion about who owns what within your engineering org, you need to address that right away; it’s a massive problem. Not only do you need an owner for every part of the system, but they must also be empowered to fix issues and know that they’re the ones on the hook.

    5. Invest in Documentation, Runbooks and Logs

    The owner of each piece of the application is also responsible for making sure that documentation is up to date, runbooks are clear and easy to follow and logs are readily accessible. When you’re getting paged at 3:00 a.m. about a service you’ve never heard of before, these resources are key.

    6. Prioritize the Delivery Pipeline Like it’s a Key Feature

    You should always be thinking about how to build safeguards around your workflows, like automated testing or new tools. This may mean you need to go toe-to-toe with product managers to make sure the work required to build a robust delivery system isn’t getting kicked down to the backlog.

    7. Get Business Buy-In by Using Terms They Understand

    Unreliable code is technical debt. And debt is something all leaders understand, regardless of their technical abilities. Stripe published a survey in 2018 that found the average developer spends more than 17 hours a week dealing with maintenance issues, costing $300 billion per year globally. If you’re pushing to invest in SRE practices, those numbers might help you make your case.

    Culture comes first, but the right tools can reinforce the culture and drive accountability over time. Tools that help teams keep track of critical information such as service owners, documentation and runbooks can help tremendously. Additionally, having easily available dependency maps of the architecture are key to quickly understanding complex systems. Lastly, setting organization-wide standards for best practices and providing templates for spinning up new services that follow these can help ensure that these things are not forgotten.


    This article was based on a talk given by the author at Conf42: SRE 2021. 

  • Data Theorem Adds Runtime Protection Enabled by Observability

    Data Theorem Adds Runtime Protection Enabled by Observability

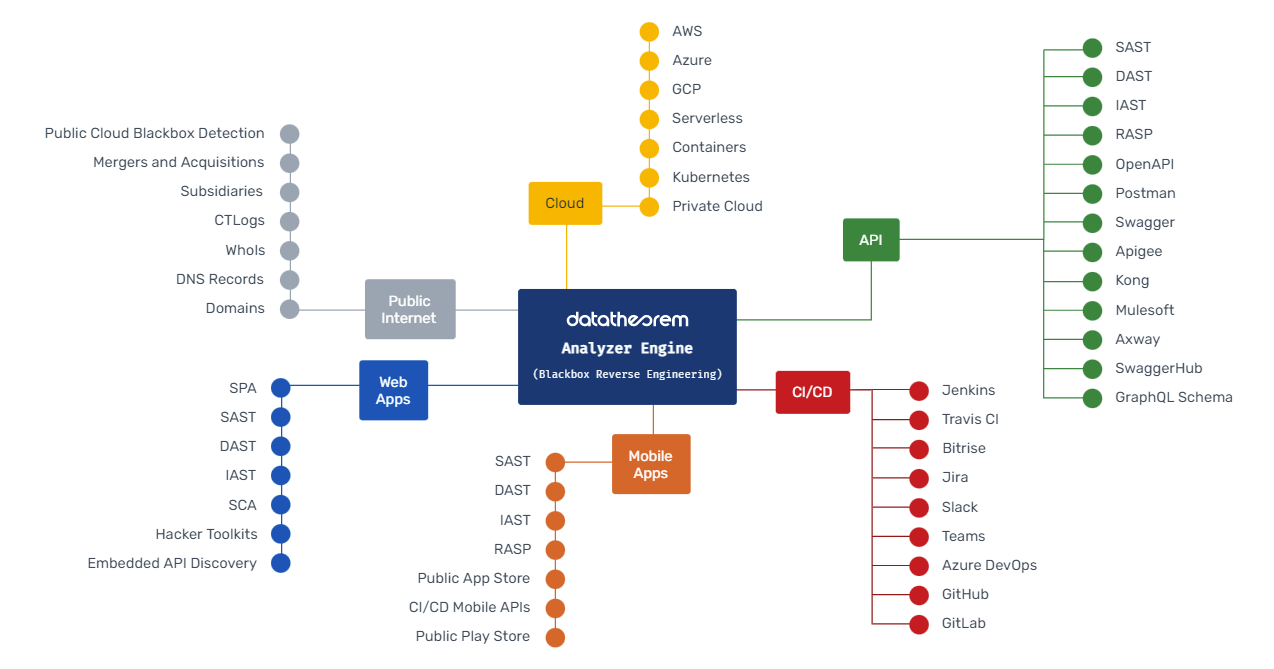
    Data Theorem, Inc. this week added an Active Protection offering to its portfolio of application security services that makes it possible for DevOps teams to embed observability and runtime defenses in their applications via a software development kit (SDK).

    The Data Theorem cloud services are based on Trustkit, an open source framework the company created to make it easier to employ secure socket layer (SSL) to encrypt connections and Analyzer Engine, its runtime analytics engine.

    The company is now extending its services to make it possible to embed observability capabilities by collecting logs and traces. Those logs and traces are then used to enforce runtime security policies that protect applications from known attacks from malicious sources and other common attack vectors as defined by the Open Web Application Security Project (OWASP) Foundation. It also prevents violations of encryption levels, authentication types and authorization rules along with a variety of custom rule checks, including preventing broken object-level authorization (BOLA) attacks.

    Doug Dooley, Data Theorem COO, said Active Protection can be applied across any application stack, including microservices applications based on cloud-native frameworks. In contrast, existing approaches to securing application runtimes based on web application firewalls (WAFs), runtime application self-protection (RASPs) or endpoint detection and response (EDR) agents cannot be applied to cloud-native applications based on containers and serverless computing frameworks.

    Active Protection solves that issue because it is designed to be applied via the Data Theorem software development kit (SDK) or using application extensions made available via a serverless computing framework or as a container sidecar.

    Dooley noted that the Active Protection service is also designed to be fully integrated with DevSecOps workflows that are increasingly being driven via continuous integration/continuous delivery (CI/CD) platforms to enable continuous, automated security inspection and remediation. The company claims to have detected more than one billion application incidents and is currently used by more than 8,000 applications.

    Developers don’t generally set out to build and deploy insecure applications. The issue is most developers don’t have a lot of security expertise, so it’s easy for mistakes to be made. Organizations looking to embrace DevSecOps best practices need to find a way to achieve that goal in a way that developers can easily embrace. The more automated the checks for security issues become during the application development process, the more likely it is developers will make additional efforts to remediate vulnerabilities long before an application is ever deployed in a production environment. In effect, DevSecOps is easier to achieve when addressed from the bottom up rather than via an edict from above without any real implementation plan in place.

    It’s still early days as far as DevSecOps is concerned, but as best practices for DevOps continue to evolve, there may come a day when security is just another gate that needs to be passed within the context of a larger DevOps workflow. In the meantime, DevOps teams and cybersecurity teams should put aside their differences and work together as the number of attacks launched against applications increases.

  • Observability Matters. But Are You Observing the Right Things? 

    Observability Matters. But Are You Observing the Right Things? 

    It’s like clockwork. Every few months, a new buzzword descends on the tech industry, and soon it’s on everyone’s lips. Take your pick from the graveyard of buzzwords past: “Big data,” “internet of everything,” “hacktivism,” “gamification.” It’s not that these terms are meaningless—just that they go from relatively obscure to ubiquitous seemingly overnight. We can add a new one to the list in the digital monitoring space: “Observability.”

    Unlike some trendy buzzwords, observability captures something that’s actually quite important about how we monitor digital systems and how current approaches differ from those of the past. So, it’s a good and useful concept. But where I take issue is with the way many analysts, technologists and vendors seem to use it. Whether or not they mean to, they often paint a far too narrow a picture of what observability is or ought to be, and that linguistic oversight can have real-world consequences. If enterprises invest in observability without understanding what, exactly, they’re observing—and what they’re not—they risk leaving themselves vulnerable to some serious blind spots. 

    What is Observability and Why Does it Matter?

    Technically, observability is an approach with the goal of understanding how a system is doing. The distinction lies in what the system is and how it is being observed. The monitoring tools of yesterday typically focused on one or more domains to identify typical and known problems. Usually, that entailed collecting metrics directly from those domains and measuring them against predefined thresholds. For example, storage levels shouldn’t exceed a certain threshold; if they do, send me an alert so I can investigate what’s happening. 

    On the other hand, observability takes a more holistic approach, examining multiple outputs of the system to infer system health. For example, suppose you were trying to gauge a car’s condition. In that case, traditional monitoring might track engine temperature or idle speed RPMs, while observability would examine things like power output, engine leaks, transmission noise, emissions and fuel efficiency to infer the car’s overall health. 

    This output or outcome-focused approach to managing performance maps well to today’s complex and distributed digital systems. Even if you wanted to, you couldn’t pull real-time metrics from every relevant component of a system when those components consist of thousands of microservices running in any number of physical servers across multiple clouds. However, the bigger problem with more antiquated monitoring models is that they only capture the specific metrics they’re designed to track. If you’re encountering a problem you’ve never seen before, your monitoring dashboard might look perfectly healthy while actual system performance is terrible. 

    Observability and APM 

    So then, observability should give you everything you need to track the health of a modern digital business, right? Well, not so fast. Because for today, people seem to use “system observability” interchangeably with “application performance monitoring,” or APM. And they are not at all the same. 

    Yes, you want an observability-based approach to tracking your application environment, and modern APM tools provide a great way to do it. But knowing the health of your application environment is not the same as knowing the health of your overall digital systems as experienced by users. And at the end of the day, if you’re not gauging performance from your users’ perspective—whether that’s customers, employees or other devices relying on your systems—then what’s the point? It’s unfortunately not uncommon to forget that the most important key performance indicator (KPI) of any digital system is the quality of its intended output or outcome. In the case of any application, the most important KPI is the user experience.

    The outputs that APM tools track do contribute to the user experience—and you want to be monitoring them. But so do many, many other things. There’s the user access itself (browsers, virtual or physical user devices loading the application). There are local, regional and global networks connecting those users to your application environment. And then, of course, there are the dozens, sometimes hundreds of third-party digital services running between and among users and applications. Problems in any link of that digital chain can seriously impact the user experience—even if your application environment itself looks healthy. 

    Observing End-to-End, from User to App and Everything in Between 

    To get the full picture of the health and performance of your digital assets, you should be tracking outputs from across the end-to-end digital service chain. That includes telemetry (logs, infra metrics, traces) from your application hosting environment. It should include actively and passively observing at the point of consumption—that is, outputs from customer browsers and worker devices. It must include active and passive monitoring of network connectivity. And it should include continuous active monitoring of all the disparate services—APIs, content delivery networks (CDNs), DNS services, cloud-based security services and every other cloud and web service that contributes to what the user is experiencing. (And by the way, you should look for independent, objective telemetry whenever possible rather than taking what your various service providers report at face value.) 

    When you approach observability from this outcome-based, holistic perspective, you can capture a real and truthful picture of the performance of your full digital business, not just pieces of it. Just as important, when you do identify a problem, you’re in a much better position to do something about it. Because now you have outputs to measure from all the many systems and services that contribute to the user’s application experience instead of just a subset of them, which means it’s much easier to zero in on which piece of the puzzle isn’t behaving the way it should. 

    A Smarter Approach to Observability

    So, should you take all the hype about observability seriously? Yes. As tech buzzwords go, you could do a lot worse. This one actually means something important. But make sure you’re keeping the big picture in mind as you do. 

    Observability that ignores the outcome begins and ends with the application environment and is nowhere near sufficient. We need to expand our sense of observability, begin with the user experience and encompass every link in the chain of the end-to-end digital business. When we do, we create a much more holistic, useful and actionable picture of the health of our digital systems. And we can make sure we’re continually monitoring digital performance in the way that matters most: As experienced by users. 

  • Allstacks Adds Free Dashboard to Track Software Dev Benchmarks

    Allstacks Adds Free Dashboard to Track Software Dev Benchmarks

    Value stream intelligence platform provider Allstacks today added a free live dashboard populated with anonymized data that DevOps teams can use to benchmark their own progress.

    Hersh Tapadia, Allstacks co-founder and CEO, said the company is making this data available to make it easier for DevOps teams to uncover bottlenecks in their software development processes.

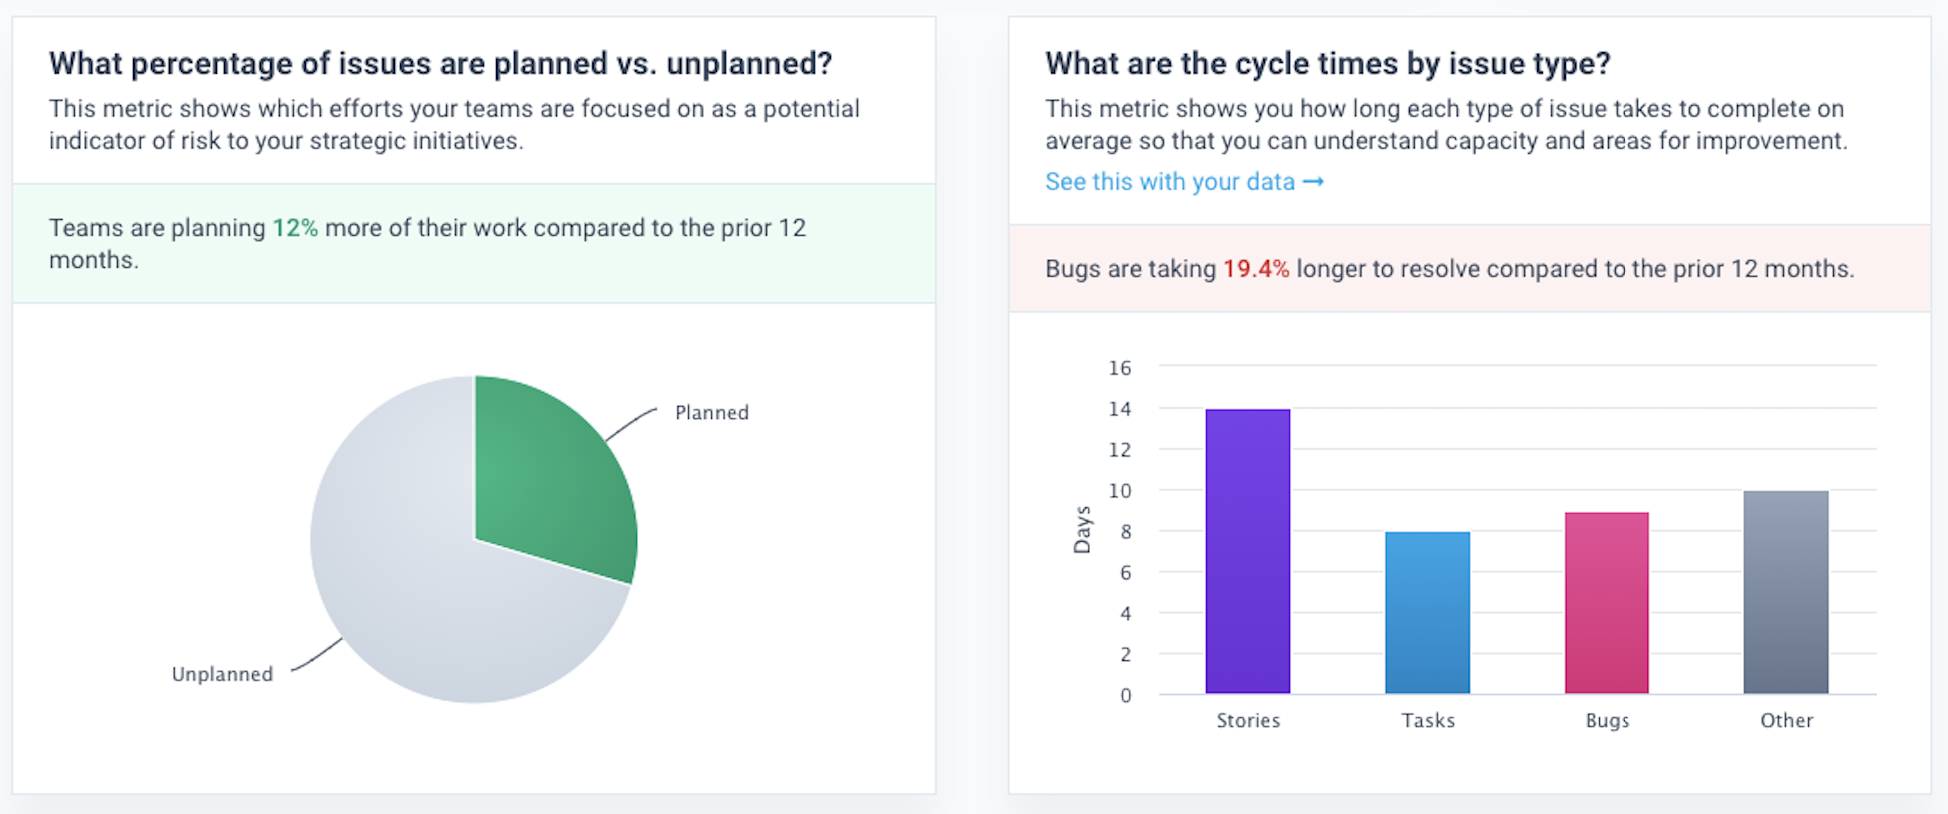
    As part of that effort, the dashboard includes pre-configured benchmarks for the following:

    How many days per week do benchmark teams write code?
    What percentage of issues are planned versus unplanned for benchmark teams?
    What are the cycle times per issue type for benchmark teams?
    What types of code do benchmark companies produce?
    What is the average commit size for benchmark customers?

    Allstacks

    Allstacks has committed to making 12 months of data publicly available on the dashboard and said it will update that data on an ongoing basis. Allstacks customers, however, can also access five years of data to compare historical trends.

    Tapadia said Allstacks plans to add additional benchmarks to a dashboard that can collect data via the various application programming interfaces (APIs) that most DevOps tools now routinely provide. The overall goal is to increase transparency into software development processes, he said.

    Allstacks’ value stream intelligence platform uses machine learning algorithms and artificial intelligence (AI) models to identify projects that are at risk of not meeting delivery goals. That data is then used to analyze the impact those missed deadlines are likely to have on various business objectives.

    Value stream management platforms automatically take technical metrics, gathered via a DevOps process, and match them to a set of key performance indicators (KPIs) defined by business leaders. The challenge many organizations still face is making sure they have the tools in place to collect the appropriate technical metrics and then define the KPIs that truly matter to the business. Once those metrics are gathered and KPIs established, organizations are then able to apply advanced analytics to the massive amounts of DevOps data they collect.

    The concept of value stream management traces its lineage back to lean manufacturing methods, which called for each step of a manufacturing process to be continuously measured. As software development has evolved from being a craft to a process that is highly automated using DevOps best practices, an appreciation for the value of monitoring the impact of missed software development deadlines on the business has grown as organizations realize how dependent they are on software.

    As a result, more organizations realize there is a clear disconnect between their business goals and development processes, noted Tapadia. Business leaders are especially anxious to understand how a software development project delay might impact future revenue projections. Rather than being a set of tools employed mainly by IT leaders to track software development projects, value stream management platforms make it possible for other stakeholders to track KPIs spanning multiple software development projects. It then becomes easier to make informed decisions about how to reassign resources across various projects as different bottlenecks are encountered.

    It may be a while before organizations achieve that level of transparency into their software development processes, but as software continues to ‘eat the world,’ it’s only a matter of time before value stream management becomes a required set of DevOps tools for every organization.

  • Grafana Labs Expands into Incident Management Realm

    Grafana Labs Expands into Incident Management Realm

    During its online ObservabilityCON 2021 conference, Grafana Labs this week previewed an incident management platform in addition to making available an on-premises edition of its distributed tracing tool.

    Tom Wilkie, vice president of product for Grafana Labs, said the Grafana OnCall incident management platform is a natural extension of the observability tools the company already provides using the widely employed open source Grafana dashboard. The platform, which is expected to be generally available in 2022, is based on software Grafana Labs gained by acquiring Amixr earlier this year.

    Grafana OnCall unifies all the alerts created by Grafana, Prometheus and the Alertmanager tool the Prometheus community created to streamline the number of alerts generated by the platform. The goal is to reduce the alert fatigue a DevOps team might experience when dealing with an IT issue that can be traced back to a single root cause, noted Wilkie.

    Grafana

    At the same time, Grafana Labs made Grafana Enterprise Traces available for on-premises IT environments. It is based on Grafana Tempo, a cloud service that makes it possible to store and then analyze distributed traces using inexpensive object storage resources. The latest version of the core open source Tempo project has also been updated to add service graphs and the ability to search recent traces.

    Grafana Labs this week also updated Loki, an open source log management platform, to add support for out-of-order log lines, custom log retention policies per log stream and per tenant and a deletion API that makes it easy to scrub log data. Version 2.4 of Loki also adds additional high-availability capabilities.

    Other updates to the Grafana Labs platform include support for recorded queries, a set of pre-built dashboards that enable users to quickly drill into their Prometheus metrics data, the ability to consume metrics from the AWS CloudWatch service provided by Amazon Web Services (AWS), improvements to its ability to monitor Kubernetes clusters and updates to the open source load testing tool the company gained by acquiring k6 last year.

    Grafana Labs is also committing to expanding its integration with Microsoft Azure cloud service alongside its integrations with AWS, noted Wilkie.

    While competition among providers of observability platforms is already fierce, Wilkie said an observability platform based on an open source dashboard that can already collect data from more than 100 sources provides a unique advantage. At the core of the Grafana Labs platform is a centralized framework for collecting data generated primarily by the open source Prometheus monitoring platform being developed under the auspices of the Cloud Native Computing Foundation (CNCF).

    While Prometheus is used most often in Kubernetes environments, it is starting to gain traction in monolithic application environments as well; it provides an open source approach to defining a de facto standard for collecting metrics and other data that can be consumed by an observability platform.

    It’s not clear yet to what degree IT teams are distinguishing between monitoring and observability. Monitoring focuses on predefined metrics to identify when a specific platform or application is performing within expectations. Observability combines metrics, logs and traces to instrument applications in a way that makes it simpler to troubleshoot issues without relying solely on a limited set of metrics that are pre-defined and monitor a specific process or function.

    Regardless of whether IT teams view observability as being distinct from monitoring, it’s clear that the ability to manage IT environments is improving at a rapid rate. The challenge, of course, is the IT environment itself is becoming more complex with each passing day.

  • Driving Software Delivery Automation With AI/ML

    Driving Software Delivery Automation With AI/ML

    What if we could use an artificial intelligence (AI) engine to predict the next lines of software code to build? What if machine learning (ML) could trigger the creation of automated test cases to validate our solutions?

    Automation has been a focus for the information and communications technology (ICT) industry for years, and there are some lessons that could apply to the software developer community, too, as well as other verticals. Today, more streamlined execution of operational and software delivery processes, such as continuous integration, continuous delivery and continuous deployment (CI/CD) in app development, continue to drive new levels of cost reductions, allowing products to get to market and update faster. 

    However, with the increased amount of data comes more complex ecosystems and the need for the next level of automation. Hyperautomation, or the use of AI/ML to further streamline processes, could build on these CI/CD processes, revolutionize the way multiple industries deliver software and optimize operational processes.

    Today’s Network Complexities and Challenges

    In the telecommunications industry, disruptions from hyperscalers and other innovative players, as well as increasing levels of investment in 5G technology, are forcing the hand of communications service providers (CSPs). This is causing them to turn to automation to improve their levels of operational efficiency and innovation to keep up with the need to push frequent updates. 

    However, challenges remain in the form of:

    • Total cost of ownership and operating costs: With more frequent needs for upgrading existing networks, additional levels of automation including AI/ML and hyperautomation are required to manage and maintain today’s complex networks. 
    • Time to market: In an increasingly competitive market, the CSP’s ability to react to market needs and/or new marketing ideas and to rapidly launch those needs and ideas to their end users and enterprise customers is a key competitive differentiator. 
    • Customer experience: Digitalizing business processes, providing an increased level of self-service and seeking ways to optimize customers’ overall journey remains an important need.
    • Employee productivity: In an effort to increase revenue, more efficiently drive their networks and improve end user customer experience, CSPs also need to increase employee productivity. They can do this by engaging their employees to solve bigger problems. As a result, the simplest and most repetitive low-level tasks can be automated.

    The Power of AI and ML

    The automation journey started with breaking down complex processes into smaller parts and automating discrete parts using scripts, runbook automation (RBA) and/or robotic process automation (RPA). 

    With the introduction of AI emulating human intelligence through mechanical and computational processes and ML using algorithms that learn from data to make predictions and decisions, CSPs can now bring automation and hyperautomation to the next level. 

    The potential use cases for the delivery and maintenance of telco software solutions are unlimited, and many of these lessons can be applied to other sectors. Some examples include:

    Autonomous Fault and Anomaly Detection for Cloud-Native Solutions

    Today’s network solutions are deployed on containers and microservices. The identification of issues and assurance of service quality becomes increasingly challenging with thousands of workloads running in parallel. Container failure can cause severe service disruptions. In fact, a single service failure or abnormal behavior could have a butterfly effect on the overall system and negatively affect customer satisfaction. 

    A proactive, AI-based monitoring solution can continuously search for anomalous behavior in the environment. Different container metrics and logs can automatically analyze and detect problems proactively and help find the right corrective actions for the application workflows. This is based on identifying anomalies in the container orchestration metrics related to pods, workloads and namespace. These techniques enable a more reliable and predictable application runtime environment with higher service quality and faster identification and resolution of system faults and, ultimately, a better overall customer experience

    Machine Learning-Triggered Closed-Loop Automation

    Large clusters of compute, storage and networking resources are managed throughout a data center to enable the deployment of custom workloads. Due to the inherent nature of applications running on the virtualized and cloud infrastructure, there are usage highs and lows which need constant infrastructure component deployment or reconfiguration of the cluster to ensure cost-efficient service availability. 

    A machine learning-based solution can detect anomalies in the infrastructure. Specifically, with closed-loop automation, enterprises can bring in a layer of intelligence over the current setup to monitor application performance and infrastructure metrics and identify anomalies that require immediate system attention. If those are found, they can trigger the automated addition of capacity to the infrastructure. When anomalies have subsided and once the utilization is capable of being handled by the original capacity, the solution can consistently monitor metrics to roll back the virtual or cloud-native functions. This allows for an efficient and fully automated use of network capacity, minimizing human oversight.

    Smart Code Recommendations

    One of the most clear-cut ways tools can reduce the effort of software development for programmers is through code completion. AI-powered code completion is a convenient way to access descriptions of functions and their parameter lists. These solutions also speed up software development by reducing keyboard input and the necessity of name memorization. They also allow users to refer less frequently to external documentation, as interactive documentation appears dynamically in the form of tooltips. AI-powered code completion can also use an automatically generated in-memory database of classes, variable names and other constructs or references based on machine learning to open code repositories.

    AI-Driven Test Recommendation

    Significant time is spent understanding solution requirements and identifying critical scenarios for testing. This is usually followed by a manual test plan creation and execution. To solve this, AI/ML techniques can be applied to identify what tests will need to be done during each cycle of the software development stage, including automating the analysis of required documentation. This can be used to increase overall test-cycle time and improve productivity. 

    AI-Enabled Test Automation

    API testing is critical for validating application logic and needs to go beyond the GUI layer to validate the core of an application. This implies complexity because the protocols are usually difficult to understand, the API inventory is usually large and sequencing of the API calls is critical to a successful test specification and execution. With AI/ML and natural language processing techniques, the analysis of the solution test plan can be automated to obtain recommendations on what test frameworks to utilize, identify and suggest the parameters for each test case, identify the API call sequence and automate the development of test cases based on reusable functions. This can increase overall quality of service, simplify change management, improve the productivity of the testing team and offer more reliable test cases.

    Test Failure Analytics

    During execution of automated test cases, multiple failures can be observed in various logs. Manually analyzing the logs and correlating them with the application issues can be time-consuming. Also, the identification of unreliable tests impacting system stability is complex. 

    AI/ML techniques such as vectorization, K-means clustering or topic modeling can be applied to automate the collection of test logs across applications and label failures including the type of cluster failed tests. The test subject matter expert (SME) is provided with a failure analysis report summarizing issues and problems automatically from many logs across applications, simplifying the identification of issues in test automation areas or scripts. These techniques can significantly increase test productivity and overall troubleshooting time.

    Accelerated Root Cause Identification and Analysis (RCI&A)

    When a problem occurs in a telco network, it tends to cause a ripple effect, affecting other integrated services and creating an alert storm. In such scenarios, root cause identification can become complex and cumbersome. Event aggregation and synchronization are needed to reduce environment complexity and variance. 

    Machine learning weighted analysis techniques can be used to determine the influence individual IT metrics have in affecting the overall health and performance of hosted applications and services so that pinpointing the root cause of any service impact in real-time can become easier for the team operating the network. Efficient AI/ML techniques for accelerated RCI&A can lead to significant timeline reductions. 

    AI/ML Driving Operational Innovation and Market Agility

    In telco, there is great potential for AI/ML-driven use cases to further improve the cloud-native journey and enable an IT-like software life cycle management process for the solutions of the future.

    More broadly, highly automated and self-healing networks will drive higher levels of efficiency and customer satisfaction. This includes faster testing with less resources; more efficient utilization of network resources and cloud infrastructure; faster time-to-market with more software releases per year with similar capacity as well as an increased quality for faster and more agile monetization of the CSPs capabilities.

  • Oxeye Platform Helps Fix Code Vulnerabilities

    Oxeye Platform Helps Fix Code Vulnerabilities

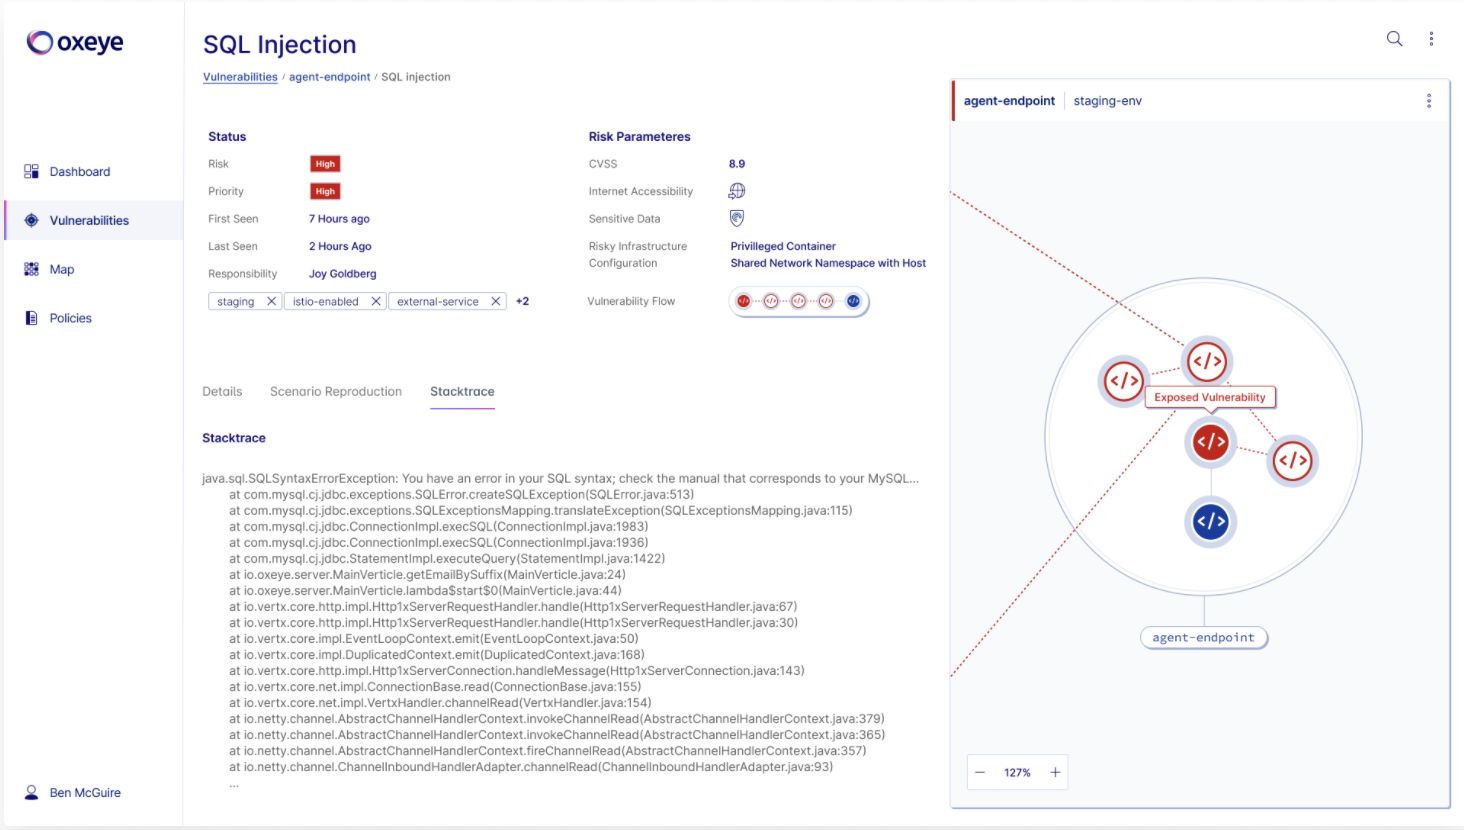
    Fresh from raising $5.3 million in seed funding, Oxeye emerged this week from stealth to launch a namesake application security testing platform that, in addition to pinpointing issues in code, also provides advice to best remediate the issues it found.

    The Oxeye platform requires developers to download an observer tool that scans code for vulnerabilities. Once pinpointed, the Oxeye platform guides developers through the remediation process without requiring them to inject agent software into every application.

    Oxeye CEO Dean Agron noted developers don’t typically have a lot of cybersecurity expertise. As application environments become more complex—thanks to the rise of microservices-based applications—it only becomes more likely that mistakes will be made. The only way to resolve security issues before applications are deployed in a production environment is to augment developers using a platform that finds vulnerabilities all the way down to specific lines of code, he said.

    In theory, responsibility for application security is being pushed further left toward developers as organizations embrace DevSecOps best practices. However, making developers more accountable for security without providing them the tools required to achieve that goal is not going to improve the overall state of application security.

    The challenge organizations face today is finding a way to empower developers to address security issues without slowing down the rate at which applications are built and deployed. The best way to achieve that goal is to give developers access to a security tool designed to both analyze code for vulnerabilities and explain how to avoid encountering that issue again, said Agron.

    Left unaddressed, the current software supply chain crises will only deepen, added Agron. According to International Data Corp. (IDC), more than 500 million digital applications and services will be developed and deployed using cloud-native platforms by 2023. That’s roughly equal to the total number of applications and services deployed over the last 40 years, according to IDC.

    It’s not clear to what degree the rise of digital applications might force the DevSecOps issue within more organizations. It’s is clear that a new generation of more complex applications based on microservices is being rolled out to drive a wide range of mission-critical applications. The more business value an application has the more attention it inevitably attracts from cybercriminals.

    Regardless of the type of application, it’s apparent that there is a pressing need for a way to better secure applications. The further left that process starts the less costly it becomes to achieve and maintain security. Cybersecurity teams have a vested interest in helping developers do the right security thing as early as possible if no other reason than to reduce the number of vulnerabilities they will inevitably discover later.

    Making developers more aware of security issues is, of course, only the first step. However, in the absence of any tools that can be easily incorporated within an application development workflow, the concerns being raised will amount to little more than yet another sermon that will be ignored as developers once again rush to meet yet another application delivery deadline.