Tag: metrics

  • DevOps by the Book in 2017: Where we Really Stand

    DevOps by the Book in 2017: Where we Really Stand

    Now that the year-end prediction season is over, it’s time to focus squarely on the actual here and now—where the DevOps movement actually stands at the start of 2017.

    As we’ll need to wait another six months or so for the annual State of DevOps Report to emerge from the good folks over at DORA and IT Revolution, which forces us to take stock of the situation using other resources. In this case, I’ll point to the recently released book, “DevOps for Digital Leaders,” authored by my colleague Aruna Ravichandran along with co-authors Kieran Taylor and Peter Waterhouse.

    Register today for the upcoming webcast, “Chart a Winning Course: DevOps for Digital Leaders,” and enter the chance to win a free signed copy of the book [U.S. only].

    Why should you value this book over any of the other DevOps-related titles inundating the technology literature scene, in particular those issued by (gasp!) technology vendors? I’d cite two very specific reasons: real-world metrics and use cases.

    I often preview any comments I make in cross-functional meetings with the phrase “shameless marketing.” That is because I work in marketing. For 12-plus years prior and sometimes in between marketing gigs I’ve served as a journalist, wherein my job was to attempt to be as objective as possible. Today, I work for a vendor that would really like to sell you stuff.

    That said, this current career path does not preclude me from being able to see beyond my own not-so-secret agenda. While many onlookers understandably groan and roll their eyes at the manner in which DevOps has been co-opted by marketers as a means to advance products, this doesn’t mean we’re all full of it.

    Like myself, working at CA—in particular, leading marketing efforts that span a huge array of strategic technologies actively being leveraged by global enterprises to attack various elements of DevOps—has given Aruna and her partners tremendous insight into where many people stand in terms of maturity.

    To that end, this book is written around some fantastic stories about how some of these organizations are refining best practices and measuring real success in domains including continuous testing, release automation and shift-left monitoring. IMHO, these are some of the hottest areas of DevOps being advanced as we speak.

    In addition to these use cases and related practices, the book takes an up-close look at critical aspects of the DevOps build, test, deploy and manage stages, along with key processes related to tuning and continuous improvement. And it even goes so far as to talk about essential DevOps tooling. I hope people are ready to acknowledge that beyond culture and leadership, automation absolutely plays a significant role in all of this.

    Specific to metrics, one of the areas where the State of DevOps peeps attempted to break new ground in the 2016 report, there’s a lot to appreciate. The book takes a close look at how these same organizations are attempting to tie DevOps-driven change directly to ROI, including the all-important customer experience.

    Worth noting, in the coming days we’ll also see the release of a new report from Coleman Parkes that charts numerous KPIs being used to this same end, so stay tuned.

    So there you have it, the marketer has officially hijacked this blog space to do little more than market a book about DevOps written by marketers. But, the truth is that’s not all.

    If you really want to hear the best parts of this story, sign up for the upcoming devopsy.kinsta.cloud webcast, “Chart a Winning Course: DevOps for Digital Leaders,” in which Aruna and Alan Shimel will discuss the high points, with an emphasis on fielding questions from the audience live Q&A style.

    If you don’t have time to read the book—or, better yet, you want a preview to ensure that what I’ve written here is true—post up and ask your own questions. We’ll also be conducting live polls about DevOps maturity, audience use cases and the leading types of DevOps metrics.

    It’s worth noting that all proceeds from the print edition will go to Foundation for Excellence, which provides STEM scholarships to children in India. Order your own copy today (or download it for free).

    — Matt Hines

  • Closing the Gap on Continuous Delivery Metrics that Matter

    Closing the Gap on Continuous Delivery Metrics that Matter

    Management guru Peter Drucker once said, “If you can’t measure it, you can’t improve it.” I would take a step back and say, If you can’t measure it, you can’t get it off the ground. Many companies that I work with are amid digital transformation initiatives, such as the adoption of DevOps and continuous delivery. For these initiatives to gain momentum and acceptance within their organizations, they must be able to demonstrate quick time to value or risk being sidelined. And then, these organizations must be able to actualize their transformations and improve their processes—both enabled by the right metrics.

    Indeed, one of the core pillars of DevOps culture—going all the way back to the first DevOpsDays event in 2010—is measurement. It is the M in the CAMS (Culture, Automation, Measurement, Sharing) acronym coined by Damon Edwards and John Willis.

    Glaring Gap in Continuous Delivery Metric Definitions

    Despite the prominent placement of measurement in the DevOps world, there is not really a lot of guidance about metrics in the common literature. For example, the original “Continuous Delivery” book by Jez Humble and David Farley devotes maybe a dozen pages out of 500 to it. And the recent “DevOps Handbook” by Gene Kim, et al is thin on the topic as well.

    The coverage gap around measurement and metrics is driven primarily by the fact that the DevOps space is new and there are few standards around which to build an easily documented metrics structure. That leaves practitioners with the challenge of creating something they can use pragmatically within their own organizations. Anyone building a system of measurement for their organization must have a reasonable understanding of metrics as a discipline and a good understanding of the processes they intend to measure.

    Back to Basics on Measurement

    There are two types of metrics that I discussed in a recent session at CA World ’16 that are important when measuring a complex enterprise process.

    • Result metrics are concerned with the cumulative outcome of a set of activities. For example, a company’s revenue or net income would be common, classic result metrics.
    • Performance metrics measure how well individual activities are working. These often are more difficult to define, as they can vary by businesses and teams and be obscured by silos.

    Performance and result metrics are very closely linked: Performance metrics measure the effectiveness of the activities that drive the result metrics. For example, measuring the average number of deals closed per salesperson per period would be one measure of the effectiveness of a sales organization (a performance metric) which, in turn, would be a factor in driving revenue (a result metric).

    While DevOps literature generally does not provide a lot of detail about metrics, it does provide advice on key result metrics. The primary one is lead time. Lead time is a powerful measurement that originated in Lean manufacturing. It originally dealt with how long it took a company to deliver a product to a customer after receiving an order. In DevOps terms, lead time summarizes the amount of time it takes to deliver one single change or feature from business idea through to running software in Production.

    Lead time is calculated by aggregating the work time (referred to as cycle time) on a change plus the time when the change is in progress, but not being worked on (referred to as wait time). The formula that LEAD TIME = CYCLE TIME + WAIT TIME is a powerful tool for understanding the result metric level; however, the challenge in most enterprises is figuring out a workable system of supporting performance metrics.

    Value Stream Mapping to Uncover Performance Metrics

    You’ll find that the result metrics part of the effort—calculating the lead time for an application change—is relatively straightforward even when corporate structures can obscure exactly when work (cycle time) is happening versus when things are waiting (wait time). The Lean manufacturing world provides techniques for analyzing a flow.

    A common technique is called value stream mapping (VSM). VSM provides guidance for breaking down a complex process into identifiable “steps” to provide measurement points throughout the process for cycle time and wait time. The measurement points then provide milestones for tracking the progress of the single change or feature from business idea through to production use.

    For example, in an enterprise application development situation, typical application delivery pipelines provide several logical points that can be used as steps for VSM. Using those points, it is simple to measure linear time through the process. The common logical measurement points are:

    • Assembly (aka Development): the time required to assemble a configuration package (code, database, infrastructure, and network) that the team declares as an instance of the application including the change
    • Time Spent at Each Pipeline Phase: the time spent in various QA environments, such as Integration, Functional, Performance, UAT, etc., and to finally put the configuration package into the Production environment.
    • Time Spent on Promotion Decisions: the time spent waiting for a decision to promote a given version of the configuration package to a higher environment or to reject it at the end of that validation phase.

    The performance metrics that determine how efficiently cycle time and wait time are utilized, however, are significantly less obvious. Software development is iterative by nature. That means that individual steps in the value stream will be repeated many times and the cycle and wait time metrics ultimately will obscure the quality of what is happening at the measurement points due to natural tendencies to aggregate and average the values.

    Performance Metrics for Continuous Delivery

    Establishing the performance metrics for a continuous delivery pipeline requires a bit of analysis. The performance metrics must be geared to understanding how to reduce the cycle time per repetition and the overall number of repetitions at each measurement point in the delivery pipeline. Here is a pragmatic, two-part pattern you can follow:

    The first part is to break down the iterative pieces of the pipeline into logical ‘mini’ value streams. For example, each QA environment must be provisioned, configured, have changes deployed, and then validation activities occur. Those steps can provide measurement points and, more interestingly, can be used symmetrically in all environments in the pipeline enabling questions such as, “Does one take a disproportionate amount of time relative to the others?”

    The second part is to look at the qualitative items that drive either long repetitions or increase the number of repetitions. For example, how many environments does a configuration package go through before rejection? More can actually be more expensive, slower and likely to be indicative of requirements problems, while fewer may indicate code quality problems. Another example might be smoke test failure rate in each environment. Variance in one environment could indicate problems in either the configuration management or deployment automation, but would require repetition of the deployment or manual correction. Finding that problem and fixing it ensures better cycle time at that step and stage, and serves to keep lead time down.

    End Game: Demonstrate Business Value

    It may be a very long time before the DevOps movement reaches consensus on a system of metrics. The variability in software environments and industry needs means that it is unlikely for one size to fit all. However, with a pragmatic approach and some lessons from the Lean manufacturing world, it is possible to produce a workable and effective system of metrics for continuous delivery pipelines in the enterprise.

    Vendors, such as my employer, CA Technologies, are helping by building more integrated systems of pipeline management tools to help shift from merely reporting metrics to applying them with modern analytics-driven techniques. The dividend of these approaches and tool improvements is that it is getting easier to gain a clear understanding of your process and to demonstrate to the business that the DevOps initiative is, in fact, worth the effort and investment.

    — Dan Zentgraf

  • Assembling the Key Components of Continuous Delivery

    Assembling the Key Components of Continuous Delivery

    As agile methodology was popularized at the start of last decade, engineering teams gained the opportunity to begin producing software in shorter cycles, while releasing it reliably at more frequent intervals.

    This concept garnered greater attention in 2009, when Tim Fitz published his thoughts on continuous deployment. By the time Jez Humble authored his seminal book, “Continuous Delivery: Reliable Software Releases through Build, Test, and Deployment Automation,” in 2010, the approach started to get significant mindshare. In the book, Humble advanced the three building blocks of continuous delivery: configuration management, continuous integration and continuous testing.

    Thereafter, Agile Operations—the practice of using end-to-end monitoring, fueled by analytics, to increase operational agility—appeared. This complemented continuous delivery, with the goal of increasing the quality and velocity of software delivery while minimizing overhead.

    Since then, and particularly over the last six years as DevOps adoption has exploded, there’s been significant discussion (and confusion) over the opportunity to embrace “continuous everything” across the software development life cycle (SDLC) to deliver functionality continuously and optimize end-user experience.

    Today, having spoken to hundreds of organizations employing agile and DevOps, it’s possible to expand on these concepts to better define the key components of continuous delivery.

    In this blog, I’ll detail the precepts of “CD” that CA’s customers recognize as critical in reducing the time, risk and expense of software delivery by frequently releasing smaller batches of code with extensive visibility and traceability.

    These building blocks of continuous delivery are:

    • Continuous development & integration,
    • Continuous testing. and
    • Continuous release.

    Continuous Development and Integration

    When it comes to delivering quality apps faster, every second counts.

    That’s why it’s important to automate the planning, development, unit testing and integration of code with different inter-dependent components, all while packaging it for quality assurance. We categorize these activities under continuous development and integration, as shown in Fig 1.

    This all starts with sprint planning and modeling of requirements in agile management software. Unit tests can be created automatically, based on requirements and use case stories. These unit tests then can be executed automatically based on pre-defined criterion, using automatically generated synthetic data.

    Fig 1: Continuous Development and Integration

    Next, virtual service interfaces can be generated automatically by simulating unavailable systems across the SDLC, allowing developers, testers, integration and performance monitoring teams to work in parallel—driving faster delivery, along with higher quality and reliability.

    The integrated code can be built and tested automatically against validation criterion, and upon passing, made available for continuous testing. This later phase, after code development and before QA, is also commonly referred to as continuous integration.

    Continuous Testing

    Continuous testing across app delivery not only enables enterprises to shift testing left, engaging it earlier in the SDLC, but it also helps them shift right, leveraging the same processes throughout staging and production.

    After the unit tests are passed and integrated builds are made available for QA, functional and performance tests can be completed—before the build is made available for staging and production. Various activities during continuous testing are shown in Fig 2.

    Before the functional and performance tests are performed, the build promotion criterion and configuration also need to be validated. Testers require provisioning of QA environments to deploy the build, along with virtual services and test data. Using test data management to create a subset of production data and mask sensitive information is another continuous testing requirement.

    Fig 2: Continuous Testing

    It’s also important to engage application performance monitoring in the QA environment before running automated tests, providing feedback about any problems back to developers.

    After the automated tests are executed and promotion criterion are met, the build is ready for deployment in staging or production environments.

    Continuous Release

    Continuous release matches release velocity to development velocity through controlled and scalable deployments.

    The goal of continuous release (sometimes referred to as continuous deployment) is to continually and automatically deploy the build into production; similar activities also can be performed in a staging environment.

    As shown in Fig 3, build configuration needs to be validated, with the production environment configuration updated before being sent to production. As with application code, configuration is also maintained in the version control system and can be automated for deployment.

    Fig 3: Continuous Release

    After the build is deployed into production, application monitoring should be initiated to track performance and customer experience. Feedback from the production environment can be passed back to developers to guide enhancements or sprint backlogs.

    This blog aims to outline core CD activities, and in subsequent articles I’ll provide additional details on entry and exit criterion, as well as metrics useful in tracking continuous development & integration, continuous testing and continuous release.

    In the meantime, check out, “DevOps for Digital Leaders: Reignite Business with a Modern DevOps-Enabled Software Factory,” a new book authored by my colleagues Aruna Ravichandran, Kieran Taylor and Pete Waterhouse.

    Based on learnings gained from numerous customers who have already embraced CD and DevOps, it highlights key practices for starting this journey, related ROI metrics and other useful tips.

    — Anand Akela

  • Webinar: Dashboards for DevOps: How Stratus Helps All Teams Monitor Metrics that Matter

    RECORDING

    [slideshare id=66578062&doc=webinarslides20160928-160929220050]

    — Jules Louis

  • Baselining Metrics to Measure DevOps ROI

    Baselining Metrics to Measure DevOps ROI

    Assessing the ROI of DevOps normally is done against a company’s baseline cost. The problem is, most organizations do not collect or evaluate the cost of “automating and delivering” innovation; they usually are more focused on the innovation product itself. As an example, if a company creates an application hosted on the web that offers its customers the ability to purchase inventory, the company usually is obsessed with knowing how that application performs: How many people are using it? How often does it fail due to bugs? How many sales are made? The company typically focuses on the end product—on the application as it touches customers and potential customers. The delivery process that precedes the application being loaded into production is not usually the subject of intense scrutiny. At least, most organizations are not evaluating the speed of delivery and process effectiveness of delivery prior to an embrace of DevOps methods and tools.

    This lack of scrutiny results in the lack of a baseline to compare against. Say, for example, a typical programmer (prior to DevOps) uses a mix of scripts, human intelligence and human verification to create and verify a build. Prior to DevOps, the goal is simply to create the build and get it out there to look at it, and decide what to do next. Most programmers are not obsessed with how efficient this entire process is; for them, it is a means to an end. So most programmers do not keep records of the average amount of time it takes to create the build from beginning to end. This is even more true of the deployment process. Once a build has been created (again prior to DevOps), getting it deployed to the target environment might involve a few different teams (depending on the class of test environment that is targeted). The process may involve email requests to other support teams or filling out a ticket to get it done. Once again, most organizations spend little time tracking this process from end to end; it is only ever a means to an end.

    If, in fact, an organization was watching closely how long it takes to get a build created and how long it takes to get a deployment completed, that organization would be running toward DevOps at full speed to see improvements it otherwise could not achieve. It is the things we do not measure that receive little attention—until they break. Once our deployment process has become so onerous or so complicated or so burdened with approvals required that nearly nothing gets deployed, then we begin to look at it. This creates a culture of “squeaky wheel syndrome,” which makes both our development and our operations teams focus only on reactionary issues, while proactive concerns die on the side of the road. There is no time to invent proactive improvements when you are constantly fighting the fires of something else that is seriously broken. This culture must also change if DevOps is to succeed broadly in your organization, so keep note of how far it may be infected in how you run things today.

    Preparing for Collection

    Given that most companies lack a real baseline to compare against in this area, realize that collecting one will take an investment itself. This baseline metrics collection cost is usually added to the cost of the investment in DevOps. It is a bit unfair, as you are effectively saying, the soap company will also have to bear the cost of determining how dirty we are before we invest in the soap that will clean us. The makers of soap tend to think you already have a sense of how dirty you are, or you would not be looking at buying soap in the first place. But without an accurate assessment of knowing the extent of the problems (in this case, the investment of time you spend today), you will never know the ROI of having made the improvement of DevOps (the after picture).

    Also, keep in mind that measuring anything manual is difficult. This sounds like a saying from Captain Obvious, but consider that manual work efforts require additional manual work efforts to capture them and record them in some kind of system. If, as an example, my typical programmer spends 15 minutes of every build doing human verification of the build, this amount of time is reflected nowhere. Hourly employees typically record how many hours they work per day, not what tasks they spent during the day. Even the employees who log work hours more discreetly tend to record only that they spent “x” amount of hours doing “development,” not what general task categories occurred within the heading “development.” So there are no electronic records out there that can be gathered automatically that will reflect the 15 minutes spent doing human verification of a generic build of an application. The only way to know this is a personal interview, followed by someone keying the data into a collection system of some sort.

    Knowing that the information you seek for a baseline will come in human interactions as well as some automated logs, start the collection using a tool that allows for maximum flexibility for those efforts. Spreadsheets come to mind. When the effort to collect a baseline begins, you will have some ideas about the kinds of data you wish to collect and how it might exist in your organization. But it is impossible to know exactly how the resulting efforts will be completed. In short, you don’t know what you don’t know. While you collect metrics you will invariably come across someone who reveals critical metrics-related information you were not “planning” to collect. But once the revelation is made, you will need to incorporate the “new” information to really provide an accurate baseline assessment.

    Determining the Baseline

    The next step is to begin the collection process itself. The critical data to examine usually can be gathered by looking at “human” time involved in a given core “process” of the automation and delivery of innovation, and then the “machine” time involved as well. For example, the time a programmer must spend prior to the launch of a build (not the coding time)—all the prep work doubling checking that the system is ready to launch the build scripts (or ready to manually push the buttons)—would be considered “human” time. The execution of the scripts to create the build would be considered “machine” time. Then, all the work done after the build is created to verify it and make sure things are as the programmer expected, again can be put into the “human” time category. DevOps will systemically automate both the pre- and post-time activities the “human” currently invests, so all that time will count in the ROI.

    The above example is good when one person has full control of a process from end to end. When other teams must get involved to complete a task, the “human” time begins to skyrocket. If, for example, a programmer or release manager, must get a request email (or ticket system equivalent) to deploy a particular build to a particular target environment, the entire life cycle of that ticket becomes part of the “human” time you need to track as your baseline metric. Even when shops create a two-day service level agreement (SLA) for turnaround, it still represents two days of delay (due to “process” time) in the life cycle of a deployment. The time “humans” actually spend reading requests, approving requests and routing requests is all time that DevOps will automate and eliminate. Finally, when the correct support team (usually Ops) pushes their own script buttons to do the deploy, that part of this process is once again “machine” time. As you can imagine, the end-to-end time of a given deployment can be days in the pre-DevOps methods and only minutes in the post-DevOps methods. Self-service deployments can reduce this time even farther, removing handoffs, reducing risks and delivering innovation at will.

    Further classification of this metric data can be useful as well. For example, you may wish to break down “machine” time into its relevant subcategories such as build script execution, deploy script execution, test script execution and release script execution. You also may want to break down the “human” time a bit further as well into pre-build/deploy verification, post-build/deploy verification and test script results evaluation. Finally, you may wish to break “process” time down further into request generation, request routing, request approval, request declination and request notification. DevOps will be able to give you discreet visibility into the time you saved in these subcategories, although since baselining is generally a one-and-done effort, you may not want to hunt this level of detail. It is down the road where this kind of subclassification becomes useful—for example when you are trying to determine if one set of tests runs faster than another or one cloud provider runs faster than another.

    Evaluating the Baseline

    Having gone through this exercise, a hidden or secondary benefit emerges. Your organization begins to understand much better what it has been investing in the current delivery of innovation processes. Generally, immediate areas of concern emerge and provide the DevOps services delivery with a road map for which areas to attack first to provide the company with the biggest bang for the buck. Without a baseline effort such as this in place, your DevOps services delivery plan will be based on anecdotal thinking or on executive mandate that may not be substantiated by the data on the floor. Having a baseline provides a road map for delivery based on concrete evidence on what should matter most to the business in making improvements. No one can argue with the numbers (assuming they were collected with care). The road map may reveal which applications in your organizations portfolio should be targeted first for DevOps.

    Also, your organization now understands much better “what” data in this process it sees as relevant to continue collecting even after DevOps is implemented. As DevOps is primarily an automation set of tools and methods, DevOps should be able to deliver these metrics in an ongoing basis. This allows continued metrics efforts to be automated without further human labor and can provide continuing proof of the value of DevOps to the organization, as over time the numbers continue to improve. Since the lion’s share of manual tasks disappear with DevOps in place, there should be no reason to have to manually collect metrics data as you move forward.

    Finally, having an automated metrics collection system put in place by DevOps, should lead to the next evolution in thinking: simulation. Well after the initial ROI for DevOps services has received the accolades it is due, an automated metrics collection system should provide all the raw data needed for some predictive analysis. Tweaking variables or process points or “machine” effectiveness should result in increased speed of delivery that can be measured (even before it is reality) based on the data you have been collecting systemically. Understanding the impacts of these changes is worth more than its weight in gold, because you can weed out the planned changes that simulation advises against before they even hit the road map, let alone occur in your world.

    Impacts to the Bottom Line

    There is already enough anecdotal evidence in existence to entice companies to embrace the DevOps journey. However, as your strategy begins to look to deepen down the stack from application code level to middleware, database and operating system, each layer could be assessed against a baseline to determine if your road map is sound and, more importantly, in the right order for your best ROI. This applies as well as you look to expand your DevOps journey laterally with additional services such as automated testing and evaluation, gated progression, automated provisioning, release orchestration, configuration management database (CMDB) integration, production provisioning on demand and monitoring integration. Each new service can be assessed against a baseline to determine if its ROI still meets the demands of your finance department and if your road map here is in the right order for biggest bang for the buck.

    The subtle win by performing baselining is the culture change it dispenses through your entire organization. Baseline metrics tell your development team and your operations teams (as well as the business units looking on) that you intend to measure performance and improve it systemically. Just because something was not examined before does not mean it will remain so, and a forest fire does not have to be the motivation to do so. DevOps is a proactive improvement to your delivery of automation. Collecting that baseline for your ROI, begins to seed the idea that proactive improvements are important to your executive teams. It is a demonstration of action over platitudes. It begins to eliminate the forest-fire responses in your employees, and creates a new forward thinking point of view. This cultural change is worth more to your company than any implementation of any one given tool or method, it goes back to changing how you think about delivering innovation in your individual job. That is what DevOps can do best.

    To continue the conversation, feel free to contact me …

  • It’s Time to End the Automated Tests Arms Race

    It’s Time to End the Automated Tests Arms Race

    I grew up during the end of the Cold War. During that time, I remember hearing that there were enough nuclear weapons to destroy the world 20 times over. That always seemed silly to me. Wasn’t once or twice plenty? Wasn’t it more important to have the fastest and most effective weapons rather than to simply have the most weapons? Before I could devise a satisfactory explanation, “Rocky IV” was released, successfully ending the Cold War.

    Number of Automated Tests:  The New Iron Curtain

    Now, 30 years later, I’m beginning to notice another arms race taking place. At a recent DevOps conference, I saw speaker after speaker boasting about the number of automated tests their respective shops were running daily. Again, I was confused. Those numbers provide no real information. What’s more important than the quantity of tests you are executing is the efficacy of those tests and the speed of execution. Why did no presenter have those numbers? It felt like Cold War braggadocio all over again.

    issues_arms-race_nuclear Why do I care? Shouldn’t I view the embracing of test automation as a good thing, regardless of the metric used to measure it? When creating a culture of automation, test counts do serve a purpose. First of all, It’s a simple metric. Just count the number of tests and dance in the self-exulting joy of your automation prowess. It also shows the power of automation compared to manual execution. So what’s the problem? The reason I care is this: Test-case count, while simple to gather and easy to understand, puts the focus on irrelevant data and ignores more critical information, similar to judging a military on number of weapons alone (yes, I’m forcing the analogy). Number of test cases executed daily isn’t just the wrong metric; it’s the wrong unit of measurement! Trying to determine a development shop’s test automation maturity by counting number of tests executed daily is like trying to determine how many gallons a good developer weighs. It’s just nonsensical data that doesn’t answer the important questions:

    • What percentage of your code base is covered by your automated tests? If you knew that your 5,000 tests only covered 15 percent of your code, would you still stand on a stage at a conference and boast?
    • How long do your tests take to run? If it takes all night to execute the suite, then you can kiss multiple releases a day goodbye.

    Using Proper Metrics, or the Strategic Defense Initiative

    So what are the automated metrics we need to worry about? I have a few favorites, in no particular order:

    • Test execution time: Speed matters. A decrease in testing time allows for an increase in number of test iterations, an increase in features per release, an increase in release frequency, etc.
    • Percentage of code covered: The tool you use to get this number doesn’t matter. The key thing is that you have a standard way to track this metric and whether you are trending upward. This trend gives you the next important metric …
    • Automation progress: How fast is the discipline growing? When are you projected to hit the point where all tests that can be automated have been automated?
    • Defect density: While this isn’t specific to automation, the trend in this metric helps show the benefit of automated testing. Bonus points for having a pre-automation baseline.
    • Number of automated test executions: WHAT? Hey, sometimes you have to parade the military through Red Square to put on a show of strength. This isn’t a bad metric when used in conjunction with the others. But it is not enough by itself!

    Keep on Rockin’ in the Free World

    By focusing on the above metrics and not solely on test execution counts, you will ensure you are moving in the right direction in terms of test automation. Similar to how Gorbachev moved the Soviet Union in the right direction with his policies of perestroika and glasnost. OK, OK. The analogy is officially dead.

  • State of DevOps Report: Reaping Results

    State of DevOps Report: Reaping Results

    The newly released 2016 State of DevOps Report concludes that DevOps is “no longer a mere fad or buzzword,” but rather an established set of practices and cultural patterns. Yet, a closer look at this year’s findings reveals progress is far more substantial than any matters of perception.

    The report was conducted and analyzed by the experts of DevOps Research and Assessment (DORA) and sponsored by CA Technologies. Among its findings is proof that high-performing organizations that have embraced agile and DevOps methodologies deeply are outperforming massively those that have not. And the gap is widening.

    The State of DevOps Report also shows leading DevOps practitioners are appreciating benefits that span nearly every area of their business. If I know my colleague Gene Kim, he will assert this point exuberantly on our upcoming State of DevOps Report Webcast.

    It’s noteworthy that high performers are surpassing incredible milestones related to core elements of the applications life cycle. Examples include deploying code 200 times more frequently than low performers, driving 2,555 times faster lead times, 24 times faster recovery times and producing three times lower change failure rates. This is evidence that DevOps is having the desired outcome on applications delivery, software quality and organizational velocity. It also shows organizations truly committed to wholesale transformation of culture and process are actively succeeding.

    At the same time, the State of DevOps Report shows employees working at organizations enjoying this success are more satisfied with their jobs and more closely engaged with their companies. Chalk this up to the halo effect of operating in a fundamentally more sensible, innovative fashion. Cultural change is undoubtedly the greatest hurdle to DevOps advancement. Here’s proof that if you can navigate the process, your workers will be happier and more productive.

    Using Employee Net Promoter Score (eNPS) as a barometer, the report finds that employees in high-performing organizations were 2.2 times more likely to recommend their organization as a great place to work. They also were 1.8 times more likely to recommend their team as a great working environment. Previous studies have found that such an air of positivity can be directly correlated with improved business outcomes, researchers noted.

    Shifting the manner in which you build applications to better adapt to changing customer expectations is a necessity. That’s what began driving this movement years ago. That said, proof it also makes it easier to keep valued software engineering and IT operations employees should not be overlooked.

    In addition to positive conclusions on the impact of continuous delivery and improvement of test data management, the report offers some important metrics related to return on investment. This is nothing short of landmark, as for decades we have struggled to make a hard case for IT investment beyond implied competitive advantage. It actually was impressive that last year’s report highlighted such a “predictive relationship between IT performance and organizational performance.”

    One such new measurement of note is that high-performing teams occupy the least amount of time responding to unplanned work and rework—efforts widely recognized to be results of flawed processes. On a related note, DevOps leaders spend 49 percent of their time on new work‚ surely, in many cases, the next “must-have” feature which impacts competitive standing and, ultimately, the bottom line.

    This report is fantastic. It reaffirms powerfully that so many of the promises made about DevOps over the last few years are neither hype, nor overstated. The gap between the leaders and laggards is growing. Industry landscapes and business models are being redefined.

    This is critical transformational work that every organization must adopt to survive.

    Are you on board? Download the full State of DevOps Report here.

  • CloudHealth Partners with Datadog, Connecting Cloud Performance Metrics to Cloud Costs for Enterprise and Fast-Growing Technology Companies

    The New Integration Enables Customers to Rightsize Complex Cloud Environments

    BOSTON–(BUSINESS WIRE)–CloudHealth Technologies, the leader in Cloud Service Management, today announced an integration partnership with Datadog, the leading monitoring service for dynamic cloud applications. The integration of the CloudHealth and Datadog platforms offers customers end-to-end visibility across every dimension of their cloud environments, giving them recommendations and analysis to make analytically driven rightsizing decisions in the cloud.

    While the decentralized management and dynamic provisioning of cloud resources greatly improves application development agility, it creates new challenges for organizations, related to cost allocation, infrastructure rightsizing and governance. The CloudHealth-Datadog partnership addresses the major challenge enterprises face as they embrace agile processes and cloud-based infrastructures: an inability to effectively manage cloud resources at scale.

    Datadog provides a SaaS platform that monitors data across the entire infrastructure stack and presents that data in elegant and easy to understand dashboards, allowing for actionable insight. The CloudHealth platform simplifies cloud management, enabling enterprises to consolidate, evaluate, analyze, optimize and automate their clouds.

    By connecting cloud metrics to costs, the integrated platforms allow customers to manage assets in a more strategic and holistic fashion. CloudHealth Technologies and Datadog bring together granular performance data, end-to-end visibility and powerful analytics to help customers continually make the best decisions about provisioning and rightsizing in the cloud. The CloudHealth-Datadog partnership provides customers with the following benefits:

    • Rightsizing analysis: Customers can use data from both solutions to receive recommendations about where to adjust resources that are over- or under-provisioned, saving them time and money.
    • Visualization of key assets: Using CloudHealth, customers can zero in on the cloud data they care about – looking by department, line of business, or any relevant Perspective. Using Datadog tags, they can get a centralized view of all their assets in one place alongside other tools and services.
    • Advanced performance metrics per asset: Customers can maneuver between the tools to really understand their environments. They can jump into CloudHealth to track trends or scan through performance data or jump over to the Datadog console to explore individual assets in more detail.

    “To optimize your cloud resources, you need to have tools that help you visualize your data, understand it and act on it,” said Joe Kinsella, CTO and founder of CloudHealth Technologies. “Putting Datadog’s best-in-class cloud monitoring assets together with CloudHealth’s Cloud Service Management capabilities gives customers the ability to truly solve the issue of cloud complexity.”

    “The cloud cost allocation and optimization is a significant challenge for many of our enterprise customers who spin up tens of thousands of cloud instances across various business units,” said Amit Agarwal, Chief Product Officer at Datadog. “We look forward to partnering with CloudHealth to provide customers who use both products a solution that helps customers quickly allocate and minimize costs, while ensuring that their critical applications are adequately provisioned at all times.”

    Many joint customers are already using CloudHealth and Datadog together, including Elastera, a provider of managed cloud hosting environments for ecommerce sites. The company moved to the cloud to innovate and get to market faster and adopted CloudHealth and Datadog to get accurate rightsizing recommendations for its AWS infrastructure.

    “CloudHealth takes information collected from Datadog and connects the metrics to the money. It shows us if an instance is under-utilized and how much we could save by making a change,” said Zachary Stevens, co-founder and chief architect, Elastera. “Using this powerful set of data analytics, we are able to downgrade over-provisioned assets, saving us time and money.”

    About CloudHealth Technologies
    CloudHealth Technologies gives organizations a new, more efficient way to visualize, optimize, and automate their cloud environments. The CloudHealth Cloud Service Management platform integrates with services across the datacenter and cloud, giving enterprises, startups, and service providers access to a centralized hub of robust data analytics. Using a policy-driven approach aligned to business processes, customers leverage CloudHealth to drive cost savings, improve agility, enhance security, and reduce complexity. With CloudHealth, customers are able to innovate faster without sacrificing governance or control.

    The world’s cutting-edge companies rely on CloudHealth to meet their cloud management needs, including Amtrak, Dow Jones, Acquia, and Sumo Logic, among others. Based in Boston, MA, the company is backed by Sapphire Ventures, Scale Venture Partners, .406 Ventures and Sigma Prime Ventures. For more information, visit www.cloudhealthtech.com or follow us on Twitter @cloudhealthtech and LinkedIn.

    About Datadog
    Datadog is the world’s leading monitoring service for cloud-scale applications, bringing together data from servers, databases, tools and services to present a unified view of your entire stack. These capabilities are provided on a SaaS-based data analytics platform that enables Dev and Ops teams to work collaboratively to avoid downtime, resolve performance problems, and ensure that development and deployment cycles finish on time. Since launching in 2010, Datadog has been adopted by thousands of enterprises, including Twilio, Airbnb, Netflix, EA, Spotify, Warner Bros. Games and AdRoll.

    Learn more about the integration on the CloudHealth Tech blog and the Datadog blog!

  • Embedding Predictive Analytics

    Embedding Predictive Analytics

    For an enterprise with a deep DevOps maturity model, the initial “wow” factor of automation has worn off. At this point, the sexier concepts involve proving continuous improvement. As an example, our first baseline of metrics might have taken the pre-DevOps timings of a typical build and deployment of a given application. We can measure this time against our post-implementation of DevOps automation and show a significant savings in time. This is opportunity time, meaning an employee must be ready to turn around the decision cycle faster to take advantage of the time saved (not be playing solitaire, for example). But once DevOps automation is old hat, the difference between our initial post-DevOps typical build and deployment time and our current one still using DevOps may not be all that significant. But is there more hidden there than meets the eye?

    Establishing Context & Baselines

    At this point context may be a more meaningful measurement. As an example, if my first version of DevOps automation for a deployment contained 35 steps and my current one contains 160 steps it would stand to reason I am “doing more” now in my deployments than I used to do. These additional steps may involve executing more tests than I originally thought to do. They may be interacting with monitoring systems (turning them on and off as appropriate), which reduces “noise” in the alerts my monitoring teams have to respond to. In short, over time, my deployment processes may become “longer” because I am increasing the capabilities or the sophistication of what I do during these deployments. While from a pure timing perspective this may make them longer, it also makes them more powerful and, so, is worth measuring. To know the delta, however, I must have retained older versions of automation to compare against, not just throw away the old every time I update with new steps.

    So let us assume the context of my automation is now fairly stable. I do the same things, more or less, the same way every time I deploy my application. At this point, measuring the functionality of what I do becomes more meaningful. As an example, my deployment automation may complete four main functional tasks to complete, I deploy the code (the app), I deploy the dataset, I deploy the config files and, finally, I run a series of tests on the above. While I may not ever incorporate too many new kinds of things to do in this automation, understanding how long each function takes to complete is relevant to proving continuous improvement. For instance, if my code takes roughly the same amount of time each deployment, as does my config files, but all of the sudden my dataset begins to grow in each deployment (from normal usage), my overall deployments may be getting slower. This is not due to hardware inefficiency or network inefficiency; it is simply due to a larger dataset that keeps growing.

    If on the other hand, it is my test set that is getting progressively longer to execute, that is an indicator of test script inefficiency (given same code, same config and same dataset). If the number of tests being executed has not increased, but the length of time it takes to run them has, there likely is inefficiency in “how” the testing is being constructed or executed. Understanding the context for what is going on in a deployment or similar kinds of automation must occur before introducing predictive analytics can occur.

    Historical Trends Extended

    Predictively evaluating automation is nothing more than taking the data from a historical perspective and extending the trend lines into the immediate future. If for example, my deployment automation is getting four seconds longer each month for the last 12 months, I can reasonably infer the trend will continue, and I can predict the length of time it takes to execute a deployment in the coming months. Understanding “why” this occurs requires a contextual investigation, but predicting its occurrence does not. This may seem inconsequential as we talk about the length of deployment processes of a given app, particularly if my portfolio of apps is small. But if the trend holds true for a portfolio of thousands of applications, the impacts become more consequential. Or if the phenomenon is directly connected to a particular cloud provider and not seen elsewhere, again, the consequences become meaningful.

    Where having “ground-up” predictive analytics (build and/or deployment automation) becomes much more useful is in the construction of release events. Often, release managers are asked to supply an estimated time duration for a given event to factor into the construction of a new release. If a vendor were to integrate more predictive analytical tooling into the release orchestration (RO) toolsets, “random” or “best guess” timing estimates could be replaced by extending historical data into the timing estimation fields. The RO tooling could provide a default timing estimation based on examining historical trends for a period defined by the user. Estimation defaults could always be replaced by a user (assuming discreet knowledge of other impacting events), but at least the new overall lengths of releases then could become significantly more accurate.

    This has special significance for manual tasks. Let’s say our database admin team traditionally takes 40 minutes to perform a given release event update, but now is running significantly longer than that. Having the RO software aware of the historical trends could alert the release manager, as well as the database team manager, during the event to check out why this is occurring. For manual tasks in particular it may be hard for anyone besides a predictive analytics module to determine what timings “should” be, as compared with what they are in a given release.

    Impacts to the Bottom Line 

    The real questions are, Why should a customer care about this kind of feature set? Why should we be looking at the vendors of our tooling to incorporate forward-thinking architectures such as predictive analytics into the tooling they sell us? Because the efficiency it can bring to our DevOps set of services lowers the costs of administration and increases the speed at which we can deliver innovation in general. Over time, trending combined with context can statistically prove continuous improvement of our DevOps services, which is the promise we made to the executive teams that sponsored and made the investment in DevOps to begin with.

    Metrics analysis can occur (usually with a dedicated investment on our part) without a predictive view of the impacts. But this changes the perspective of our analysis to hindsight thinking instead of forward thinking. In essence, we then are simply “reacting” to what has occurred instead of tailoring our environment to alter the picture of future predicted events to be better than the software predicts it to be. We start tweaking the variables to instantly impact future predictions, instead of only examining them in a post mortem.

    This perspective is yet another cultural catalyst for change your business needs. When I talk about changing how an organization “thinks” about innovation, this is one of the key objectives. We take an enterprise from knowing little about the costs of innovation, to having an extensive knowledge, to having a forward view of what is—or what should be, possible. All of this is possible despite the loss of waterfall controls and in the midst of an agile construction model. All it takes is the integration of forward-thinking architectures into the products we select. If our vendor does not offer them, we begin to enlighten our vendors on the value they would bring to us in cost reduction and to them in market capture. If you need help in these areas, feel free to contact me, I am looking at the moment 🙂 .

    To continue the conversation, feel free to contact me.

  • DevOps: Metrics Do Matter

    DevOps: Metrics Do Matter

    One of my favorite quotes about metrics or KPIs is from Jim Fowler, CIO of GE Capital: “Don’t measure me on cost or traditional IT metrics, but on the metrics of the business.”

    It’s a perfect tee-up for me to talk about metrics in the context of DevOps.

    DevOps is the movement of enabling a business via technology or the ability to look at business processes and issues to mitigate them or achieve a goal.

    The Importance of Metrics

    DevOps has as one if its five major principles the concept of measuring (CLAMS: culture, lean, automation, measurement and sharing). DevOps helps the business understand how it uses and benefits from its second major resource after people: technology. This is where key performance indicators (KPIs) come in, though hopefully not KPIs such as this:

    a

    This specific KPI was created to show the productivity of developers, using lines of code written as the measure. Could you use or explain this? It’s a great example of metrics or KPIs that are based on bygone times of being complicated, disconnected from business goals, or driving the wrong behaviors by placing quantity ahead of quality.

    Catch the Ball

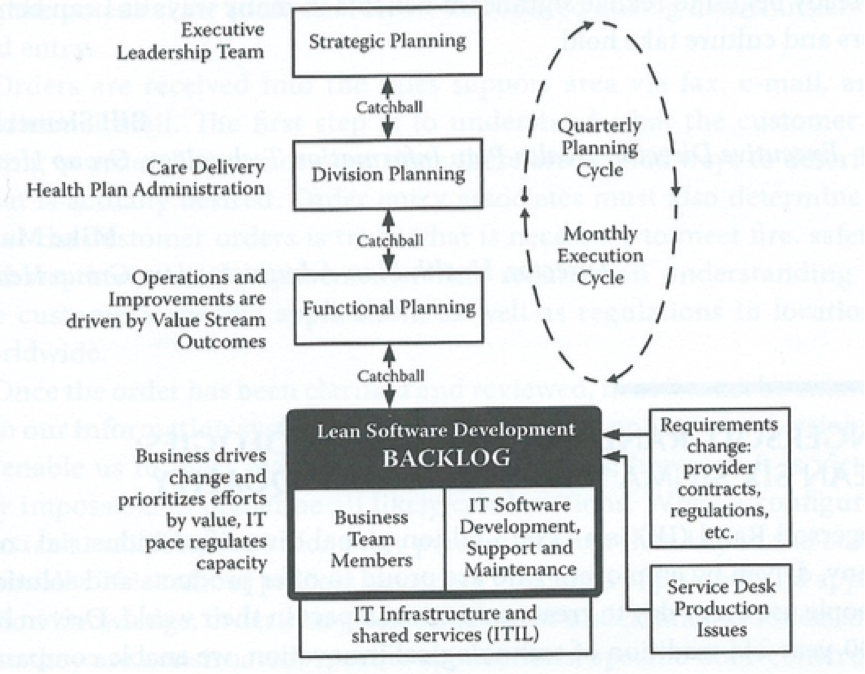
    DevOps enables everyone to work together toward a common goal. The DevOps lifecycle approach of creating a strategy, figuring out how to do it, introducing those steps, checking the results and, via feedback (people or tools), improving that strategy or product aids in improving the use and proving the benefit of IT.

    DevOps can use a trick from lean (Hoshin Kanri), where the strategy from senior management is passed down to each level (“catchball”) such that each team can create its own way of supporting that strategy. Hoshin Kanri allows every person to set their own way of working to meet the goal. How DevOps is that?

    b

    By permission Steve Bell: LeanIT @All rights reserved worldwide

    KPIs should be designed to help answer these questions:

    • Did we improve or decline?
    • Are we on course?
    • Does the impact effect our organization?
    • Do we need help?

    KPIs provoke a Yes/No response and force an immediate action/decision. If not, they are simply metrics that probably support a KPI but do not key to help fulfill a strategy or request.

    How Do You Create a KPI?

    First, look at a business target. Can you see what’s required to help achieve the goal or remove the obstacle to achieving the goal? Then could you determine how you would know this was happening and whether you could you prove it? All answers have to be Yes/No.

    I like making a tree, which also acts as a dashboard to quickly show at the various levels the indicators of performance and their status.

    c

    This helps make KPIs such as Cost of Delay, Mean Time between Repair, Defects2Incidents and others relevant to the right people at the right time. You could even be brave and flash the status using red and green: Red = we have a problem and need help to overcome or improve and green = all ok. Don’t hide behind amber—see how using just two colors helps guide easier, faster, better and safer.

    KPIs should be collaboration and communication tools. Create and use them wisely to keep your organization in business and on course.

    About the Author/Daniel Breston

    dDaniel Breston is the Chief of DevOps Transformation for Ranger4. Daniel has 30+years leading IT Service, Operations, Applications, Data Center and service partners in management of technology enabling business processes and functions. He has also spent 15 years of consulting and coaching leadership teams across the EU and UK in developing their people, processes and use of technology to deliver technology services better, faster, safer. Daniel has qualifications in IT Service Management (ITIL, COBIT,etc.), Lean and DevOPS.