Tag: metrics

  • The Good, The Bad and The Testable: How to Give Your Experiment the Best Foundation

    The Good, The Bad and The Testable: How to Give Your Experiment the Best Foundation

    Whether you’re constructing a house, a new business or a mobile app, a solid foundation is critical. It gives you a strong base from which to build, and it can have massive implications on the life of your project further down the road. The same goes for the experimentation process.

    Before ever beginning a software experiment, it’s important to create a strong foundation by investing time in the experimental-design phase. A well designed experiment will have a clear and testable hypothesis, a set run time calculated via a power analysis and a predetermined plan for the analysis stage. Two key components of planning the analysis are deciding which metrics you’ll be measuring and which statistical test you will use to determine whether or not any changes were statistically significant. Unfortunately, this is easier said than done, and with the wrong statistical test or metric, your experiment is destined to crumble.

    How Do You Spot a Bad Metric or Wrong Test?

    Oftentimes, people don’t realize they’re using a bad metric or a wrong test. Of the two, a bad metric is easier to spot. First, ask yourself, “What does it mean if this metric increases?” With that answer, you should be able to easily explain whether it is a good or bad result and/or which aspect of user behavior or product performance has changed and in what way. If there are multiple different ways to interpret a change to your metric, then it is probably not a good one to use.

    Determining if you’re using the wrong statistical test is harder. There are many different types of tests that are appropriate in different scenarios. For example, whilst a chi-squared test may be appropriate for a proportions metric (e.g. percentage of unique users who convert), this test would not give accurate results if applied to a non-proportions metric such as page load time. Instead, for means, or real-valued, a t-test is often the correct one to apply to your results.

    The most important thing to keep in mind is that the metric should satisfy all the assumptions of the test you are applying to it. For example, both the t-test and the chi-squared test assume the observations are independent and the noise in the data is normally distributed. One way to check this is with AA tests, an experiment where there is no difference at all between the two treatments. If you run a series of AA tests applying your statistical test to the metric, the p-values should be uniformly distributed, and the fraction of the AA tests which appear statistically significant should be roughly equal to your false positive rate, e.g. 5% if using a p-value threshold of 0.05.

    Consequences of a Bad Metric or Wrong Test

    Without the right metrics and test, your experiment is bound to run into trouble. Specifically, using a bad metric can make it very difficult to interpret the results of your experiment, or in the worst cases, it can lead you to unknowingly draw incorrect conclusions. It can mean you are not receiving as much value and learnings out of an experiment as you could have.

    Similarly, using a statistical test which is not appropriate for the metric you’re applying it to can also cause you to draw incorrect conclusions. In this case, it can lead to a much higher false positive rate than you intended when you set the significance level. This can leave you thinking your experiment has had an impact, while it’s just normal noise in the data.

    What Is a Good Metric?

    Ideally, a good metric will be interpretable, meaningful, sensitive and fit for the statistical test you’re applying to it. Interpretable means if the metric changes, you should easily be able to determine if it will have a positive impact or negative impact and what that means in terms of user behavior or system performance. A meaningful metric directly measures something which you care about in your experiment. This could be something that’s a good proxy for business value or customer satisfaction. Sensitive metrics are able to detect smaller changes for a given size of traffic. For example, slow moving metrics such as retention or high variance metrics such as revenue, whilst being important metrics, are not inherently sensitive and hence might not be the best choice for your experiment’s primary metric.

    Finally, fit for the test means the metric should satisfy all the assumptions of the statistical test you will use as previously mentioned. For example, metrics where the denominator is not equal to the randomization unit⎯e.g. per-session metrics when you are randomizing on users⎯would not give independent observations and hence are not fit for use in a standard statistical test such as a t-test or chi-squared test.

    Benefits of a Good Metric

    A good metric is crucial to any successful experiment. It allows you to get the most information and learnings out of an experiment, and it makes experiments easier to interpret as well as more efficient to run. Using a good metric and appropriate test will also avoid the chances of inflated false positive rates and getting misled by the data, which provides the biggest benefit of all: saving time and money.

    — Lizzie Eardley

  • Value Stream Optimization: Putting Business in the Driver’s Seat

    Value Stream Optimization: Putting Business in the Driver’s Seat

    How value stream can be a major driver of DevOps success in today’s software-only world

    Even as DevOps reaches a pinnacle in acceptance (as of 2018, only three percent of firms had not adopted DevOps and had no plans to do so), many organizations are still struggling to get high-quality software out the door. DevOps has been promoted by many experts and consultants as a solution to the cumbersome inefficiencies that were common with waterfall methods. However, as is common for many operational activities, applying a new approach or technology doesn’t automatically resolve entrenched problems.

    Nowhere is this more obvious than in value stream management (VSM). This approach, which focuses on removing the waste from processes to increase their efficiency, sounds like a panacea for resolving software delivery challenges. In practice, it often falls short of its goals.

    Why is this? There is nothing wrong with the concept of the value stream. The idea of breaking down a complex process into its components and optimizing each one of them, thereby optimizing the chain, is a long-recognized pillar of lean production. In my view, the problem isn’t with VSM or even DevOps.

    The problem is that in moving from waterfall to DevOps and/or agile, many organizations figuratively “throw the baby out with the bathwater.” They are uncertain how to adjust for the extreme acceleration that occurs when teams move from rudimentary software processes to modern ones, so they either jettison important elements of software engineering or adapt them incompletely.

    Why Continuity Matters

    By way of example, consider measurements and metrics. The traceability and proactive remediation enabled by measurements and metrics are two of the most important aspects of software development. However, it’s not just the development and test metrics that matter, but also the business metrics—metrics of quality, user acceptance, security and ease of use. Since the dawn of software development, those two groups of data have been inextricably linked, but some modern software teams appear to have forgotten that lesson.

    No amount of process improvement metrics can ensure a software release is secure or that users will like it. Yet, if a major software upgrade is flubbed, it can impact operations so negatively that sales momentum stalls. (If the company sells the software it develops, the ripple effect is even stronger.) Even more disconcerting, after a major data breach, a firm can find itself out of business.

    Don’t get me wrong. I am not suggesting that flow and other DevOps metrics don’t matter, because they do—very much. I am suggesting that many teams and their development managers have become too divorced from the business metrics, which can have staggering negative consequences.

    From There to Here

    In the days of waterfall, development artifacts, defects and other data were warehoused in an offsite location, and after each release (which might take days, weeks or even months), teams would engage in several days of data extraction. Then, a separate team would attempt to map the development artifacts to the defects and enable traceability. After hours or days of organization and cross-mapping in Excel spreadsheets, reports would be generated for management and the C-suite. Once stakeholders and management completed their evaluation, the team would be cleared to make adjustments before the next release cycle.

    Now, our development paradigm has changed so dramatically that many teams aren’t giving metrics their due. That’s an issue with defect metrics that could impact the user experience or software reliability. It’s a serious, potentially game-ending problem when the metrics are related to security.

    Completing the Value Stream

    To create and administer the complete value stream, software teams must be supported in three areas beyond the traditional DevOps framework where iterative development activities are the primary driver of traceability measurements. With these elements in place, management can map their software teams’ efforts to the business metrics that are the final measurement of success:

    • Organizations must have a mechanism for integrating development and testing tools so that defect measurements can flow back to the development team in real-time—matching the speed of DevOps.
    • Critical software activities that still take place outside of development and testing processes, such as generation and approval of change orders, must also be monitored for inertia, with approvers being held accountable for holding up paperwork that delays releases.
    • Security defects must be given parity with, and preferably priority over, all other code defects. All defects that impact the user side, such as functionality and launch speed, are important business metrics. But security must be paramount.

    If you are a development team member reading this, or even a development manager, you may think business metrics and the related activities that happen outside your purview, don’t apply to you. I urge you to think again. Software has become a critical pillar of many companies’ operational success, and that connection is only growing stronger by the day. Everyone involved in software development, from the developer to the VP of Operations and on to the CEO, must view the entire process through the lens of business.

    — Joe Schulz

  • Implementing DevOps? Start with a Strategy

    Implementing DevOps? Start with a Strategy

    Organizations today are focused on improving the IT delivery process and taking it to the next level. DevOps plays a key role in achieving this goal, if it’s done right. But while the concept of DevOps is not new—it’s more than a decade old—a significant percentage of organizations have not yet implemented or are facing challenges in leveraging DevOps to achieve the intended benefits. Why do some companies achieve success with their DevOps implementation and others struggle? Simple: Those making DevOps work for them started their journey with a clear and implementable strategy. In fact, a number of organizations have formed their business strategy around DevOps.

    The relationship between DevOps and agile is complementary; however, DevOps implementation must be looked at differently than agile. It needs to be treated as a separate initiative other than the regular IT delivery scope until it’s established. It requires strategic thinking, significant focus and commitment make it successful.

    Key Pillars of DevOps Strategy

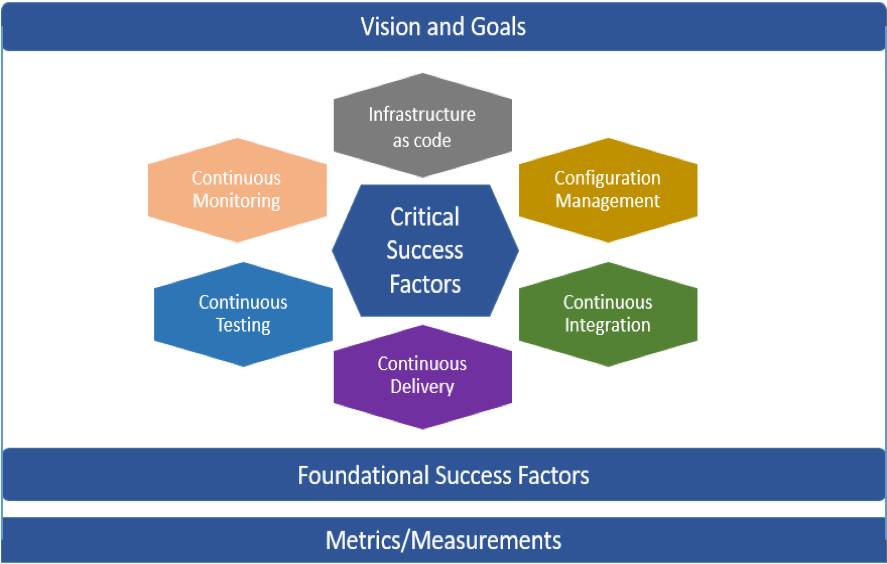
    The four key pillars for DevOps strategy are:

    • Identifying the vision and goals.
    • Identifying foundational factors.
    • Critical success factors.
    • Basing the strategy on measurements to track the progress and realization of benefits.

    Vision and Goals

    Drivers and challenges form the basis for vision and goals. Before embarking on the path to DevOps, it is crucial to analyze the “as-is” situation and understand the current challenges and drivers for doing DevOps. Current challenges could include:

    • Too many production defects.
    • Business stakeholders demanding features that the team is unable to deliver.
    • Painful deployments.
    • Team burnout and frustration.
    • Deployments done as ceremonies with multiple teams on call.

    If any of these sound familiar, that’s a sure sign your project needs DevOps.

    Drivers for creating the vision and goals may be external or internal. External drivers may be improving customer satisfaction by meeting expectations around availability, reliability, usability, performance, features, value and time to market. Internal drivers may be improving operational efficiency (speed, throughput, quality) or improving employee loyalty, improving technical capabilities or simply making deployments less painful.

    Critical Success Factors

    Below are the key factors in implementing the DevOps pipeline which includes continuous integration, continuous delivery and deployment. The continuous integration aspects cover configuration management, code packaging, branch/trunk implementation, static code quality analysis, code reviews and static security scans. The objective of continuous delivery and deployment is to move the code from the lower environment to the production environment in an automated way. The key aspects as part of the continuous delivery are embedding continuous testing within the pipeline and automating the applicable tests—unit testing, system testing, API testing and/or browser testing, along with the non-functional testing (performance and security). Another key aspect is integrating continuous monitoring into the pipeline—infrastructure monitoring (application and database servers) and application end user monitoring, which provides key input and metrics on how users are using the application and can be leveraged to improve customer experience.

    Key pillars of DevOps strategy

    Foundational Success Factors

    Foundational factors are critical for DevOps to be successful in an organization. Before embarking on the journey, ensure foundational factors are in place, such as management buy-in and support, maturity of the current agile process, conducive culture, collaboration among teams, CI/CD tools and availability of technical skill sets.

    It can be difficult for agile project teams to focus on working on the DevOps items along with the sprint-specific “functional” requirements. One way to increase the priority is to include the DevOps-related items in the sprint. That said, it can be challenging to focus and achieve DevOps objectives, as they may take a back seat to functional requirements during the sprint. Another option is to form a DevOps-focused group from within the projects (based on technical skills and inclination for innovation) that is assigned with the task of building and implementing a CI/CD pipeline. If necessary, this group can get help or expertise through suppliers. Forming a DevOps-focused group has been shown to be helpful in terms of achieving DevOps objectives.

    Metrics: Identify, Measure and Continuous Improvement

    Tom DeMarco famously said, “You can’t control what you can’t measure.” In DevOps, metrics and measurement are critical for success, as implementations take time. Metrics, therefore, should be aligned with goals and vision to track progress. Also critical are identifying the effectiveness of the identified metrics and making any revisions to existing metrics, as well as identifying and adopting additional elements for success.

    It is helpful to quantify the “as is” situation at the start of the implementation by measuring the metrics. That allows you to see the kind of progress being made on each of the aspects as you go along.

    The metrics can be categorized as per the balanced score card perspectives:

    • Financial (e.g. cost savings).
    • Customer perspective (e.g. time to market, number of defects per deployments).
    • Internal perspective (e.g. average deployments per sprint, number of successful deployments, average time per deployment, mean time to repair).
    • Innovation perspective (e.g. number of enhancements to pipeline).

    Though there are multiple DevOps aspects that can be measured, it is better to start small to avoid being bogged down by measurements. For example, you can start by capturing the average time per deployment or time to market and add other metrics as you go along.

    Conclusion

    DevOps is a critical initiative and focus area for organizations today. To be successful, a DevOps strategy—a top-down approach which provides clarity and transparency within the organization—is necessary. The key pillars of DevOps strategy can help lay the foundation and prepare—and keep—organizations on track during their DevOps journey. The strategy can be part of the project plan for a single project or can be leveraged for scaling out a DevOps initiative throughout the enterprise.

    — Girish Kulkarni

  • Logging: Turning Good DevOps Teams into Great Ones

    Logging: Turning Good DevOps Teams into Great Ones

    The competition is on for DevOps teams that are expected to rev up production on a multitude of projects, with teams and companies aiming to stay atop the global software product marketplace. The complexity of code creation and the pace of deployment has picked up in recent years, and DevOps managers are starting to face serious challenges of scale and efficiency.

    Constant code generation is the first obstacle. Imagine a team producing millions of lines of code, working for weeks and hoping for a smooth release. But testing time arrives, and there is a total data meltdown.

    Wasting valuable programming hours is not an option, but what if managers had the tool to turn back the time to a version before the mistake happened? Managers or developers may view logging as an incredibly boring activity, but it is vital. It serves like a black box of what went wrong—but also a way to roll back the bad code, and return to a more manageable situation.

    Logging and tracking habits ensure that a DevOps team will not see their code fail in production, and cause expensive breakdowns in service. Logging becomes more than a wishful addition, but a pivotal tool that may save a project.

    Data is proliferating, code is constantly being written to offer innovative products or support existing ones. There is a massive amount of data projected to be generated in 2025, only a few short years away, if the global IT production sector keeps increasing its activity. This amount of data to be kept and logged would be roughly 10 times higher compared to the data generated in 2016. This issue has plagued Silicon Valley, but also worldwide tech centers: how to keep track of what is going on. How do companies such as Instacart, Lime and OpenAI track their changes and ensure viability and awareness of errors?

    There is the new role for DevOps managers: ensure fast, modern and stringent log management. Dedication to logging means generating tight order out of the chaos of code creation. The right tool will be economical, intuitive and fast, ensuring the possibility for control in what could become a runaway data meltdown.

    Logging is one of the pillars in the modern DevOps department, and while now it is important, it will become indispensable, along with metrics and analytics.

    DevOps are already aware of the possibilities of logging, to keep track of multiple avenues in product creation, from databases to server side events, and even the effects and behavior of users.

    Stringent log management means making use of a valuable resource of knowledge and decision making, but also operating with a complex system of data. DevOps managers will need the tools to span the demands of stringent log management, for a multi-step process involving log generation, transmission, analytics, storage, archives and disposal.

    The right logging system can streamline those steps. Inexpensive logging tools and systems can unify log management across teams and simplify the process of logging. More services are appearing each day, either cloud-based or self-hosted, and with varying levels of security. With increasing complexity and the drive to create ahead of the competition, it would be the task of DevOps managers to make the team aware of the tools, and to provide tools intuitive and fast enough for the good habit of logging and log management.

    — Chris Nguyen

  • DevOps Chat: Instrumentation with Influx Data’s Evan Kaplan

    DevOps Chat: Instrumentation with Influx Data’s Evan Kaplan

    Evan Kaplan, CEO of Influx Data, is someone who knows his way around the technology world. In a lifetime of experience that has seen him found and manage several successful companies from startups to public entities, Evan has had a great track record of success.

    Influx Data is yet another success for Kaplan. Building on the open source InfluxDB, the company boasts more than 200,000 users of Influx today.

    In this DevOps Chat, Evan and I discuss systems instrumentation today and what big data and velocity means for developers and everyone up the stack. It is a very different world from just 15 or 20 years ago.

    As usual, the streaming audio is immediately below, followed by the transcript of our conversation.

    Transcript

    Alan Shimel: Hey, everyone, it’s Alan Shimel, devopsy.kinsta.cloud, and you’re listening to another DevOps Chat. Happy to be joined in this episode of DevOps Chat by, actually, someone who grew up in my neighborhood. We knew each other – well, we didn’t know each other way back when, but we’ve come from a very small area of concentrated – lot of people, you know, we know from that area, but, anyway, Evan Kaplan, CEO of InfluxData and of North Woodmere. Evan, welcome.

    Evan Kaplan: [Laughs] Thanks, Alan. Thanks for having me. Look forward to _____ –

    Shimel: My pleasure. So, Evan, it’s been a long, strange trip from North Woodmere. Why don’t you give our audience a little bit of your background and your journey? And  then we’ll jump into –

    Kaplan: Yeah. Sure. Sure. Very long for me. If those of you don’t know, that’s a suburb of New York City, right near Kennedy Airport, that we both grew up. My strange trip took me to Seattle, where I finished up college and worked as a climbing guide for years. And then worked in aerospace and started a company, the first company to develop SSL-based VPNs, called “Aventail,” back in the mid-90s. _____ through the bubble. Ran a public company called “iPass,” and, about two-and-a-half years ago, met Paul Dix, the founder of Influx. And Paul and I really connected about his vision and what he was doing, and we partnered together to start building Influx from 25 employees back then to north of 100 now. So growing fast.

    Shimel: Good stuff. Good stuff. And, Evan, I’m gonna assume most of our audience has at least heard of InfluxData, but, for those who have or even those who haven’t, just to set the level-set, tell us about what InfluxData does.

    Kaplan: Yeah, so InfluxData is an open-source time-series-based data platform. It’s the leading time-series platform out there. Time-series is the fastest growing market in the database, data category. And so Paul, our founder, spun up Influx back in 20 – I think it was late 2013. It received a lot of accolades on GitHub. It was a very popular project and it has grown dramatically since then, from roughly – I don’t know – 1,000 sites running it to, today, we’re approaching 200,000 sites running it.

    Shimel: Wow.

    Kaplan: And, you know, most of the large Global 2000 is running it somewhere, so.

    Shimel: That’s really impressive, man. That’s something to be proud of. So, Evan, we could probably spend our whole 20 minutes talking generally about Influx DB and what’s happening, but I’m wanted to kinda dive in a little bit and talk specifically today around instrumentation in modern software installs, in the modern software factory. This whole term “modern” has become sort of a catchall buzzword, dog whistle, if you will, for when we talk about  things like Agile and DevOps and serverless and microservices and all of these ways that we’re seeing software being written, managed, and deployed today. So talk to us a little bit about it, if you will, Evan. Where’s your take on this?

    Kaplan: Yeah, so I think we’re – we grew up in the industry, going back a couple of decades ago, the common myth for monitoring or instrumentation of systems was you would buy a package from HP OpenView or CA or a mainframe management package, and you’d buy a monitoring-for-a-service package. They were expensive and they were largely horizontal across the stack, and you’d implement those. And what’s happened over – certainly over the last ten years, during the DevOps revolution, is that stuff has fractured and you’ve seen companies, like Splunk and Elastic and a variety of other folks, arise to handle the modern workloads in an open-source sort of fashion. And now, if you take a look a look at DevOps world, most of solutions are dominated by open-source kinds of models.

    If you look at state of the art now, that people are really paying attention to, the revolution that brought you to logs and log views of stuff and the consolidation of logs has moved much closer to metrics and events. And what I mean by “metrics and events,” the instrumentation of real time of these complex systems. And they’re not just software systems that are DevOps things, so – those are obvious, but they’re also hardware systems; they’re IoT things. And so what’s happening is people wanna see these complex systems and they wanna interact with them in real time because the only way to characterize these systems is to watch them behave in real time. And “observability,” as you know, Alan, has become sort of a keyword here. And observability generally means real time and it means metrics and events; it doesn’t mean verbose logs.

    And so what we’re trying to do is help developers, specifically and, up the chain, architects and CTOs, build instrumentation or telemetry natively into these complex systems, so they can view these things in real time. As you can guess, the data loads with this are absurdly high. You’re talking about hundreds of millions of points a second in some of these systems and you’re talking about to visualize those in near real time, you know, control loops in near real time. And you’re talking about this sort of next generation of, lack of a better way to say it, system instrumentation and management.

    Shimel: Sure. Evan, if I could stop you there for a sec, you know what I find interesting? We’re talking about building this instrumentation and to give people insight and who are we giving insight? Well, you mentioned developers and managers and architects and CTOs, et cetera, but you didn’t mention ops. And is that –

    Kaplan: Yeah. Yeah.

    Shimel: Isn’t that a little bit of, you know – I don’t know if it’s Freudian or if it’s just insight into what today’s world looks like for these things.

    Kaplan: You know, that discrete ops, right? That discrete ops role is changing, right, into what you obviously cover, which is this DevOps. And so our view of how our – uptake of our platform into large corporations, companies like IBM and Cisco and SAP and Tesla and PayPal, has been from developer or DevOps people up. So we tend to think of “Make it super easy for developers, right? Get their time to value down to really, really minimal and then it will rise up and be taken as a complete operational system.” So we tend to think of it from developers up. Not to say the operations guys aren’t relevant – they’re super relevant – it’s just, when we enter into a large opportunity or business or that sort of stuff, it’s usually coming from a developer who figures out he can instrument his code, his service, his offering relatively quickly in Influx.

    Shimel: Got it. And I’ll tell you something I – and it goes back to what you mentioned earlier – the sheer volume and the acceleration of data, right, the – so, no, it’s how much data and the speed that it comes at us. With automation and everything that that brings, it easily outstrips the ability of a human, a lot of times, to stay on top of it, so you almost need to build automation, machine learning, AI into these types of instrumentations, that you bring what the human really needs to see and touch or make a decision on to his attention ’cause so much of it is just whizzing by right now.

    In the last week or two, Evan, I’ve probably had a couple of discussions – trying to think of a friend of mine who – CEO at ScienceLogic and another company called “Ravel Systems”; some friends of mine in security just launched something called “DisruptOps.” And they’re all talking about this term, “AIOps.”

    Kaplan: Yeah. Yeah.

    Shimel: And I’m wondering is this something relevant to what you’re talking about, with instrumentation? Where does that fit in? How do we account for just the big data nature of this?

    Kaplan: Yeah, I think, first of all, absolutely. So, if you think about – so the journey. And let’s call it the end state of all of this is true autonomy, which is very rare and, in fact, almost never the case, right? But, if end goal state is true autonomy, what’s that journey look like? It looks like, first and always and most importantly – and, by the way, the stuff that we skipped a lot, when we were in the early stages of our career – it is, in fact, instrumentation, is telemetry. Telemetry always was an afterthought before whether shipping a product or a service or that sort of stuff. Now the ability to drive that cost of instrumentation down so low that the ability to see what’s going on and create the data – not just see as in “human” see but create the data – has changed dramatically.

    So, if you follow that journey, you go from instrumentation; you go to observability; you go to automation in the form of “I’ve observed these sorts of things, whether it’s through AI capability or not. I built control loops because I’ve observed them, so I’ve built control loops to keep it in a relative stasis. Right? To autonomy.” All of that – the last two steps, right, even the last three steps – involves some form of machine processing of learning, whether it’s machine learning or AI or call it, but all of that gets increasingly sophisticated. But it means taking in, as you sort of articulated, you know, millions, hundreds of millions – in some case, billions – of points per second, right?

    Shimel: Yep.

    Kaplan: Think about it. Now that’s just completely – you know, what a different world, than doing server management with your CA Unicenter product 20 years ago.

    Shimel: [Laughs] To say the least.

    Kaplan: Right?

    Shimel: Yeah, I hear ya. I mean, it really is. If we transported – you know, if we could do that – if we could transport someone from not that long ago, Evan, an hour or _____ _____ –

    Kaplan: No. No.

    Shimel: From 1997, ’98, right? I was helping an early ASP, Interliant. We were building – opening data centers, managing Lotus Notes and PeopleSoft and stuff like that.

    Kaplan: Right.

    Shimel: If I could take a NOC guy from there and show him today’s velocity and the fact that we actually do have telemetry and we actually are building tools that allow us to manage at that level, it would be like taking someone from colonial times and showing them highways with cars. I mean, the supports –

    Kaplan: But, Alan, these solutions are still sitting out there. They’re a huge _____ _____ _____ –

    Shimel: No – well, that’s the scary thing. Yeah, I mentioned my friend, ScienceLogic, my friend Dave Link. He was saying that’s his – you know, and they’ve done very, very well, and his thing was just replacing the Tivolis and the Unicenters and that generation, if you will, of network management, of systems management.

    Kaplan: If I could tell you what, back in the late ’90s, is I was building an ASP also, based on the Aventail, the SSL VPNs, what we were standing on Netcool, back in the day, and things like that, _____ _____ –

    Shimel: And Netcool was a new program, right?

    Kaplan: Yeah.

    Shimel: Before IBM bought it, right? It was one of the cool, new kids at the time.

    Kaplan: Exactly. If I could tell you what somebody could take with Influx today and do, relative to what Netcool did back in the day, and the difference, right – first of all, they could do it for nothing. Forget paid licenses. And the amount of scale, the amount of data collection, and the ease of sort of visualization has dramatically – and all those _____ _____ –

    Shimel: It’s phenomenal. Phenomenal, man. It’s just crazy. So, Evan, let’s bring this back to Influx. How does all of this now manifest itself with your business today?

    Kaplan: Yeah. So that’s right. So we look at our businesses in two segments, right? We look at it as the instrumentation of and the collection of data around software, being the platform of record for this next generation of cloud software. And I don’t have to describe to you is is that, if, in the old days, it was an X Windows terminal talking to a Unix server app, today, there is no “there” there. There’s a virtual network; there’s VMs, containers, and microservices that are growing at exponential rate. The whole infrastructure is ephemeral, so the monitoring and the instrumentation workload has dramatically changed. So one side of our business is really focused on that, that opportunity, and we’d call that the “DevOps chain” of the business, right? Because it comes up into organizations through DevOps folks who bring in Influx and instrument.

    The other side is IoT, which is completely different. So, while DevOps is largely metrics-driven, IoT is largely event _____ driven. And that’s the instrumentation of the physical world, right? So our watches, our clothing, our health care, our cars, our homes, are all being instrumented with sensors. The amount of data pouring in through that is driving whole other systems into business. And, while most of our time was spent on the management of software systems back, now it’s this deep, deep integration of software and hardware. Deep. And so our business breaks out into those two categories, largely.

    Shimel: Got it. Got it. Evan, anything – any new news coming out of Influx you wanna share with our audience or –

    Kaplan: You know, where – we have – you know, we’re almost constantly releasing stuff into the community on a regular basis, so no news that I’d share at this moment. We can touch base in three or four weeks. We have our big InfluxDays event. We’ll make some announcements there, but you can look for us to build increasingly sophisticated solutions that allow people to do their machine-learning workloads, their application tracing, their log and metrics, their asset management, on top of Influx. What we want is people to use us as the platform of record for all of these metrics and events pouring in.

    Shimel: You know, we live in interesting times and I can’t wait to see where this all goes as well, so we’re about out of time, though, here. As I mentioned to you, the 15, 20 minutes goes so quickly.

    Kaplan: Yeah, it really does.

    Shimel: And you barely ever – you know, it is what it is. But, Evan, thanks for joining with us. Evan Kaplan, CEO, InfluxData. You know, so, in three, four weeks, you have your event coming up; maybe we’ll have you back. We can talk a little more about that. We’re doing a big – I didn’t even announce it yet, but I’m gonna announce it right here on the show with you – we’re gonna be doing a big virtual event, December 18th, called “Predict 2019,” and we’re gonna –

    Kaplan: [Laughs]

    Shimel: Yeah. We’re gonna be opening up the crystal ball and asking a lot of pundits and experts and so-called experts what their predictions are for what 2019 has in store. Maybe we can have you back then and we can do some crystal-ball gazing.

    Kaplan: That’d be great, Alan. Always a pleasure. Always a pleasure.

    Shimel: All right, my friend.

    Kaplan: Have a great day. All right.

    Shimel: Well, Evan Kaplan of North Woodmere and InfluxData, thanks for being our guest on this episode of DevOps Chat. This is Alan Shimel for devopsy.kinsta.cloud, and you’ve just listened to another DevOps Chat. Have a great day.

    Kaplan: Take care.

    — Alan Shimel

  • Metrics, Logs and Traces: The Golden Triangle of Observability in Monitoring

    Metrics, Logs and Traces: The Golden Triangle of Observability in Monitoring

    It isn’t surprising that the job of monitoring infrastructure and application environments has grown more complex as the underlying technologies evolve. Nor is it surprising that the need to get monitoring right has expanded as our business reliance on IT grows ever deeper, so it is important to have a good grasp of the core tools at your disposal.

    What you might call the golden triangle of observability includes metrics, logs and traces. Each plays a specific role in infrastructure and application monitoring so you need to understand what they bring to the table.

    Metrics

    Metrics probably represents the most valuable of the three monitoring tools because:

    • So many resources are designed to spit out various bits of health and performance information (and there are loads of tools to collect this information).
    • They are efficient.
    • They are frequently generated.
    • They are easily correlated across elements of your infrastructure.

    Everything from operating systems to applications generate metrics which, at the least, are going to include a name, a time stamp and a field to represent some value. Since so many resources come ready to tell us about themselves, metrics is an obvious place to start when it comes to monitoring.

    Most all metrics will enable you to tell if a resource is alive or dead, but if the target is valuable enough you’ll want to be able to ascertain what is actually wrong with the system or going wrong.  As you can imagine, the latter will require detailed information about what is happening inside the system, so called white-box monitoring that relies on internal instrumentation.  The more rudimentary black-box approach draws conclusions about the health of a system based on externally visible indicators (is it responding to any system calls?).

    But perhaps the most important thing to understand about metrics is that last bullet about  being able to correlate metrics across infrastructure components.  Given the complex interdependencies common to IT environments today, the ability to stitch together metrics to get a bigger picture view is a real time saver. And it becomes even more critical as we move to cloud-native environments because of the dynamic nature of cloud  infrastructure and the ever-changing relationship between that infrastructure and the applications.

    An initial challenge of harnessing metrics is the variety of the information available and the number of tools needed to collect and make sense of that information. Then there is the question of how you store data in so many formats from so many resources. But the resultant upside more than makes up for the effort required to figure out how to harness the information.

    It is also worth noting that, given there is no standard API for metric collection, many organizations use agents to collect data that is either pushed to a central location for analysis or pulled by that central resource. Gartner says agents frequently referenced by customers include push agents Collectd and Telegraf, while Prometheus is cited as a tool to pull information from targets.

    Logs

    Logs are perhaps the second most important tool in the monitoring toolbox because virtually everything logs information about what they are doing at any given time. What’s more, logs tend to give more in-depth information about resources than metrics.  So, if metrics showed the resource is dead, logs will help tell you why it died.

    The problem with logs is there can be too much of a good thing. With everything in your environment tracking what they are doing and anxious to share that information, it is easy to see how that could result in a mountain of data. Instead of streamlining the monitoring process, you are simply creating a big new centralized haystack.

    And like metrics, differences in log formats and the abundance of tools available to collect and make sense of logs, complicates the job of getting the most out of this rich trove of material. There are, however, a number of common tools used for collecting logs, such as syslog and open source tools such as Fluentd.

    The trick to getting the most out of these tools is limiting what you collect to keep it manageable, and, where possible, to home in on common fields so you can more easily find the needles in the haystack.

    Traces

    Last but not least in the monitoring triangle is application trace data, which “traces” information about specific application operations. With so many application interdependencies these days, these operations will typically involve hops through multiple services (so called spans).

    Traces, then, add critical visibility into the health of an application end-to-end. They are, however, solely focused on the application layer and provide limited visibility into the health of the underlying infrastructure. So, even if you collect traces, you still need metrics to get the full story of your environment. APM tools feed trace information to a centralized metrics store, so traces provide a nice source of data for an app-centric view.

    The need for the viewpoint that traces can provide is exacerbated in container-based microservice architectures that are nothing more than a collection of stitched together services. These environments can be addressed with something called distributed tracing.

    Do You Need All Three?

    There is obviously overlap among metrics, logs and traces. But the quick answer to the question of whether you need all three types of monitoring tools is, It depends. The simpler your environment and the more tolerant you are of performance degradation and outages, the fewer tools you’ll need to keep things running. Basic metrics will probably work fine for you.

    Conversely, more complex environments that have to be up and running at all times or need to be fixed as quickly as possible will require a mix of tools that answer more than the question of, “Is it broken?” Metrics and logs will be base requirements.

    And finally, if your environment consists of a lot of intricately interwoven pieces, then adding traces will save you effort when it comes to birddogging problems. If you’re not there yet, but see containers and microservices playing a bigger role in your future, you’ll probably want to start getting familiar with trace tools today.

    Keep in mind that each of these tools requires storage considerations. Yes, there are options to support multiple tools from the same repository, but you’ll want to consider those needs as you build out your monitoring repertoire. And ultimately, you’ll want analysis and alerting tools that can span the environments, so keep that in mind as you consider the options.

    Together metrics, logs and traces make up the golden triangle of observability and will help you stay on top of the ever-churning IT world driving business today.

    — Apurva Dave

  • How to Fix ‘Dark Debt’ in Your IT Organization’s Culture

    How to Fix ‘Dark Debt’ in Your IT Organization’s Culture

    Poor decisions, bad metrics, lack of communication can accrue dark debt in any company

    Buying a low-quality microwave meal from a gas station, kicking a sock under the bed before guests arrive, jaywalking … We all take shortcuts. But unlike enterprise software delivery, these decisions rarely cause any collateral damage. The ramifications of taking shortcuts in IT, however, are much more serious.

    These decisions—i.e. “technical debt,” the “rework” debt owed after opting for a convenient solution instead of a better approach that takes longer—has implications on your company’s ability to grow and adapt to change. Fortunately, since the 1990s, when the term was coined by Ward Cunningham, we’ve learned how to identify and manage most forms of technical debt, understanding how to limit its impact and manage the interest.

    Your organizational culture can accrue debt, too. For example, a company that finds it easier to hire a homogeneous team up front might discover the costly cultural trade-off of hiring diversity later. When it comes to this “cultural debt,” we are much less disciplined. We often make decisions in the dark, without understanding how they are going to play out over the long term. “Dark debt” builds up over time and creates a toxic work environment in which people are not set up for success.

    Common issues indicating dark debt include:

    • Failures lead to finger-pointing.
    • Metrics incentivize undesirable behavior.
    • Lack of candor.

    Ways to Combat Dark Debt

    Call Out Psychological Safety Indicators

    Failures are inevitable, whether we are discussing power outages, data breaches or false missile alerts. A “safe to fail” mentality promotes learning and support adaptability. If employees don’t feel safe telling the boss bad news, the latter might be the last person to know what’s going on—not a good situation for a company working to disrupt an industry, or one expecting to stay listed on the Dow Jones.

    A Net Promoter Score-like survey can help identify areas where employees experience dissatisfaction. Here are some sample statements for your NPS survey that are based on Westrum’s organizational culture model as introduced in the “2014 State of DevOps Report.”

    • On my team, failure causes inquiry and not blame.
    • Our leadership is open to hearing bad news.
    • In my organization, failures are learning opportunities and messengers are not punished.
    • People on our team trust one another.

    The survey results will shine a light on the forces shaping your culture. Instead of finger-pointing, you can learn to address issues earlier and ask questions such as, “Why did it make sense for someone to do that at that time?”

    Measure Thoughtfully

    Tell me how you’ll measure me and I’ll tell you how I’ll behave. Gaming metrics are fairly easy to do, especially when an employee is incentivized to hit an unrealistic target or avoid embarrassment. Take activity metrics, for example (lines of code, number of bugs): These metrics focus on keeping people busy. But busyness does not equal business value delivered. People can be 100 percent utilized sprinting from meeting to meeting while making scant progress on business goals.

    Instead, consider metrics that reveal progress toward important business objectives or ones that help you make better business decisions. Flow metrics such as flow load, flow time, flow efficiency, and flow velocity reveal trends that measure four key areas: workload, speed, waste and throughput (respectively). These metrics are helpful in numerous ways, such as:

    • When others imply that things take too long, teams work inefficiently or people aren’t fully utilized, it’s useful to test their opinion against the data.
    • Having a balanced set of metrics allows you to see how changes in one area impact other areas. If the amount of work-in-progress (flow load) goes up, things will take longer to do (because of context switching and conflicting priorities), which results in slower speeds (longer flow times).

    Think about the behaviors that occur in your organization by how metrics incentivize people. What we measure impacts people because people value what is measured. Think twice before automatically defaulting to free and easy metrics available in your existing toolset.

    Build Social Capital

    Ideas start out flawed and incomplete. High levels of social capital, debate and discussion are the means by which ideas flourish. Social capital is what enables people to collaborate more effectively. The absence of social capital makes it impossible for people to speak openly (due to the lack of trust), resulting in withheld feedback and invisible work.

    Not much happens without discussion. When we engage in debate, our capacity to see each other’s perspectives is realized. TED talk speaker Margaret Heffernan’s insight on social capital is compelling: “Time compounds social capital.” The longer teams work together, the more trust, helpfulness and candor they accrue. Longstanding teams, therefore, benefit from increased productivity and reduced risk.

    Unlike the costly and time-consuming transitions observed in project-managed work, where people disband after dumping their work on the operations team before starting another project, organizing teams around a product allows the people who developed, tested and delivered the functionality to not only stay in their area of expertise, but also grow and gain from social capital.

    — Dominica DeGrandis

  • The Software Testing Metrics That Make Or Break DevOps Success

    The Software Testing Metrics That Make Or Break DevOps Success

    Organizations today are racing to develop software at a breakneck pace through efficient DevOps processes. But it’s important for them to avoid losing sight of the forest for the trees. If too much of that speed comes with quality sacrifices that degrade the user experience, the rapid software iterations hurt the business more than they help it.

    “Organizations adopt DevOps to accelerate the delivery of innovative software that creates positive user experiences,” said Clark Golestani, former CIO at pharmaceuticals giant Merck and current managing director of C Sensei Group. “If you start accelerating delivery without also rethinking your approach to quality, you will end up rapidly delivering updates that drive your customers to competitors.”

    This is why continuous and automated testing is so essential to DevOps success. But instituting effective and streamlined testing is easier said than done. Organizations must continually tweak what, how and when they test their software to achieve the optimal test coverage while introducing as little friction as possible into the software delivery pipeline. It’s a delicate balance, and the only way to achieve it is to keep meticulous track of metrics that evaluate how well the testing process is improving quality throughout the development life cycle.

    “As the saying goes, ‘You can’t manage what you don’t measure,’” said Andrew Magarie, senior market impact consultant at Forrester Consulting. “So firms need to be able to define and track the right metrics that can help enable quality at speed while minimizing risk.”

    Magarie and his team at Forrester recently conducted research into 94 different quality metrics frequently measured by DevOps organizations across four development stages: build, functional validation, integration and end-to-end regression testing. The study showed that the most effective test metrics that bubbled up across all of stages tended to clump into at least one of three categories.

    Risk-Focused Metrics

    According to Magarie’s report, the most mature and effective organizations fundamentally chose testing metrics that best helped them understand business risk posed by the software throughout the development process.

    “For this study, we use the following definition of business risk: Any application shortcoming that impairs the end user’s (or customer’s) expected experience and ultimately erodes confidence in the business,” he explained.

    For example, during the build stage mature organizations consider measuring the number of automated tests prioritized by risk as one of the most important assessments.

    “Tracking ‘unit’ tests prioritized by risk is the key. As the code base evolves, developers and testers need immediate feedback about change impact. This feedback is significantly more actionable if prioritized by level of risk,” wrote Magarie.

    As he explained, business risk will be different for every application, and the complexity of an organization’s architecture and transaction dependencies adds more variables to the equation. However, organizations need to seek ways to measure ‘relative risk’ across the software development life cycle (SDLC) if they truly want to take a disciplined approach to incrementally improving quality in their software.

    Contextual Metrics

    Forrester found that simple “counting” metrics don’t offer QA nearly as much value as contextual metrics. So simply tracking the number of tests will not provide teams with as much actionable data as the measurement of the ratio of requirements covered by tests. Approximately 69 percent of mature organizations say running functional tests and checking against covered requirements is a top measurement and 75 percent say the same about API tests run against functional requirements.

    Holistic UX Metrics

    The most mature organizations recognize that while application-specific or team-specific QA metrics are important, the ultimate goal is ensure the quality of the user experience (UX) across their entire interaction with an application. This means measuring the thoroughness of end-to-end regression testing is crucial. Approximately 70 percent of leading DevOps organizations say they believe the percent of automated end-to-end test cases as a top metric.

    — Ericka Chickowski

  • Software Development: A Better Way to Measure Success

    Software Development: A Better Way to Measure Success

    Here’s a metaphor for software development you probably haven’t heard before: It’s like flying a plane. You have a starting point and a destination in mind, there’s a good chance you’ll change course midflight, and … sometimes you get a little nauseated?

    Okay, it’s not the best analogy. But there is one aspect of piloting a plane that offers valuable insight into how to measure your team’s performance more consistently. It’s called the performance-control technique, and it may be the best method you’ve never heard of for keeping your engineering teams aligned behind a common goal.

    Imagine for a second sitting in the cockpit of a plane, surrounded by clouds. Forget using the ground to orient yourself; you have nothing but your instruments and wits to guide you. It’s a situation I’m plenty familiar with, having taken flying lessons out here in rainy Seattle. In those cases, you use your altitude and power settings to set up a particular control scenario that results in your desired output, whether it’s ascending, descending, straight and level or turning. And then you monitor your performance—in this case via altitude, vertical speed and airspeed indicators—to verify that you’re achieving your desired output.

    Now unless your software development pipeline is irredeemably broken, you are probably not flying completely blind as you work to build and ship new features. But the technique still applies: Choose your control metrics (time to release, for example), and then set up a series of performance metrics to keep it on track.

    Cloudy Skies Ahead

    The greatest strength of the performance-control technique is its acknowledgement that any control can result in unintended consequences. Take reducing the time from check-in to release. It’s a fantastic goal: The quicker you get code into production, the quicker you deliver updates to your customers. The quicker you do that, the quicker you get feedback and respond to their needs. The quicker you do that, the quicker you can iterate on features. And the cycle continues.

    But it’s also a goal that can result in unintended consequences: When you single it out for attention, it’s only natural team members will want to do everything they can—at the expense of almost everything else—to achieve it. That’s not to say they want to do wrong; rather, they’re just trying to be good citizens. (And, okay, they don’t want their name to show up in a report about why the team didn’t meet its quarterly goal.)

    So people make compromises. Maybe they drop full regression passes and replace them with incremental feature and integration testing. It’s not that they don’t care about quality. But in their quest to help the organization meet its single-minded goal of reducing the time from check-in to release, they opt for the easiest change that could get them there, indirectly prioritizing speed over quality in the process. And that happens because there aren’t checks in place to keep it from happening.

    Taking Control

    How do you put this into practice at your own organization? Start by choosing your goals and then selecting the control metrics. For many, it could be as simple as increasing speed; it’s a natural goal to chase, for the reasons already discussed. But it may be something different; only you and your teams can decide by being intentional in how you evaluate your production environment.

    Then it’s time to choose your performance metrics for each of your goals. You can do that yourself, but it may be more illuminating—and, honestly, more fun—to get your software development team involved. That could range from encouraging them to brainstorm the negative consequences of implementing that goal to straight-up asking them how they’d game the system.

    The following chart offers examples of control goals, their resultant unintended consequences, and the performance metrics necessary to keep them in check.

    Desired Output Control Goal Performance Goal Unintended Consequences
    Climb to 4500’ Increase power, nose up Airspeed, Altitude Stalling
    Reduce bounce rate Reduce site latency Revenue, Conversions, Customer Engagement Smaller pages, poor experience, feature attrition
    Generate more conversions Increase availability Releases, Backlog Ticket aging. Lower frequency of releases, cherry picked work items, no risk taking.
    Reduce MTTR Speed up ticket closure Re-open rate, new ticket rates. Premature closure, delay in opening tickets for issues.

    It’s important to note that how closely you monitor each of these performance metrics will vary, and in some cases significantly. Rather than attempt to apply a one-size-fits-all approach, instead think of each in terms of how long it takes to detect that the metric is falling out of its control envelope and how long it would take to recover if it did. If it takes one day to detect that you’re outside of your envelope and three weeks to recover, then by all means, check in daily. But if it takes three months to fall out of the control envelope and just a day to recover, you may only need to check it once every couple of weeks.

    A Soft Landing

    As we’ve supported software development teams in their efforts to modernize their software delivery methods, we’ve heard time and time again, “What’s the best metric for measuring success?” And we struggle to come up with an answer because there is no golden metric that works for everyone. But more important, even the good ones can lead well-meaning engineers and team leaders to optimize for one thing while letting others suffer.

    So rather than search for a magic bullet, the secret is to find goals that work for your needs—and then build in metrics that keep you and your software development team accountable.

    — Rob Duffy

  • Knowing What Your Microservices Are Doing

    Knowing What Your Microservices Are Doing

    Microservicin’ ain’t easy, but it’s necessary. Breaking your monolith down into microservices is a must in a cloud-native world, but it doesn’t automatically make everything easier. Some things actually become more difficult. An obvious area where it adds complexity is communications between services; visibility into service to service communications can be hard to achieve, but is critical to building an optimized and resilient architecture.

    The idea of monitoring has been around for a while, but observability has become increasingly important in a cloud-native landscape. Monitoring aims to give an idea of the overall health of a system, while observability aims to provide insights into the behavior of systems. Observability is about data exposure and easy access to information which is critical when you need a way to see when communications fail, do not occur as expected or occur when they shouldn’t. The way services interact with each other at runtime needs to be monitored, managed and controlled. This begins with observability and the ability to understand the behavior of your microservices architecture.

    A primary microservices challenge is trying to understand how individual pieces of the overall system are interacting. A single transaction can flow through many independently deployed microservices, or pods, and discovering where performance bottlenecks have occurred provides valuable information.

    It depends who you ask, but many considering or implementing a service mesh say that the No. 1 feature they are looking for is observability. There are many other features a mesh provides, but those are for another blog. Here, I’m going to cover the top observability features provided by a service mesh.

    Tracing

    An overwhelmingly important thing to know about your microservices architecture is specifically which microservices are involved in a user transaction. If many teams are deploying their dozens of microservices, all independently of one another, it’s difficult to understand the dependencies across your services. Service mesh provides uniformity, which means tracing is programming language-agnostic, addressing inconsistencies in a polyglot world where different teams, each with its own microservice, can be using different programming languages and frameworks.

    Distributed tracing is great for debugging and understanding your application’s behavior. The key to making sense of all the tracing data is being able to correlate spans from different microservices related to a single client request. To achieve this, all microservices in your application should propagate tracing headers. If you’re using a service mesh such as Aspen Mesh, which is built on Istio, the ingress and sidecar proxies automatically add the appropriate tracing headers and report the spans to a tracing collector backend. Istio provides distributed tracing out of the box, making it easy to integrate tracing into your system. Propagating tracing headers in an application can provide nice hierarchical traces that graph the relationship between your microservices. This makes it easy to understand what is happening when your services interact and if there are any problems.

    Metrics

    A service mesh can gather telemetry data from across the mesh and produce consistent metrics for every hop. Deploying your service traffic through the mesh means you automatically collect metrics that are fine-grained and provide high-level application information since they are reported for every service proxy. Telemetry is automatically collected from any service pod providing network and L7 protocol metrics. Service mesh metrics provide a consistent view by generating uniform metrics throughout. You don’t have to worry about reconciling different types of metrics emitted by various runtime agents or add arbitrary agents to gather metrics for legacy apps. It’s also no longer necessary to rely on the development process to properly instrument the application to generate metrics. The service mesh sees all the traffic, even into and out of legacy “black box” services, and generates metrics for all of it.

    Valuable metrics that a service mesh gathers and standardizes include:

    • Success rates.
    • Request volume.
    • Request duration.
    • Request size.
    • Request and error counts.
    • Latency.
    • HTTP Error codes.

    These metrics make it easier to understand what is going on across your architecture and how to optimize performance.

    Most failures in the microservices space occur during the interactions between services, so a view into those transactions helps teams better manage architectures to avoid failures. Observability provided by a service mesh makes it much easier to see what is happening when your services interact with each other, making it easier to build a more efficient, resilient and secure microservice architecture.

    — Zach Jory