Tag: metrics

  • InfluxData Makes Processing Observability Data at Scale More Efficient

    InfluxData Makes Processing Observability Data at Scale More Efficient

    InfluxData today made available an update to its open source time series database that can now analyze metric, event and trace data in a single datastore with unlimited cardinality in terms of how they are aggregated.

    The company is now making available a single-tenant instance of InfluxDB as a managed service alongside its already-existing multi-tenant cloud service that is based on a serverless architecture.

    Finally, InfluxData also announced that later this year it will make available InfluxDB 3.0 Clustered and InfluxDB 3.0 Edge to provide a curated version of the database that organizations can deploy themselves where they best see fit.

    InfluxData CEO Evan Kaplan said InfluxDB has been developed to support a wide range of emerging applications that require access to time series data, including the observability platforms core to DevOps workflows that require visibility into metrics, events and trace data.

    Over the past three years, InfluxDB has been revamped to run on a columnar engine, dubbed IOx, that leverages the open source Apache Arrow memory format and written in the Rust programming language. Kaplan said that approach makes it possible to continuously ingest, transform and analyze hundreds of millions of time series data points per second without limitations.

    At the same time, InfluxDB takes advantage of high compression object storage to reduce the total cost of storing all that data. It also provides interoperability with Open Data Architecture (ODA) to integrate with data lakes based on open source platforms such as DataFusion, Flight SQL and Parquet that are being advanced by the Apache Software Foundation.

    The arrival of version 3.0 of InfluxDB comes as many DevOps teams are starting to struggle with the amount of observability data being generated. DevOps teams want to be able to move beyond monitoring a set of pre-defined metrics and query data in a way that enables them to surface anomalies indicative of a potential issue before there is a major disruption to an application service.

    One of the major challenges today is the tradeoff between how much data is collected and analyzed versus the cost of processing and storing it. InfluxDB provides a mechanism for analyzing high cardinality data involving metrics, events and traces cost-effectively.

    Observability is, of course, only one of several use cases for a time series database capable of processing data in near-real-time. As organizations embrace digital business transformation initiatives, they need to be able to process data in near-real-time at the point where it is being created and consumed. Those applications won’t necessarily replace existing applications based on batch-oriented processing but, over time, they create two distinct classes of applications that process data in fundamentally different ways. The challenge, as always, will be defining the DevOps workflows required to manage applications running on multiple distinct types of architectures.

  • DORA Report 2022: The Magnitude of Software Supply Chain Security  

    DORA Report 2022: The Magnitude of Software Supply Chain Security  

    The term ‘software supply chain security’ (SSC) can be interpreted in many ways. Following the White House executive order in May 2021 and the European Cyber Resilience Act (CRA) of 2022, both governments and corporations are taking a more active role in ensuring their software is secure. Fundamentals such as having a software bill of materials (SBOM) and being able to cross-reference it with known common vulnerabilities and exposures (CVEs) are now the standard, but supply chain security covers far more than just the software that builds your products.

    To create certainty and clarity, leading standardization bodies such as OWASP, OpenSSF and others have set up ongoing efforts to define and mitigate SSC threats. They have active working groups, SIGs and TACs all working in vendor-neutral ways to help define and solve parts of the SSC problem.

    A great example of this is the continuous work being done by Google Cloud’s DevOps Research and Assessment (DORA) initiative. More specifically, the subject was reflected in the September 2022 DORA report that focused on security in general and supply chain security in particular. Using the Supply-chain Levels for Secure Artifacts (SLSA) framework as well as the NIST’s Secure Software Development Framework (SSDF) as benchmarks for actively addressing supply chain security issues, the researchers assessed how organizations were successful in approaching and addressing threats at all levels of the organization.

    My view of the major findings of the DORA report are summarized below.

    Who Owns Software Supply Chain Security?

    The report stated that organizations should empower individual teams and developers to “own” security while administering a consistent security policy and posture across its products. While I agree with this, we need to examine both sides of the ‘ownership’ coin. By nature, this hybrid approach creates complexity—and even friction—between the security team that, by definition, is responsible for all facets of security and the developers that are being tasked to ‘fix’ security issues in addition to their daily tasks. There has to be common ground between developers, their tasks associated with security and the security team.

    Individuals in organizations that build software care about what they build; they have a stake in the overall success of the final product and this feeling of ownership strengthens that level of care. However, asking for such ownership while adding a security component to the mix without providing sufficient knowledge, tools, proofs, and “power” to make decisions could lead to  a lack of trust, confusion, execution problems and frustration. To alleviate this, the security team should provide developers the tools, education and resources they need to feel empowered to enhance security efforts at the source. Organizations that provide evidence in a scalable, digestible manner are successful in building trust and creating common ground between the developer, security and the security team.

    There’s also another dimension that could potentially create silos between developers and security teams rather than bringing the two together: There’s no one single security team or owner of SSC. SSC is tricky to define as a category; it involves shift left security, runtime security and everything in between. Some portions of it are being governed by the security office, some by AppSec, some by DevOps and some by the developer. The ownership of each isn’t well-defined and the entire effort is very difficult to consolidate as one process or methodology. In addition to upskilling the developer with tools and training, long-term education, thought leadership and access to good technology are the keys to gradually reduce these friction points..

    Security Processes Slow Down Development

    Defining the tools, methodologies and processes that should be employed in an organization to add sufficient security while not impacting development speed is not a trivial task.

    ­­The following are four principals I think correspond well with the SLSA framework and that help address the development slowdown challenge:

    Set preventive measures: Avoid using known vulnerable and malicious packages from the beginning of development. By eliminating vulnerabilities introduced in first-party code (due to bad coding practices) as well as misconfigurations, wrong encryption and secrets exposures, you are preventing known threats from entering your product.

    Examine proactively and continuously: The security state of software changes because the software itself always evolves and new vulnerabilities are continuously being introduced. It makes a software artifact that was just secured suddenly become susceptible to attack. This requires continuously rescanning and revisiting software artifacts as well as frequently recalculating any potential risk.

    Set preemptive measures: Create a plan that initiates a prompt response when a potential risk is discovered. Both development and security teams should create the plan for decision making and execution. The measures should include ways to identify vulnerable artifacts across development and production, how to understand exploitability and true impact and how to prioritize and remediate accordingly.

    Do it all in an automated manner: Create automated processes based on reliable data and scanning tools to dramatically reduce the effort needed by developers and DevOps teams.

    DORA report co-author Eric Maxwell said one of the main principles is to remain tool- and platform-agnostic while focusing on capabilities and practices. From that perspective, automation is essential and it is enabled by security-as-code. Having a common language–code–allows teams to communicate about security as well as collaborate. It drives the things we discussed earlier around democratizing the security process and helps break down silos.

    The DORA findings—alongside the topics described above—encourage community awareness and continued shared efforts to bring much-needed attention to software supply chain security. Gradually, SSC security will evolve, but as it does so, the only way to properly address it is by ensuring the developers and security teams are on the same page and both have ownership of responding to and resolving issues as they appear. For more in depth review of the DORA report I encourage you to view Leap Left for Security: The DORA Report Roundtable.

  • Fiberplane Adds Open Source Libraries to Automatically Collect Metrics

    Fiberplane Adds Open Source Libraries to Automatically Collect Metrics

    Fiberplane today added an ability to automatically collect metrics in real-time and make them accessible either via its namesake notebook software for debugging infrastructure or an open source Grafana dashboard.

    Fiberplane CEO Micha Hernandez van Leuffen said Autometrics is an open source set of libraries the company created to make it simpler for developers to see platform performance metrics using a set of tools embedded within their integrated development environment (IDE).

    The goal is to reduce the cognitive load on developers; today, developers need to first determine what metrics to track, find a way to collect the appropriate data and then launch queries against those metrics to determine the root cause of an issue, said Hernandez van Leuffen.

    Autometrics, in contrast, provides access to a set of common queries using the Prometheus programming language (PromQL) against data that has been collected using open source OpenTelemetry agent software, he noted.

    That approach, for example, makes it simpler to track error rates, response time and latency of any function. Links to live charts based on real-time data can also be inserted into the comments section of any document a development team creates.

    The Fiberplane notebook uses the same operational transformation algorithm embedded within Google Docs to enable teams to easily collaborate around a document or spreadsheet. The core platform itself is built in Rust and WebAssembly (Wasm) to make it simpler to integrate Fiberplane as a plug-in into an existing DevOps workflow.

    Autometrics extends that capability in a way that enables DevOps teams to provide developers with instant access to observability data. They can then see how their code is performing on any given platform, which is critical as more responsibility for running applications continues to shift left, said Hernandez van Leuffen. Today, many developers need to wait for an IT operations team to share data collected via an observability platform that was designed to be used by ITOps rather than a developer, he added.

    As observability capabilities become more federated across the entire software development life cycle, it’s critical to make sure developers and IT operations teams can see metrics being generated in real-time. Otherwise, confusion arises because teams are not looking at the same set of metrics.

    Fiberplane address that issue by taking the concept of notebooks—often used by data science teams to collaborate—and applying it to DevOps workflows to reduce the amount of time it takes to resolve any issue. As IT environments become more distributed in the age of the cloud and microservices, troubleshooting issues invariably spans the responsibilities of multiple members of an IT team. In effect, a notebook makes it possible to spin up a virtual war room on demand that enables the members of an IT organization to collaborate—regardless of where they are physically located or which organization they may be employed by.

  • CircleCI Report Surfaces DevOps Productivity Gains

    An analysis of more than 14 million workflows from thousands of organizations conducted by CircleCI, a provider of a continuous integration/continuous delivery (CI/CD) platform, revealed the mean-time-to-recovery (MTTR) decreased by about 13% year-over-year.

    Half of CI workflows (50%) recovered from a failed run in 64 minutes or less. That compares to 73 minutes or more in previous years, the report noted.

    In general, the report found 50% of workflows completed in 3.3 minutes or less. However, the average duration was approximately 11 minutes. The median workflow ran 1.54 times per day.

    Success rates, as defined by the number of passing runs divided by the total number of runs, was, on average, 77% for default branches and 67%, on average, for non-default branches.

    Naturally, the level of productivity any given DevOps team can achieve is impacted by everything from the size of the team to the vertical industry they operate in. CircleCI CTO Rob Zuber also noted there are other crucial developer productivity metrics, such as the amount of time developers are focused on writing code, that need to be tracked as well.

    The goal for any DevOps team is to abstract away as much complexity as possible to enable developers to spend more time on writing business logic, said Zuber. Unfortunately, as more responsibility for infrastructure and security has shifted left toward developers, many of them are spending too much time managing application environments instead of writing code, noted Zuber. He noted that the cognitive load being placed on developers today is too high.

    Developing applications is, of course, as much an art as it is a science. Organizations can set aside time for sprints to write code, but it’s difficult to dictate when inspiration might strike a particular developer. There is always going to be a need to let developers, for example, write code at odd hours of the day and night. The more friction they encounter in terms of spinning up application environments, the less likely it becomes a developer will spend time squarely focused on writing code, said Zuber. The “zone” is when most of the best code is developed, he added.

    Naturally, there is no set of metrics that are equally applicable to all DevOps teams, but they should pay attention to metrics as an indicator of whether teams are improving, added Zuber. Most developers and software engineers are not going to want to work in a “software factory” where every minute of the day needs to be accounted for within a project management application. Rather than employing metrics as a stick, they should instead be used as an educational tool—a carrot—that drives steady improvement. In addition, organizations should take care to make sure the collecting of metrics doesn’t impede the pace at which applications are being developed.

    As the saying goes, things measured are usually things done; but there is a fine line to be observed when it comes to any goal that requires a certain level of creativity to achieve.

  • Why Observability is Important for Development Teams

    Why Observability is Important for Development Teams

    Observability, which allows development teams to understand better how their systems behave in production, is critical to successful software delivery. According to Gartner, by 2026, 70% of organizations that successfully applied this practice will achieve shorter latency for decision-making, enabling competitive advantage for target business or IT processes.

    Observability allows development teams to identify and diagnose issues quickly to make decisions that improve overall software delivery performance. Let’s take a closer look at why this practice is critical for development teams.

    Differentiating Observability and Visibility

    To better understand observability, it’s essential to clear up a common misconception – that observability and visibility are the same. Two critical differences exist between the two. Visibility allows development teams to look at the surface-level aspects of an application or system. In contrast, observability provides deeper insight into what an application is doing in production. Being equipped with a deep knowledge of observability allows developers to be more productive within their respective organizations.

    Impact on Developer Productivity

    With observability, developers can identify and diagnose issues within applications quickly, giving them more time to fix bugs and time for resolution, which are both critical success factors for software delivery. Observability allows organizations to quickly identify and respond to potential problems, such as operational issues or security breaches, before they become issues that impact customers or users. While there is no such thing as perfect software, observability helps developers quickly find and fix issues, bottlenecks, inefficiencies, etc., so they can get back to doing what they love: Creating new software.

    With the benefits of observability, developers naturally gravitate toward tooling and technology. There are many tools available for developers to take advantage of, and development teams must learn how to use these tools to integrate them into their applications and services. Let’s explore some of the more popular options.

    The Shift to Cloud-Native Tools

    The shift to cloud-native tools is driven by the increasing popularity of cloud computing and its benefits, such as scalability, cost-effectiveness and flexibility. The move to cloud-native has made an enormous impact on observability efforts. Having good tooling and processes available positively impacts observability efforts because it’s a critical aspect of the developer communities’ systems. Overall, the shift to cloud-native tools is driven by the need for organizations to take advantage of the benefits of cloud computing and the need for more efficient and flexible deployment and scaling of applications.

    Some of the most common tools in observability include:

    These tools offer developers greater insight and knowledge into how applications behave. The cloud-native approach necessitates a new way to aggregate all of these operations.

    Conclusion

    With observability, developers can understand how their systems work in production. These systems act in different ways depending on the environments they run in. Therefore, organizations must do more to provide developers with sufficient observability because of the limited visibility into the overall system performance.

    Observability allows developers to act quickly and remedy issues before they go into production and organizations can better measure success relative to the application’s performance. Hours of developers’ time are spent manually debugging and troubleshooting when organizations could have a system in place to do this automatically and allow developers to get back to what they love doing most: Creating software. Observability helps organizations make better-informed decisions, improve operations and performance and achieve their objectives more effectively.

  • Grafana Labs Acquires Pyroscope to Add Code Profiling Capability

    Grafana Labs Acquires Pyroscope to Add Code Profiling Capability

    Grafana Labs this week announced it acquired Pyroscope and plans to merge Pyroscope’s open source continuous profiling project with the open source continuous profiling database that Grafana Labs launched last year.

    Richard Hartmann, director of community at Grafana Labs, said after logs, metrics and traces, continuous profiling is now the fourth pillar of observability that enables DevOps teams to identify how much infrastructure resources any given piece of code is consuming. That capability is critical for everything from controlling costs to improving performance to limiting the amount of carbon generated by an application both before and after an application is deployed, he added.

    The resulting Grafana Pyroscope project will be natively integrated with Grafana Labs’ open source dashboard project to make it simpler to visualize profiling data and correlate it with metrics, logs, and traces. Grafana Labs is also committing to adding profiling capabilities to the fully managed Grafana Cloud observability platform.

    Pyroscope currently makes a plug-in for Grafana available in addition to a cloud instance of Pyroscope. Integrating Pyroscope with the Grafana Labs portfolio will make it simpler for DevOps teams to visualize issues before there is a major disruption to an application environment, said Hartmann.

    It’s still early days as far as the adoption of observability platforms is concerned, but it’s apparent that as application environments become more complex, the plethora of monitoring tools that DevOps teams rely on will need to be streamlined. Observability platforms promise to unify logs, metrics and traces in a way that makes it simpler to launch queries to identify the root cause of an issue. The rate at which DevOps teams will embrace observability will naturally vary, but the biggest obstacle might not be the platforms themselves. Instead, the issue is understanding what queries can help DevOps teams better understand the root cause of an IT issue. Visualization tools, in combination with code profiling tools such as Pyroscope, should make it simpler to surface those issues.

    Grafana Labs is also enabling organizations to better address sustainability concerns that have emerged as more policies are enacted to encourage organizations to reduce the overall size of their carbon footprints. The European Union, especially, has been enacting policies that provide organizations with a range of incentives to encourage greater efficiency from IT environments. It won’t be long before more DevOps tools and platforms provide greater visibility and control over the amount of infrastructure application code is consuming to achieve sustainability goals.

    In the meantime, overall observability should continue to improve as organizations move beyond continuous monitoring to gain insights into how application environments are behaving. As IT environments become more complex, tools that monitor a set of pre-defined metrics are no longer enough to ensure application resiliency. The challenge—and the opportunity—is to determine how to take observability to the next level before the next inexplicable application performance degradation.

  • New Relic Adds Module to Surface Code Metrics

    New Relic Adds Module to Surface Code Metrics

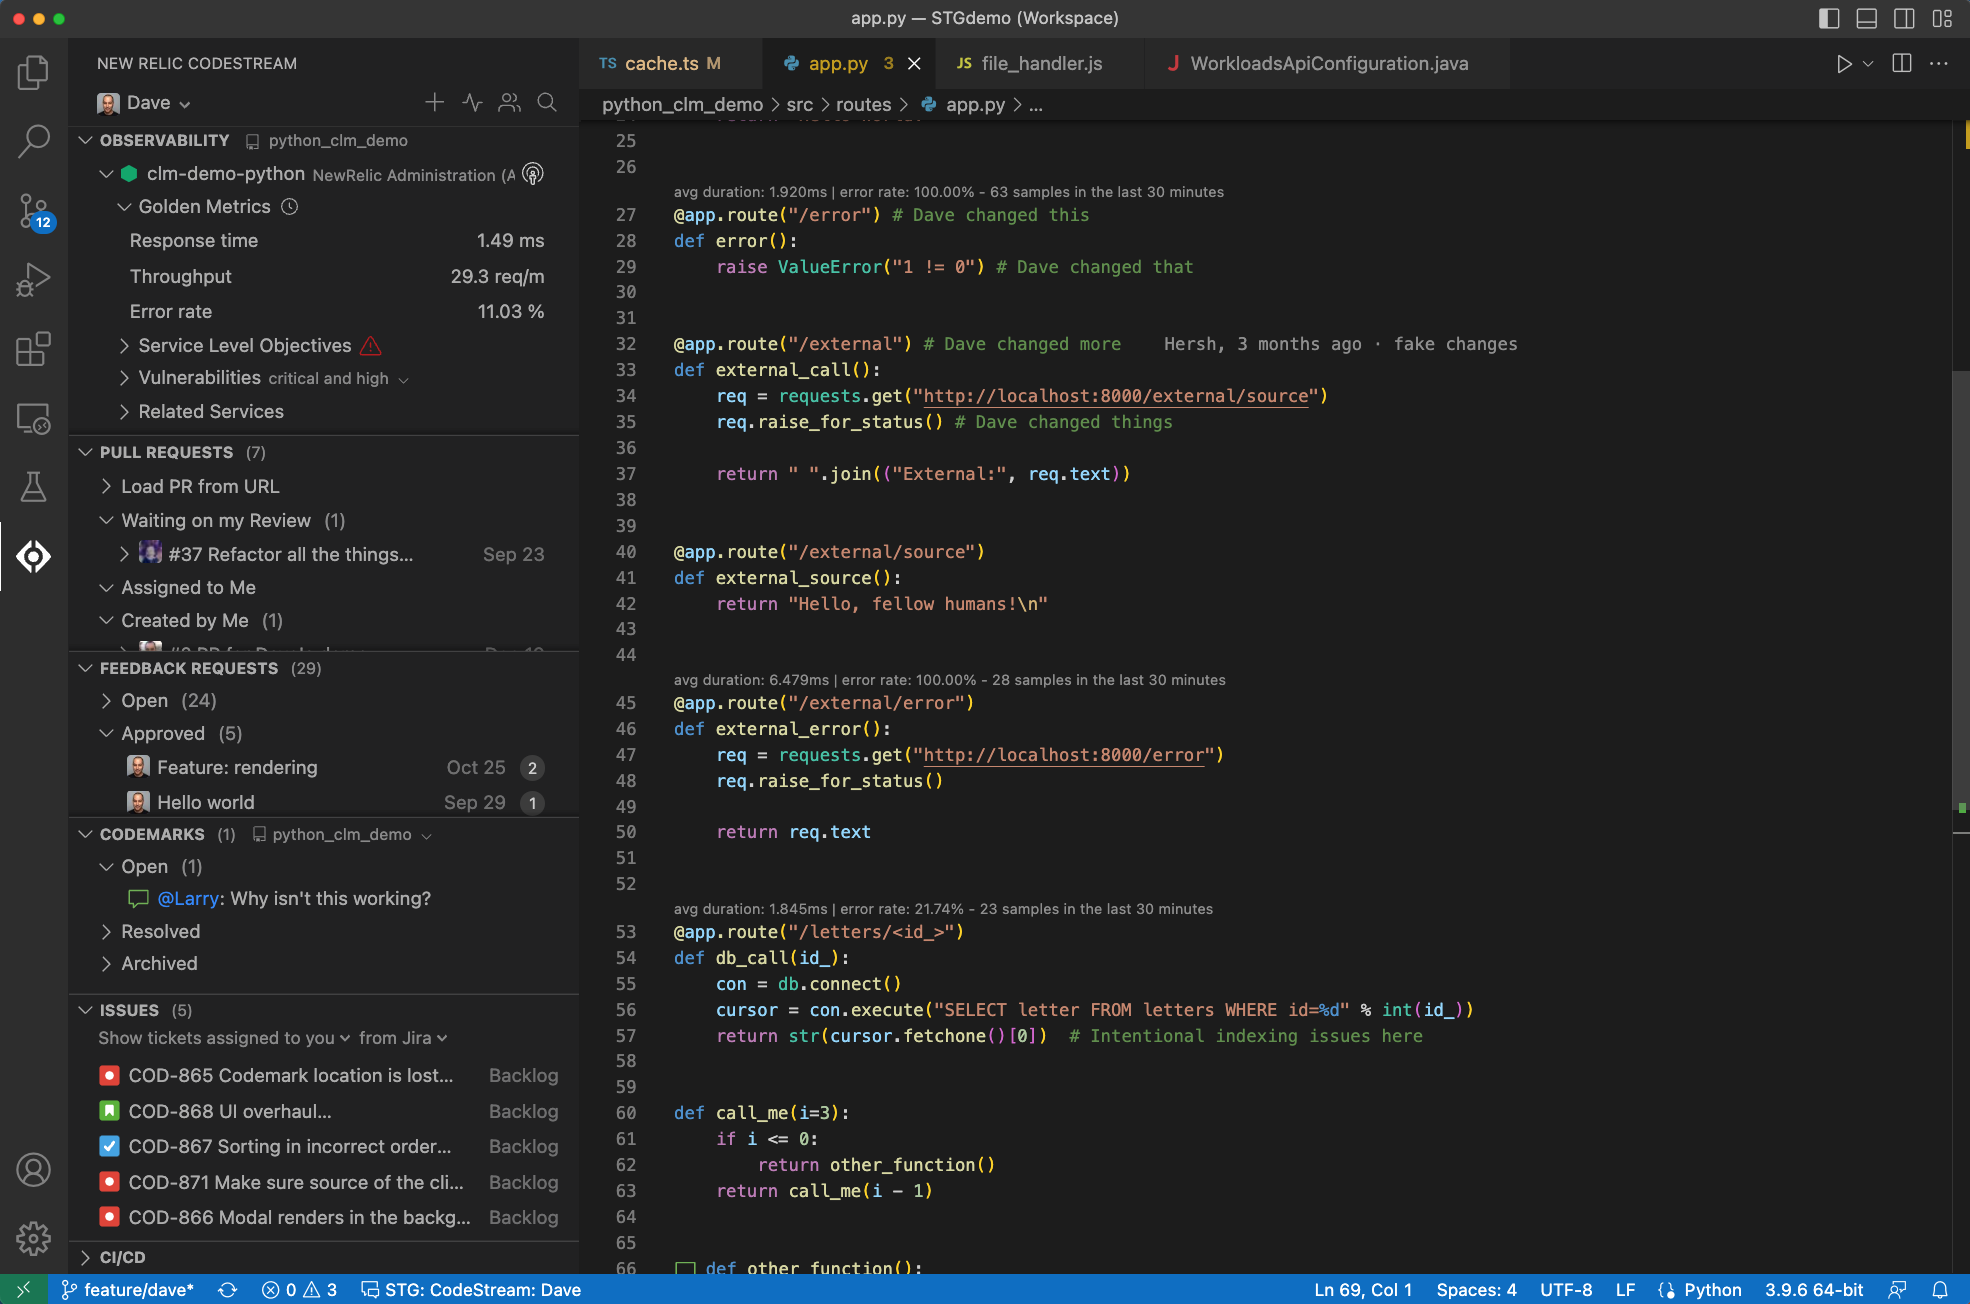
    New Relic today added a free CodeStream module to its observability platform to give developers access to metrics and telemetry data that will enable them to write higher-quality code faster.

    Peter Pezaris, group vice president and general manager of strategy and experience for New Relic, said this capability is part of an effort to shift observability left toward developers to optimize code as it is written and after it is deployed.

    CodeStream surfaces metrics and telemetry data within the integrated development environment (IDE) developers use to write software. Telemetry metrics are displayed as a line of text above the code or in the debugging tool used to troubleshoot an application. Alternatively, developers can view metrics via an observability panel at the service level. They can also view performance metrics such as error rates and response times for related services.

    That approach eliminates the need to wait for IT operations teams to surface issues that usually don’t manifest until long after the code in question was originally developed, noted Pezaris.

    The overall goal is to provide development teams with frictionless access to observability data at every stage of the software development life cycle, he added. That analysis capability will result in faster mean-time-to-detection (MTTD), mean-time-to-resolution (MTTR) and, ultimately, shorter development cycles, said Pezaris.

    Organizations should also be able to reduce technical debt faster by making it easier to identify issues that, for example, adversely impact application performance, he noted. That activity can be especially challenging because developers often inherit code written by someone else that often lacks clear documentation. CodeStream makes it simpler to onboard a developer to any application modernization initiative that has been launched to reduce technical debt, said Pezaris.

    A recent New Relic survey found only 27% of respondents have achieved full-stack observability, and only 5% claimed they have a mature observability practice in place. A third (33%) of respondents also said they still primarily detect outages manually or based on complaints, the survey found.

    On the plus side, the survey also found nearly three-quarters of respondents said C-suite executives in their organization are advocates of observability, and more than three-quarters of respondents (78%) saw observability as a key enabler for achieving core business goals. However, more than half (52%) of respondents said they experienced high-business-impact outages once per week or more, and 29% said they take more than an hour to resolve those outages.

    A full 82% of respondents said they use four or more tools to monitor the health of their systems. Only 7% said their telemetry data is entirely unified and only 13% said the visualization or dashboarding of that data is entirely unified. Nearly half of the respondents (47%) said they would prefer to have a single, consolidated observability platform, but only 2% said they currently used one tool for observability.

    Regardless of the approach to observability, it is clear that development and IT operations teams need to be looking at the same metrics and telemetry data at the same time to collaborate effectively.

  • Best of 2022: How DORA Metrics Can Measure and Improve Performance

    Best of 2022: How DORA Metrics Can Measure and Improve Performance

    As we close out 2022, we at devopsy.kinsta.cloud wanted to highlight the most popular articles of the year. Following is the latest in our series of the Best of 2022.

    A technology company’s most valuable assets are its people and data, especially data about the organization itself. By knowing what data to track over time, engineering leaders can measure how efficiently their DevOps teams are operating and enable them to maximize their value stream to deliver the best possible product to end users.

    After years of research, Google’s DevOps Research and Assessment (DORA) team identified four key metrics for evaluating a team’s performance:

    1. Lead time for changes
    2. Deployment frequency
    3. Mean time to recovery
    4. Change failure rate

    DORA metrics have now become the standard for gauging the efficacy of software development teams and can provide crucial insights into areas for growth. These metrics are essential for organizations looking to modernize and those looking to gain an edge against competitors. Below, we’ll dive into each metric and discuss what they can reveal about development teams.

    Lead Time for Changes

    Lead time for changes (LTC) is the time between a commit and production. LTC indicates how agile a team is—it not only tells you how long it takes to implement changes but how responsive the team is to the ever-evolving demands and needs of users. The DORA team identified these benchmarks for performance in their Accelerate State of DevOps 2021 report:

    Elite performers: Less than one hour

    High performers: One day to one week

    Medium performers: One month to six months

    Low performers: More than six months

    LTC can reveal symptoms of poor DevOps practices: If it takes teams weeks or months to release code into production, there are inefficiencies in their process. One can minimize their LTC through continuous integration and continuous delivery (CI/CD). Encourage testers and developers to work closely together so everyone has a comprehensive understanding of the software. Consider building automated tests to save more time and improve the CI/CD pipeline.

    Because there are several phases between the initiation and deployment of a change, it’s wise to define each step of the process and track how long each takes. Examine the cycle time for a thorough picture of how the team functions and further insight into where they can save time.

    One should be careful not to let the quality of their software delivery suffer in a quest for faster changes. While a low LTC may indicate that a team is efficient, if they can’t support the changes they’re implementing or they’re moving at an unsustainable pace, they risk sacrificing the user experience. Rather than compare the team’s Lead Time for Changes to other teams’ or organizations’ LTC, one should evaluate this metric over time and consider it an indication of growth (or stagnancy).

    Deployment Frequency

    Deployment frequency (DF) is how often you ship changes; how consistent your software delivery is. This metric is beneficial when determining whether a team is meeting goals for continuous delivery. According to the DORA team, these are the benchmarks for Deployment Frequency:

    Elite performers: Multiple times a day

    High performers: Once a week to once a month

    Medium performers: Once a month to once every six months

    Low performers: Less than once every six months

    The best way to enhance DF is to ship a bunch of small changes, which has a few upsides. If deployment frequency is high, it might reveal bottlenecks in the development process or indicate that projects are too complex. Shipping often means the team is constantly perfecting their service and, if there is a problem with the code, it’s easier to find and remedy the issue.

    If a team is large, this may not be a feasible option. Instead, one may consider building release trains and shipping at regular intervals. This approach will allow the team to deploy more often without overwhelming your team members.

    Mean Time to Recovery

    Mean time to recovery (MTTR) is the average amount of time it takes your team to restore service when there’s a disruption like an outage. This metric offers a look into the stability of your software, as well as the agility of your team in the face of a challenge. These are the benchmarks identified in the State of DevOps report:

    Elite performers: Less than one hour

    High performers: Less than one day

    Medium performers: One day to one week

    Low performers: Over six months

    To minimize the impact of degraded service on your value stream, there should be as little downtime as possible. If it’s taking your team more than a day to restore services, you should consider utilizing feature flags so you can quickly disable a change without causing too much disruption. If you ship in small batches, it should also be easier to discover and resolve problems.

    Although mean time to discover (MTTD) is different from mean time to recovery, the amount of time it takes your team to detect an issue will impact your MTTR—the faster your team can spot an issue, the more quickly service can be restored.

    As with lead time for changes, you don’t want to implement sudden changes at the expense of a quality solution. Rather than deploy a quick fix, make sure that the change you’re shipping is durable and comprehensive. You should track MTTR over time to see how your team is improving and aim for steady, stable growth.

    Change Failure Rate

    Change failure rate (CFR) is the percentage of releases that result in downtime, degraded service or rollbacks, which can tell you how effective a team is at implementing changes. As you can see, there is not much distinction between performance benchmarks for CFR:

    Elite performers: 0-15%

    High, medium and low Performers: 16-30%

    Change Failure Rate is a particularly valuable metric because it can prevent a team from being misled by the total number of failures they encounter. Teams who aren’t implementing many changes will see fewer failures, but that doesn’t necessarily mean they’re more successful with the changes they do deploy. Those following CI/CD practices may see a higher number of failures, but if CFR is low, these teams will have an edge because of the speed of their deployments and their overall success rate.

    This rate can also have significant implications for the value stream: It can indicate how much time is spent remedying problems instead of developing new projects. Because high, medium and low performers all fall within the same range, it’s best to set goals based on the team and the particular business rather than compare to other organizations.

    Putting it All Together With DORA Metrics

    As with any data, DORA metrics need context, and one should consider the story that all four of these metrics tell together. Lead time for changes and deployment frequency provide insight into the velocity of a team and how quickly they respond to the ever-changing needs of users. On the other hand, mean time to recovery and change failure rate indicate the stability of a service and how responsive the team is to service outages or failures.

    By comparing all four key metrics, one can evaluate how well their organization balances speed and stability. If the LTC is within a week with weekly deployments but the change failure rate is high, then teams may be rushing out changes before they’re ready, or they may not be able to support the changes they’re deploying. If they are deploying once a month, on the other hand, and their MTTR and CFR are high, then the team may be spending more time correcting code than improving the product.

    Because DORA metrics provide a high-level view of a team’s performance, they can be beneficial for organizations trying to modernize—DORA metrics can help identify exactly where and how to improve. Over time, teams can measure where they have grown and which areas have stagnated.

    Those who fall into the elite categories can leverage DORA metrics to continue improving services and gain an edge over competitors. As the State of DevOps report reveals, the group of elite performers is rapidly growing (from 7% in 2018 to 26% in 2021), so DORA metrics can provide valuable insights for this group.

    But remember that data will only get you so far. To get the most out of DORA metrics, engineering leads must know their organization and teams and harness that knowledge to guide their goals and determine how to effectively invest their resources.

  • Don’t Let Developer Toil Affect the Business Value of Your Apps

    Don’t Let Developer Toil Affect the Business Value of Your Apps

    It is no surprise that the world today is driven by apps. Organizations all over the world are basing their business goals on their capacity to integrate new apps quickly, and they need to constantly reimagine how they interact with and communicate with their consumers and employees to fulfill changing expectations. To do this effectively, businesses need to operate at a high level of speed and agility. But in many cases, this isn’t happening. The phrase ‘move fast and break things’ could not be further from the truth when it comes to how enterprises approach innovation today. In fact, according to Forrester Consulting, 48% of executives say they haven’t changed their applications in a year or more. One reason for this may be that organizations are dealing with a high amount of developer toil and technical debt. Developer toil is the repetitive, predictable, constant stream of tasks that support the creation of software and how it’s run, but don’t actually affect the features in the software that people use. Or in other words “any activities that don’t directly create business value.”

    Typically, developers spend too much time on processes that could be automated or even eliminated. Ironically, this toil builds up over time as their organizations prioritize shipping features rather than addressing these problems in their overall software process. While developers can change their software quickly at first, just like debt in real life, if this toil and tech debt are neglected, it takes over and consumes the organization’s ability to grow. This results in long, infrequent release cycles. A feature that seemed simple and once took just 15 minutes now takes weeks, even months, to get in front of users.

    Conducting a Developer Toil Audit

    Anything you can do to speed up your software release cycle will improve the quality, resilience and business value of your software. Continuously addressing developer toil provides a significant boost to your organization’s software capabilities. For one of VMware’s customers, addressing developer toil reduced the time taken to introduce a new feature significantly–from 400 hours to just 24 by doing a developer toil audit and addressing key factors contributing to this technical debt.

    So how can organizations overcome developer toil? One way to do this is through a developer toil audit. This is a systematic process for finding, valuing and prioritizing fixing waste in your software process. First, the process finds wasted time and process debt in how you build and release software. Second, the process then helps you justify delaying working on features in favor of eliminating and automating your software creation process. The result is speeding up your software release cycle. The more frequently you can change and release software, even with just small changes, the more opportunities you must learn what works and put those features in front of customers, employees, and other users.

    The process of conducting a Developer Toil audit includes:

    1. Asking the right questions: A great way to uncover developer toil is to ask about people’s struggles, frustrations, and even boredom in the form of a tailored question set. We advise using questions that are specific to your organization in addition to general questions like “how long does it take to perform a full build?” For example, highly regulated organizations should ask about tasks involving compliance. Once the survey is completed, you can do some quick analysis to locate and prioritize developer toil.

    2. Combine into usable metrics: You now have a single metric for each type of developer toil. And by combining all the questions you create a single metric to track overall developer toil. Extra points for creating dashboards with visualizations! As with all such aggregate metrics, these are more directional than exacting—their job is to point you to problems that should be solved.

    3. Link these metrics to business value: A simple ranking of developer toil is better than nothing. However, before deciding which developer toil to address, we recommend linking each type of developer toil to the business value created by fixing the toil. Put briefly, the value you get will be related to the time saved, and, thus, the ability to ship more features in the future.

    The less time developers spend on toil, the more time they can spend on tasks that directly benefit the business. Another way of looking at this is plain old productivity: Developers can now do more with the same amount of time.

    Another important outcome is increased staff morale. The less time developers spend on boring, repetitive work—toil—the happier they’ll be. Stronger employee hiring ability and retention are (or should be) a strategic imperative for any organization that depends on software. Morale also increases software quality: happier people make better software.

    Slow Down to Speed Up

    With the survey results in hand, you should have a pretty good idea of which developer toil to fix. The last step is to do the usual product management prioritizing to weight fixing these items with other tasks you could do. These are strategic decisions that product managers need to make. To fix toil, you need to stop shipping features to free up time. You need to slow down the business. At the start, before product managers have been empowered to make these kinds of decisions, higher-level management should be involved to calibrate how much slow down you’re willing to put up with for future agility. The calibration you’re doing is this: If I fix one item of toil and ship just one feature (instead of two) this release cycle, then in the next release cycle I can ship four features. Humans are not great at that kind of bird-in-the-hand versus birds-in-the-bush thinking, so you’ll need to figure out what works in your organization.

    Through our experience as consultants working with product teams in different industries, we’ve used Developer Toil Audits to focus and motivate product managers and developers to fix toil and speed up their release cycles and, thus, improve how their organizations build software. This directly improves the business by adding more capabilities and capacity to deliver more features, even in the short term. Each time you fix any technical debt, you gain more capacity and capabilities to create new features and improve your software. This is how you use a modern software culture to increase business agility. Or, put more simply: Less developer toil leads to better software, and better software leads to better business.

  • 5 Mean-Time Reliability Metrics To Follow

    5 Mean-Time Reliability Metrics To Follow

    Most folks working in DevOps or SRE roles are familiar with metrics like mean-time-to-recovery (MTTR). Keeping track of the average time a team takes to respond to incidents is crucial to identifying bottlenecks in the support process. It’s also something executives like to show higher-ups when sharing a snapshot of overall platform performance. However, focusing on one single metric might be missing the greater picture.

    For example, how long did it take to discover the incident? How long did it take from discovery until action was taken? What was the timeframe between filing a ticket and updating all clients that had a bug? When can you say you’ve completely resolved an issue? As you can see, there are many potential metrics that could inform software reliability and the platform engineering process. “One number is never going to tell you a complete story,” said Emily Arnott, community relations manager, Blameless.

    I recently met with the Blameless team for a closer look into mean-time reliability metrics. Below, we’ll explore the nuances behind five different types of MTTX metrics and consider the business value of keeping tabs on each type.

    1. Mean-Time-To-Detect

    Mean-time-to-detect is a measurement of how long it takes, on average, to detect that an incident is present. This often happens automatically within a monitoring system. Perhaps a tool sends out an alert when latency meets a certain threshold, for example. But, detection could also come from other sources, such as a customer complaint.

    For example, consider Log4j. Perhaps a runtime vulnerability scanning tool noticed one of your components is impacted by a novel CVE and automatically sent a notification to the appropriate team channel.

    2. Mean-Time-To-Acknowledge

    Now, just because an incident is detected doesn’t mean it’s immediately acknowledged. Mean-time-to-acknowledge, then, is a measurement of how long it takes a human being to realize the incident and begin to act on it.

    In our CVE example, this would be the time between vulnerability detection and initial response. For example, the on-call incident manager received a vulnerability notification, read the exposure details and then filed a JIRA ticket and contacted the relevant team members.

    Many factors might extend mean-time-to-acknowledge. Perhaps someone isn’t logged into Slack, or a hardware issue stalls the notification. Alert fatigue may also get in the way, or there may be a reluctance to file a ticket and introduce more toil. Depending on the severity of the incident, someone simply might not believe the alert is worth responding to.

    3. Mean-Time-To-Recover

    Now, the following metrics are a little more open to interpretation, but we’ll do our best to define each. Mean-time-to-recover is the average time it takes to introduce a temporary fix after discovering an incident.

    For example, if a particular region is experiencing outages, engineers might temporarily divert traffic to a more stable server. This is not a permanent fix, but the system recovers and operations are generally unaffected. This helps maintain the status quo while a more permanent solution is ideated, tested and applied.

    4. Mean-Time-To-Repair

    Mean-time-to-repair (or restore) is the mean time it takes to issue a permanent repair to a system after discovering an incident. In order for a system to be considered fully repaired, it has to not just be working, but working robustly.

    For example, let’s say the incident in question involves performance issues. Perhaps a patch is issued to the core branch to remove bulky code that’s causing slow load times for clients. Mean-time-to-repair introduces a more permanent solution but still might not be the complete resolution to the problem.

    5. Mean-Time-To-Resolve

    Mean-time-to-resolve can be thought of as the average time between when an incident occurs to when the issue is completely resolved. Not only is the core codebase patched, but all clients reliant upon the software have been updated, as well. Lessons are learned and mitigation plans are set to respond to similar incidents or vulnerabilities in the future.

    Mean-time-to-resolve is about resolving the incident entirely, said Jake Englund, senior site reliability engineer, Blameless. This includes addressing the underlying fundamental contributors, completing all logs that remain on the back burner and following up with a retrospective.

    Using Mean-Time Metrics

    Mean-time metrics can provide a quantitative picture of incident response performance, which can be valuable for overall business operations. Mean-time-to-acknowledge, for example, can expose gaps in the remediation process, such as cognitive strife in reporting incidents, said Matt Davis, intuition engineer, Blameless. Understanding these technical and human factors are the first step to making the resolution process swifter.

    Of course, the above metrics rely on incident data, which may not always be a top priority. According to Davis, encouraging a culture that declares incidents—even minor ones such as a configuration change—can improve knowledge sharing within a team. “If you declare an incident, you could enact more systemic change,” added Arnott.

    Limitations of Mean-Time Metrics

    These mean-time metrics do have some limitations. “A number is only one part of the story,” said Davis. As a result, teams might struggle with deciding precisely what to detect. MTTR can be a helpful metric, but it’s the context that matters, he explained. Therefore, tracking multiple metrics can help provide a more sophisticated, nuanced picture. This involves looking beyond averages to consider outlier events, added Englund.

    There are also semantic nuances between the MTTX metrics defined above. “There’s a lot of ambiguity around these words,” said Davis. As a result, organizations might compute each figure differently. Some of these figures use time-markers which may not be technically possible to track consistently, especially since each incident is unique. Demarcating the precise moment an incident began might require guestimation. You might know when a service is fully restored, but the lasting customer perception is harder to gauge.

    Also, another potential downside is that mean-time metrics could easily be manipulated or misinterpreted, whether deliberately or inadvertently. Operations leads might selectively recall specific windows when showing MTTX metrics to higher-ups, leaving out other statistics that paint a different picture.

    Treat MTTX As A Guidepost

    Improving incident response is becoming mission-critical to maintain fully-functional systems as things like outages, downtime, slow speeds and zero-day vulnerabilities can negatively impact user experience. Sometimes, these issues must be addressed immediately to maintain SLAs.

    But tracking reliability averages isn’t all that simple, and they will likely mean something different to each organization. “It’s about embracing complexity and asking the right questions,” said Davis.

    In summary, mean-time reliability metrics provide helpful insight into the ongoing state of incident response. Yet, such metrics shouldn’t be imposed as a strict target — instead, they should be viewed as an informative guidepost. “Metrics can help you find what is discussion-worthy, but it’s not a discussion itself,” said Arnott.