Tag: metrics

  • Observe Inc. Brings Generative AI to Observability

    Observe Inc. Brings Generative AI to Observability

    Observe, Inc. today revamped the Hubble user interface to its observability platform that has been infused with generative artificial intelligence (AI).

    Fresh from raising an additional $50 million in funding, Observe CEO Jeremy Burton said as the company’s software-as-a-service (SaaS) platform continues to be infused with AI using multiple large language models (LLMs), it’s becoming apparent that observability is rapidly becoming democratized.

    Most IT organizations still rely primarily on legacy monitoring tools to track a set of predefined metrics. Observability platforms have arisen to aggregate metrics, logs and traces to enable DevOps teams to launch queries and surface the root cause of performance issues or IT incidents. The challenge is that most observability platforms have required IT teams to master a proprietary query language such as Observe’s RegEx.

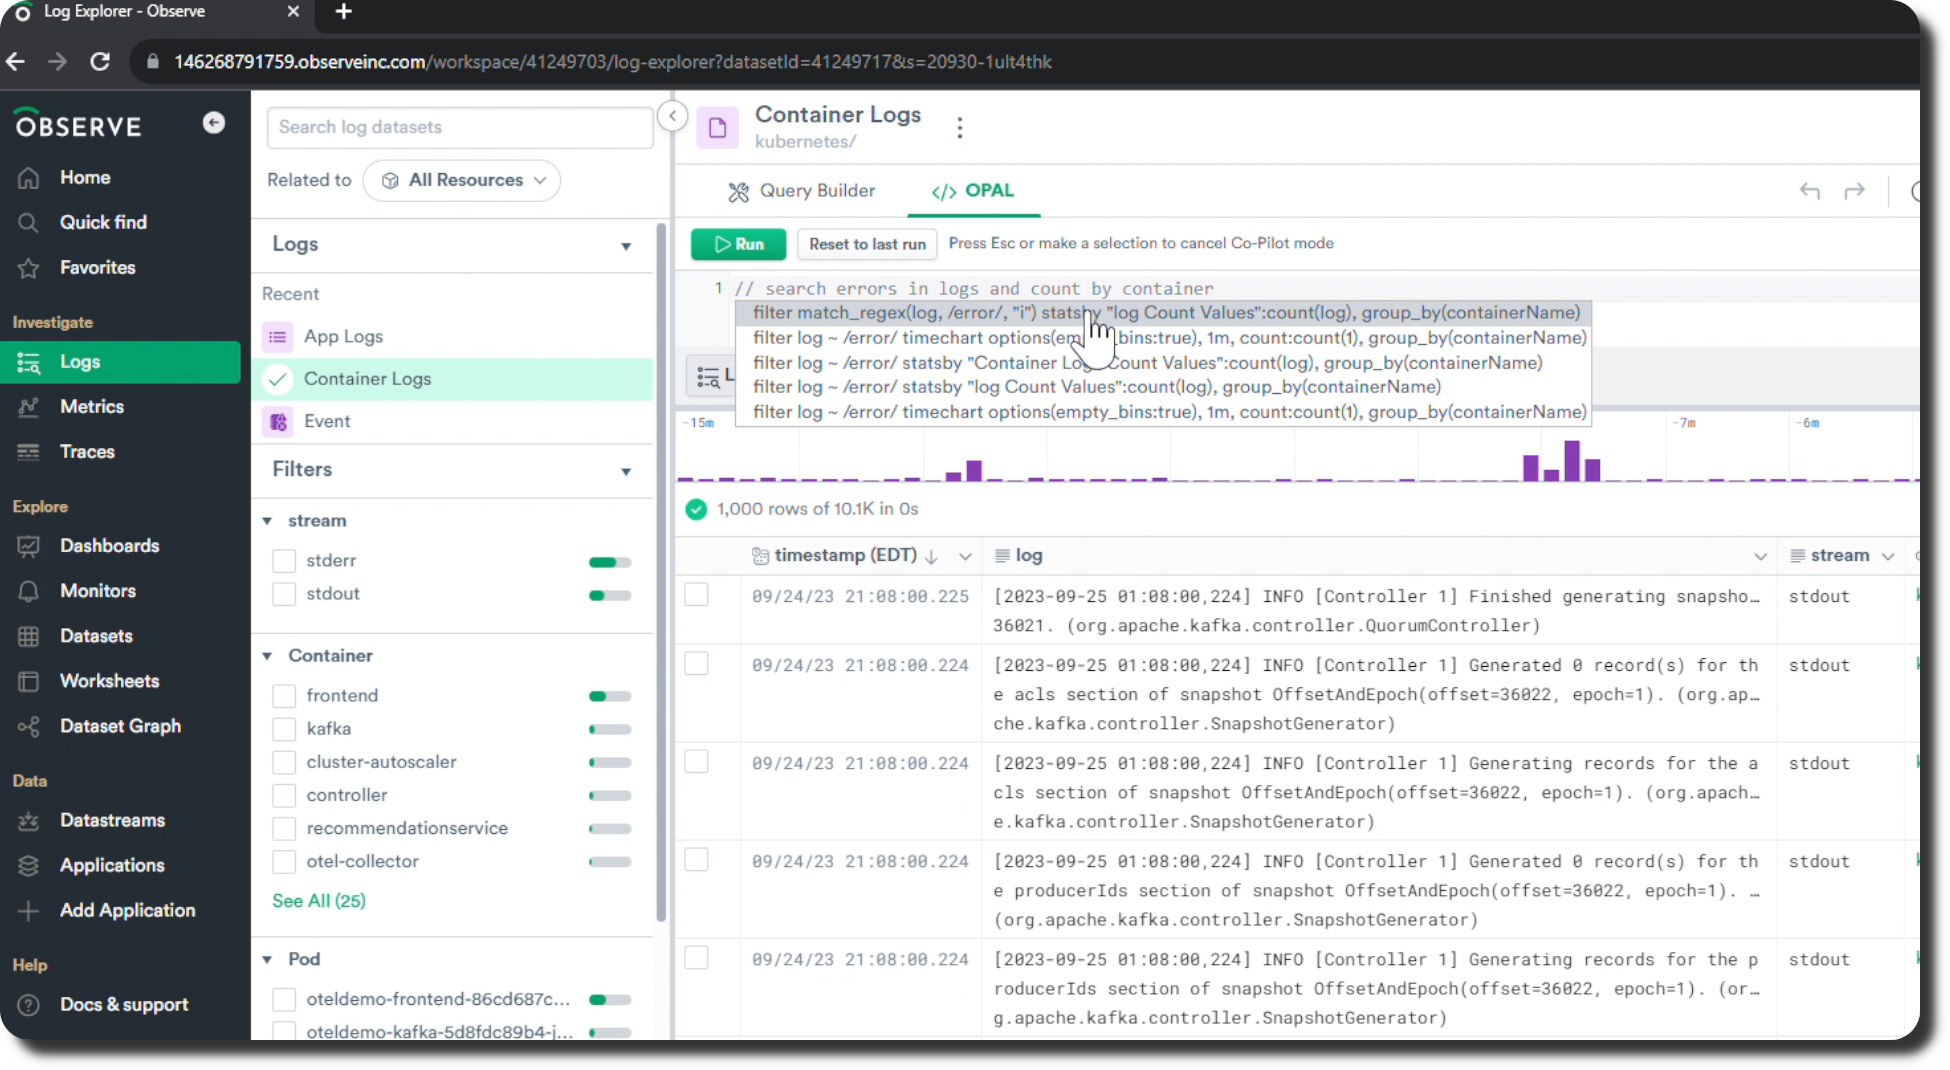
    However, with the rise of generative AI tools, it is now possible for IT professionals of all skill levels to employ a natural language chatbot to generate a RedEx query, noted Burton. A RegEx generation tool also parses data to add structure to logs on-the-fly, and there is also an OPAL Co-Pilot that generates OPAL code in response to natural language inputs.
    Observe

    The Hubble interface furthers those capabilities by simplifying the onboarding experience anytime there is a new member added to an IT team, he added. Hubble also expands the range of data access options available, including a public application programming interface (API), a command line interface (CLI), export to CSV and data sharing to the Snowflake cloud platform.

    IT teams are also coping with an explosion of telemetry data generated by modern distributed applications based on microservices architectures. Legacy observability and monitoring tools were not designed for these data volumes, so when there is an incident, the mean-time-to-resolution (MTTR) is increasingly extended. In contrast, the Observe platform now features a ‘Live’ mode that enables data to be queried in 20 seconds or less from when it was created.

    Other capabilities include an assistant embedded in Slack to help users troubleshoot issues and summarize threads for incident response.

    While it’s still early days as far as the adoption of observability platforms are concerned, there is already no shortage of options. The pending acquisition of Splunk by Cisco next year will cause more organizations to reevaluate their IT management options, so the pace at which organizations are transitioning to cloud-hosted observability platforms should increase, noted Burton. Even after the merger is completed, it might be several more months before Cisco integrates its AppDynamics platform with the observability platforms that Splunk added to its IT operational analytics platform, he added.

    In the meantime, IT environments are only going to become more complex. It won’t be feasible for most IT teams to manage highly distributed computing environments without some help from AI. The challenge, as always, will be finding the budget dollars needed to deploy an observability platform before the number of increased IT incidents makes the need for one painfully obvious.

  • Observability Leaders: The Mighty Minority Holding Their Own Against Outages

    Observability Leaders: The Mighty Minority Holding Their Own Against Outages

    The job of IT teams has become much harder thanks to the new realities of hybrid IT, with workflows occurring across on-premises and cloud-based networks and applications. Yet so much rests on your ability to respond to these challenges, all while managing the expectations of your customers and the health of your bottom line. With the growing complexity of ecosystems comes the need for better visibility, both into specific systems and across your entire stack.

    Observability solutions address this by providing visibility across your network, infrastructure, systems, application, database, digital experience and log monitoring.

    In other words, observability enhances your ability to observe your digital ecosystem with more transparency, more effective detection and more intelligent insights. Take, for example, the very timely and pressing issue of outages. On average, the typical business experiences nine brownouts or outages every month, lasting roughly twelve hours each and averaging $13.7M annually, according to new research we conducted at SolarWinds.

    Over the course of the year, that can add up to nearly 1,300 hours, with outages chipping away at your organization’s productivity, reputation and competitive edge.

    It’s not enough to monitor for these outages and address them once they take down your systems. Repeated or prolonged outages signify a gap in the enterprise’s ability to comprehensively monitor and understand its network’s internal state and performance. A robust observability strategy can preemptively detect anomalies and potential issues—before they become full-blown outages.

    According to new data from the 2023 IT Trends Survey released this month by SolarWinds, companies who’ve embraced observability tend to not only lead in detecting, remediating and preventing outages—they’re experiencing better business and IT outcomes, too.

    The technology professionals surveyed shared how observability is helping them achieve better performance, compliance and resilience in digital environments—and how you can follow their lead.

    Observability Drives Better Business Outcomes

    The observability leaders surveyed were 300% more likely to say their organization is doing extremely well with growing revenue and 250% more likely to say the same about their organization’s speed of innovation. Interestingly, they also reported a better employee experience: They were 388% more likely to rate their organization as doing “extremely well” with employee experience and also reported fewer and smaller skill gaps on their teams.

    So, how does embracing observability actually translate into better business outcomes? According to the data, observability leaders are…

    • Investing in top priorities: Data shows organizations using observability solutions to support the priorities most critical to their growth and success: Improve their customer experience (96%), enable faster innovation (71%), reduce time spent solving (71%) and detecting (60%) issues and increase operational efficiency (55%).
    • More automated and integrated: Observability leaders embracing automation and investing in tools that provide enhanced efficiency are 214% more likely to say they are doing extremely well with operational efficiency, 750% more likely to say they are doing extremely well with auto-remediation of complex alerts and 300% better at automatically collecting background diagnostic data for IT support staff.
    • Ahead on IT: The data found that those ahead of the curve on observability are also leading by huge margins when it comes to monitoring, detecting and resolving issues that could otherwise bring the business to a screeching halt. When it comes to IT, they are 233% better at auto-escalation of tickets, 213% better at auto-remediation of simple alerts and 36% better at settling alert levels based on historical behavior.

    How to Reap Observability Benefits in Your Organization

    All told, observability adoption is still in its early days. Only 1% of enterprises are already up and running using observability tools on a regular basis, while another third are undergoing the implementation process.

    That’s good news for other businesses who are ready to reap the rewards—it’s not too late to be an observability pioneer.

    If you’re interested in bringing observability to your own organization, start by addressing a few important factors that can help you sidestep challenges—such as the accelerating pace of change in technology (72%) or insufficient budget (58%)—that might otherwise obfuscate your observability opportunities:

    • Make sure your observability solutions are appropriate for multi-cloud environments: Multi-cloud environments have become standard for many companies because of the many upsides, but they can be challenging for IT teams to manage. Strategically accelerate your organization’s cloud migration with an observability solution designed for complex hybrid and multi-cloud environments​ to save a lot of headaches down the road.
    • Give your teams autonomy—and build toward autonomous operations: Observability brings your enterprise a step closer to autonomous operations. Autonomous operations, where IT systems can govern themselves, providing a proactive approach to addressing issues, rather than reactive, won’t replace your human teams but rather free up their time and brainpower to support the business and drive innovation.
    • Don’t ignore the database: Databases represent the most difficult ecosystems to observe, tune, manage and scale. They require significant computing power, tend to be memory-intensive and likely make up the bulk of your organization’s cloud spending. Tasks crucial to the health and functionality of your business—including troubleshooting, root cause analysis and remediation—simply cannot happen without full, transparent observability across the numerous resources a database needs to engage to do its job.

    Observability helps balance competing priorities and demystify application requirements while increasing your overall DevOps agility, efficiency and speed to market. Observability not only fosters transparency and collaboration but also encourages a system of ongoing review, which benefits the organization, IT teams and—crucially—your customers.

  • Cisco Acquires Splunk to Create Observability Powerhouse

    Cisco Acquires Splunk to Create Observability Powerhouse

    Cisco today revealed it has signed a definitive agreement to acquire Splunk for $28 billion in cash. The deal will add Splunk, one of the most widely-used platforms for managing IT operations, to Cisco’s portfolio, joining the AppDynamics observability platform in addition to a wide range of IT infrastructure equipment.

    Chuck Robbins, CEO of Cisco, told industry analysts the combined entity will be one of the largest software companies in the world. The Splunk and AppDynamics platform creates a comprehensive observability platform spanning applications, networks and hybrid cloud computing environments, Robbins added.

    By combining AppDynamics with the data collected by the Splunk platform, the combined company will be able to provide greater insights into IT operations than any other company, added Robbins.

    Splunk CEO Gary Steele said the acquisition represents the next natural, logical step for Splunk and furthers its long-term partnership with Cisco to keep IT environments secure and resilient. The two companies will also be able to apply artificial intelligence (AI) more effectively to IT operations, he added.

    In its most recent quarter, Splunk reported revenues of $911 million, with cloud revenue accounting for $445 million, or 29%, of the total. Total Splunk revenues are forecasted to be between $3.925 billion and $3.95 billion for fiscal 2024.

    Splunk previously acquired SignalFX, a provider of an observability platform, in 2019. It’s not yet clear how the platform might be integrated into the AppDynamics platform, but Robbins said there is little overlap between the observability platforms the two companies currently provide.

    The Splunk acquisition comes at a time when it’s becoming more apparent that the need for observability extends well beyond DevOps workflows as organizations become more dependent on software.

    Each IT organization will need to determine how long it will wait for the Splunk acquisition to close before investing further in observability. Historically, acquisitions of this scale have been accompanied by price hikes to help fund the merger once the deal is concluded.

    In the meantime, IT and DevOps leaders will likely revisit the way IT is managed in the months ahead. Splunk came to prominence at a time when most workloads were running in on-premises IT environments. While the bulk of workloads continue to run in those environments, many workloads deployed in the cloud are being managed using platforms designed specifically for those environments. Splunk has been making a case for a hybrid cloud computing approach that assumes the management of on-premises and cloud computing environments will become more unified.

    In theory, economic headwinds are driving more organizations in that direction to reduce the total cost of managing IT. But it’s just as feasible to extend cloud tools to on-premises IT environments as it is to extend legacy tools to the cloud. Despite the inevitable outcome, Splunk rivals will spend the better part of the next year coming up with offers to switch platforms both before and after the deal eventually closes.

  • Survey Surfaces Major Observability Challenges

    Survey Surfaces Major Observability Challenges

    A recent survey found the biggest obstacles to observability were the pace of technology change, IT blind spots and the complexity of modern applications. The survey polled 300 IT professionals to identify the biggest challenges they faced in achieving observability. The accelerating pace of technology change (72%) topped the list, followed by IT blind spots and the growing complexity of modern applications (58% each), and lack of funding (52%).

    The survey, conducted by SolarWinds, also found the typical enterprise suffered nine brownouts or outages every month, each of which lasted around twelve hours. The full cost of outages and brownouts averaged $13.7M annually for these enterprises, according to the SolarWinds report.

    Jeff Stewart, field CTO and vice president, global solutions engineering at SolarWinds, said the survey makes it clear that a lack of observability is having a material impact on businesses. Organizations are now moving beyond monitoring predefined metrics to embrace observability platforms that make it simpler to investigate the root cause of issues that adversely impact businesses; these businesses are more dependent on IT than ever, he added.

    In fact, the primary reason organizations are investing in observability is to improve their customer experience (96%), enable faster innovation (71%), reduce time spent solving (71%) and detecting (60%) issues and improve operational efficiency (55%), the survey found.

    While it’s still early days as far as achieving observability is concerned, a lot of progress is starting to be made as organizations realize that complex IT environments require a different management approach. IT teams can no longer afford to navigate multiple monitoring tools in what often turns out to be a vain effort to prevent brownouts and downtime, noted Stewart.

    In addition, many IT teams are becoming increasingly aware that the telemetry data collected via an observability platform provides the foundation for infusing IT operations with artificial intelligence (AI) capabilities, he added. The ultimate Holy Grail is to one day achieve autonomous operations, noted Stewart.

    There is, of course, no shortage of observability platforms, but Stewart contends that providers of monitoring tools such as SolarWinds are in the best position to help IT teams make the observability transition. Rather than ripping and replacing a monitoring platform, a more seamless transition that results in less disruption is preferable, he noted.

    Regardless of approach, observability platforms that enable IT teams to launch queries across complex distributed computing environments are becoming a necessity. Distributed computing environments often have more dependencies than IT teams can manually track. It’s only a matter of time before the most talented DevOps professionals start to migrate to organizations that provide them with the management tools and platforms required to succeed. Otherwise, the stress of managing a complex IT environment will only result in higher rates of burnout among DevOps professionals.

    It may be a while before observability platforms are pervasively employed across IT environments, but as it becomes clear that brownouts and downtimes result in a decline in revenue, business leaders will understand what’s required to maximize profits. In many cases, the answer will be an observability platform that surfaces the insights needed to proactively manage modern IT environments.

  • Mezmo Simplifies Management of DevOps Telemetry Data

    Mezmo Simplifies Management of DevOps Telemetry Data

    Mezmo has added additional capabilities to streamline the flow of telemetry data within DevOps workflows as part of an effort to make it simpler to surface insights and reduce the total cost of observability.

    The company has also added integrations with more data sources to the Telemetry Pipeline platform, along with controls that make it simpler to optimize data storage and usage. For example, an Events-to-Metrics Processor capability identifies and extracts metrics from logs to make them easier for third-party tools to consume.

    Mezmo CEO Tucker Callaway said these additions collectively make it simpler to surface insights that will make DevOps workflows more efficient. Previously, the company added capabilities such as rollback and redeploy, sequential parsing, error history management and data sample management to enable DevOps teams to manage telemetry data more efficiently.

    In effect, Mezmo is making it easier to apply engineering best practices to the massive amounts of telemetry data generated across DevOps workflows, he noted.

    No one knows for certain if all that data will require the addition of data engineers to DevOps teams, but as DevOps continues to evolve, it’s clear there is a need to cost-effectively manage data at scale. DevOps teams that embrace observability are quickly discovering that storing logs, traces and metrics for an extended amount of time can quickly become cost prohibitive. Naturally, there’s a lot more sensitivity to those costs during challenging economic times.

    In theory, of course, various forms of artificial intelligence should automate data engineering best practices, but in the meantime, there simply isn’t enough data engineering expertise available. The need for a platform to optimize the flow of telemetry data across DevOps workflows is becoming more acute.

    It’s not clear how quickly DevOps teams are embracing observability, but it’s clear that relying on predefined metrics to monitor IT environments is no longer sufficient. DevOps teams need to be able to query telemetry data to, for example, identify bottlenecks created by dependencies between microservices. Resolving those issues can’t be slowed down by a lack of data to query. Most problems can usually be traced back to a recent update to an application, but there are always going to be some issues that require access to historical data. That historical data should be quickly and easily available, especially since application downtime directly equates to lost revenue for many organizations.

    Observability, regardless of cost, is rapidly becoming a requirement for DevOps teams’ success as application environments become more complex in the cloud-native era. Dependencies between the microservices that make up those applications are too difficult to track and analyze without the aid of an observability platform. The challenge is not every observability platform provider is equally concerned about how much it costs to store all that data. Striking the right balance between the amount of telemetry data collected and the cost of storing it has become a much larger concern.

  • Webb.ai Launches AI-Based Continuous Root Cause Analysis

    Webb.ai Launches AI-Based Continuous Root Cause Analysis

    Webb.ai today opened an early access program access to a Continuous Automated Root Cause Analysis platform that uses artificial intelligence (AI) combined with a knowledge graph to dynamically keep track of and analyze changes to IT environments.

    Manish Gupta, CEO of Webb.ai, said the platform uses a mix of machine learning algorithms and generative AI capabilities based on large language models (LLMs) to aggregate alerts into higher-order insights that are presented in natural language to members of a DevOps team.

    That approach differs from legacy approaches because it tracks causal relationships between changes versus relying on probabilistic models that tend to create a lot of false positives, he noted.

    Webb.ai is also taking advantage of Kubernetes clusters to enable its platform to scale up and down as needed when analyzing data, added Gupta. That platform is also more efficient than other approaches to observability that require IT teams to store massive amounts of data. In contrast, the Continuous Automated Root Cause Analysis automatically surfaces anomalous events that DevOps teams can choose to save rather than requiring them to save all the metrics, logs and traces that would otherwise need to be tracked, he noted.

    Most IT incidents can be traced back to the most recent changes made to an IT environment. The challenge is as IT environments have become more complex, it’s not feasible for humans to keep track of those changes without relying on AI and a knowledge graph, said Gupta.

    As businesses become more dependent on software to drive digital processes, the cost of downtime is exponentially increasing. The need to identify the root cause of an IT incident as fast as possible has become a critical requirement, he added.

    Webb.ai doesn’t see AI technologies replacing the need for DevOps professionals and site reliability engineers (SREs) for at least another 10 to 15 years. In the meantime, many tasks that today are completed manually will be increasingly automated, said Gupta. A DevOps engineer dragged out of bed at 2:00 A.M. to address an issue does not want to have to sift through alerts. Instead, generative AI tools will summarize the issue at hand with recommendations on resolving it, noted Gupta. In effect, DevOps teams will be augmented by AI so they can manage IT environments at even higher levels of scale, he said.

    There is always going to be some sense of fear and loathing when it comes to AI, but ultimately, AI should reduce the burnout rates that today adversely affects any organization’s ability to retain DevOps professionals. Far too much time is spent trying to identify the root cause of a slowdown in a cloud-native application’s performance that could be caused by any number of issues involving one dependency or another. The frustrating thing, of course, is that while it may take days to identify the root cause of an issue, it often takes just a few minutes to resolve.

  • Roadie Adds Scorecard Tool to Backstage SaaS Platform

    Roadie Adds Scorecard Tool to Backstage SaaS Platform

    Roadie today made generally available a tool that automatically tracks and reports how software development teams are performing against engineering standards defined by a DevOps team. The Tech Insights tool is an addition to Roadie’s implementation of the open source Backstage developer portal and is delivered via a software-as-a-service (SaaS) platform.

    Roadie CEO David Tuite said Tech Insights is a proprietary tool that Roadie developed as an extension to its platform. Tech Insights provides scorecards that track software assets in the Backstage catalog and ensure they are meeting predefined quality and compliance targets.

    Tech Insights comes with built-in, pre-defined data sources; alternatively, DevOps teams can define them using external application programming interfaces (APIs) or files in a repository. A rule known as a Check can then be created to validate whether a project complies with the engineering standards defined by the DevOps team. Each DevOps team can create an unlimited number of scorecards.

    In addition, teams can create prompts and notifications to warn engineers when they are about to make a change that will violate an engineering standard. DevOps teams can also employ gamification techniques to show teams how their performance compares to others.

    While Roadie is now adding its first proprietary tool to the platform, Tuite said the company remains committed to enabling organizations to migrate their instance of Backstage to another environment should they ever deem it necessary, he added.

    Originally developed by Spotify, Backstage makes it possible to create and manage a catalog of blueprints that developers can readily consume rather than requiring them to repeatedly build these capabilities themselves. The goal is to create scaffolds that developers can consistently reuse across multiple application development projects.

    Spotify has since donated Backstage to the Cloud Native Computing Foundation (CNCF). However, Backstage currently requires a significant amount of DevOps expertise to set up and maintain, an issue that Roadie is addressing by making it available as a SaaS platform that can be accessed by any application development team, said Tuite.

    The concept of a self-service portal through which developers can address their own needs may not be new, but as an open source project, Backstage is lowering the cost of improving overall developer productivity. At the same time, many organizations are now embracing platform engineering as a means of centralizing the management of DevOps.

    Ultimately, every minute developers spend on tasks other than writing code is one less minute they are spending writing the business logic that drives an application. Measuring developer productivity is, of course, an inexact science. No one knows for sure when inspiration might strike, but if developers are busy maintaining code that they created to provision infrastructure, it’s less likely they’ll be struck by a flash of brilliant insight that improves and application. The easier it is to spin up a development environment, the more likely that inspiration will one day turn into code that runs in an actual production environment.

  • The Metrics Disconnect Between Developers and IT Leaders

    The Metrics Disconnect Between Developers and IT Leaders

    A survey of 350 software developers found a majority (91%) of respondents are unhappy with the actual metrics leadership teams are measuring.

    The survey, conducted by Atomik Research on behalf of Uplevel, an enterprise intelligence platform provider, found the top metrics developers say should be tracked include hours worked (52%), work allocation (49%) and the amount of time they have to focus on writing code (46%).

    Unfortunately, the survey also revealed more than half of respondents (56%) reported that the CTOs that lead software development efforts make significant strategic decisions without realizing the negative impact on their team. They also often move people around on projects or tasks without knowing the full implications (51%) and overwork developers (44%).

    Just under a third (30%) noted their engineering leaders rely solely on gut feelings to measure the effectiveness of their teams, while a third of respondents observed most engineering roadblocks go unnoticed by leadership.

    Additionally, 96% noted that not knowing what their own leadership team is working on is detrimental to the larger team.

    Christina Forney, vice president of product management for Uplevel, said many CTOs clearly need to be more engaged. Developers don’t mind being measured, but they clearly want to be evaluated based on metrics that matter, she added.

    Managing software development teams has become a lot more challenging in an era where many developers are working remotely. IT leaders can no longer manage by walking around as easily as they once did, said Forney. Aligning workflows across a highly distributed team of developers is a challenge no matter how many communications platforms are used.

    Surprisingly, the Uplevel survey found more than half of respondents (54%) said they feel more productive in the office. More than a third (35%) also said they preferred some form of synchronous communication to engage with other members of their team versus 27% that preferred some form of asynchronous communication. A total of 38% said they preferred a mix.

    It’s no secret that despite long-standing commitments to automation, there are still a lot of manual processes in DevOps workflows that create bottlenecks. In an uncertain economy, however, there’s a lot more focus on developer productivity, so eliminating DevOps bottlenecks has become a major priority. The challenge is those bottlenecks are not as apparent to senior IT leaders, many of whom may have simply become inured to them over time.

    Regardless of how bottlenecks occurred, DevOps teams would be well-advised to reevaluate the metrics they track. Mean-time-to-recovery (MTTR), for example, is not as important a metric to the business as the amount of quality code that finds its way into a production environment.

    In theory, all the data required to track more meaningful metrics that could improve productivity already exists in the tools and platforms DevOps teams use to build and deploy an application. The challenge has been finding a way to automatically surface that data without adding yet another bottleneck to a DevOps workflow.

  • Mezmo Adds Free Community Plan for Managing Observability Data

    Mezmo Adds Free Community Plan for Managing Observability Data

    Mezmo this week added a free trial and a community plan for the Mezmo Telemetry Pipeline service to make it simpler for DevOps teams to store and manage the large amounts of telemetry data they are collecting.

    Mezmo CEO Tucker Callaway said as more DevOps teams embrace observability to minimize disruptions to application environments, they are struggling to manage the explosion of data being created. The Mezmo platform makes it possible to apply data engineering best practices to manage that data using a set of drag-and-drop visual tools, he added. A set of data transformation tools also makes it simpler to extract metrics embedded in the logs, summarize events and metrics and then forward those metrics to downstream platforms for analysis.

    The free edition of the platform makes it possible for organizations to begin to apply those capabilities without any upfront costs required, noted Callaway.

    It’s not clear to what degree DevOps teams may need to add data engineering to manage all the telemetry data being collected. It’s already apparent that the cost of storing and managing all that data is becoming a significant issue as more applications are instrumented. In fact, it’s nearly impossible to manage cloud-native applications without being able to observe interactions between the microservices used to construct them.

    Log management has always been a challenge, but with the addition of traces, the amount of telemetry data being collected to surface metrics has increased. The Mezmo platform makes it possible to set a daily or monthly hard limit on the volume of logs stored or, alternatively, set soft daily or monthly quotas that can apply throttling logic to ensure mission-critical log data will continue to flow.

    DevOps teams can also make use of soft limits to reallocate storage resources from one team to another based on how much log data might be generated for a specific amount of time.

    Reducing storage costs has naturally become a higher priority during challenging economic times, so there’s a lot more pressure for DevOps teams to be more efficient. Finance teams are reducing costs by, for example, applying quotas to the amount of storage resources being made available to individual DevOps teams. The days when cloud storage resources were made available indiscriminately are over.

    It’s not clear how quickly DevOps teams are embracing observability, but it is certain that relying on predefined metrics to monitor IT environments is no longer sufficient. DevOps teams need to be able to query telemetry data to, for example, identify bottlenecks that are often created by dependencies between microservices. The issue is striking a balance between the amount of data being collected and the cost of storing it all.

    Regardless of approach, observability is rapidly becoming a requirement for DevOps teams to succeed. In fact, there is already no shortage of observability platforms to choose from. The issue is that not every observability platform provider is equally concerned about the cost of storing all the data being collected.