Tag: metrics

  • Continuous Deployment and Monitoring of Microservices

    Continuous Deployment and Monitoring of Microservices

    Continuous deployment and continuous monitoring have grown up in DevOps, and microservices have grown up as a delivery platform. While all are relatively stable concepts at this point, there are still a fair number of practitioners that are struggling with the merging of these concepts to create a holistic environment that allows for deep understanding and easy deployments.

    So I thought we could take a look at what’s out there, how it’s going, and even mention a resource or two for you.

    Continuous Deployment

    While continuous delivery (CD) and continuous integration (CI) are well in hand, continuous deployment has lagged a bit behind. There are reasons—both good and bad—why this is true, but true it is. Continuous deployment is the act of actually deploying the results of the CI/CD cycle. The whole point of continuous deployment is to speed the release of new features to market by releasing them as soon as they pass the CI/CD muster, or soon after, or for some industries, on demand. Continuous delivery is a little different from CI/CD in that the rest of the organization—sales, support, marketing, accounting, etc.—have to be ready for the release, so in the slowest case, the point is that IT is not the hold-up to releasing new features under the continuous deployment model.

    Microservices

    Simply put, microservices are decomposition of an application into smaller parts that can be run independently. There are a lot of different ideas for what “smaller parts” means, with some shops breaking their application down to the functional level similar to serverless functions, so an API named calculateSalesTax would do that and only that, given location and dollar information, while others prefer a more broad definition that includes entire groupings of APIs. In this scenario, one company split all database work into a single microservice that was scalable. Either way, you will have more instances (normally containers, but sometimes VMs or even physical servers) running to build the application than historically would be the case.

    Why Containers

    As mentioned above, normally a microservices architecture is built on containers. The portability of a container definition is one of the major reasons why companies lean this direction. The ability to say, “This container can run on our hardware, on our private cloud, on a public cloud, in a public cloud VPC or on a VM,” is a way to ensure that you can target the system to the environment most suited to the organization’s needs.

    Containers are also far lighter than VMs, meaning faster spin-up times, and an easier time expanding the microservices architecture to meet changing user needs.

    Container Management

    Speaking of containers, container management systems are used to make certain that containers are alive and responding. In advanced cases, they can be made to check that a container is doing what it is supposed to do also. While I am a fan of Apache Mesos, the world seems to have gone for Kubernetes, so we’ll focus on it, without further reference to the others out there.

    On top of making certain the correct number of a given container are running, and taking steps to spin up new ones if one disappears, Kubernetes does things such as manage secrets for containers, perform load balancing between instances in a group (these groups are generally called a service in container management speak), scaling up/down of instances as directed, and provide rolling updates to services so the service is not down while being updated.

    This makes a container management tool an important part of any continuous delivery and continuous monitoring effort.

    Taken together

    That gives us tools including Jenkins for CI and CD, and often for release management, though other tools specialize in the release portion, too. Combine Jenkins with an infrastructure-as-code solution such as Teraform or any of the others we’ve discussed in the past. Add in a tool such as Prometheus for gathering monitoring data, and a tool such as Grafana for visualizing the data, and you’re on the road to continuous delivery and continuous monitoring.

    Of course, it isn’t that simple, I’m overviewing here. While researching this blog, the people at Infostretch shared some information with me, and they too would see this as the 50,000-foot view. But that’s where we start. For a more complete picture, here is a simple diagram of continuous deployment that Infostretch shared with me:

    And as long as we’re discussing the information that Infostretch shared with me, let’s also look at a sample of what the company monitors. You’ll see it isn’t “everything under the sun,” but focused points that give them actionable intelligence. A few application-specific monitoring points from within the application, and this turns into an application performance gold mine.

    Classification Metrics
    Cluster Metrics Overall Cluster Memory Utilization
    Overall Cluster CPU Utilization
    Overall Cluster FS Utilization
    Multi-series graph for individual service CPU Utilization
    Multi-series graph for individual service Memory Utilization
    Multi-series graph for individual service FS Utilization
    Application Metrics


    Service Request rate
    Service Error rate
    Service latency

    There is so much more

    There really simply isn’t enough room in a single blog to cover all that is required and possible in continuous delivery and continuous monitoring. I’ll continue to try continuous blogging to help you out, and the other authors here on devopsy.kinsta.cloud have good things to share on the topics also.

    — Don Macvittie

  • Quality Culture, DevOps Forge Better Connections Between IT, Lines of Business

    Quality Culture, DevOps Forge Better Connections Between IT, Lines of Business

    The automation of software development does not obviate the need for a collaboration between IT and the lines of business, or the development of a culture of quality on the part of the development team. Achieving that quality culture requires more than a change in mindset as developers seek to align quality with the speed and automation goals of DevOps.

    There are five items required for a quality-driven DevOps environment:

    1. Understanding the proper role of “minimum viable product”
    2. Collaboration between IT and lines of business
    3. Having metrics in place
    4. Across-the-board buy-in

    “Quality culture is characterized by employees who are motivated to consistently strive for the highest level of quality,” said Al Riles, principal consultant at Tunnell Consulting, a firm providing solutions to the complex problems faced by life sciences and biopharma companies. “That’s one key component of it, as well as the ongoing process of continuous improvement.”

    Minimum Viable Product and Continuous Quality

    Aligning quality with the speed and automation goals of DevOps is critical to success, and part of this is gaining a deeper understanding of the role of “minimum viable product” and understanding when that approach contributes to the development process.

    “The concept of ‘minimum viable product’ does not, as its name would suggest, contribute to a substandard product,” said C.R. Venkatesh, CEO of Dot Com Infoway, a CMMI Level 3 IT company. “Quite the contrary, the concept is the basis of continuous and iterative improvement, and encourages the use of user feedback, which often results in insights that might be missed by the in-house team.”

    The concept of quality culture and MVP are not mutually exclusive in a DevOps environment, so long as continuous improvement is part of the equation.

    Collaboration Between IT and Lines of Business

    The collaboration that is a key part of DevOps is also a key part of quality culture. “You have a culture in place where everyone embraces that fabric that includes the right type of behaviors and the right values, including communication, reward and recognition, as well as clarity on roles and responsibilities,” said Riles. “That working fabric gets well-defined, because everyone is functioning around the same key elements that constitute that strong corporate culture.”

    “Collaboration has always been important in a DevOps environment,” said Venkatesh. “But we need to define precisely where that collaboration exists. In an internal environment, that collaboration is between IT and lines of business. Increasingly though, IT and development is an outsourced function, and in such cases, that collaboration must be preserved. What this means is that it exists not just within the confines of the outsourcing provider, but also between the provider and the client. The developer must seek out alliances not only with the client’s sourcing manager, but also with other internal stakeholders in the project.”

    If You Don’t Measure, it Doesn’t Exist

    Quality initiatives require an active role in changing the mindset of all stakeholders, but mindset alone won’t get the job done. Metrics must be in place and tied to those quality initiatives. “Even in the smallest of development projects, defined quality metrics must be set ahead of time, with clearly defined outcomes,” said Venkatesh. “By asking what we hope to accomplish with a development project, clearly defining the goals and adhering to a set of predefined quality standards, developers—whether in-house or third-party—are able to accurately predict what the outcome will be.”

    Riles’ process involves a quality management maturity grid, which identifies multiple dashboards. “It allows the organization to become familiar with what a quality organization consists of, and then you can use this maturity grid to measure where the organization is once you embrace this initiative. Then, you can implement the initiative, and come back and re-evaluate yourself to see the progress you’ve made,” said Riles.

    Everybody Has a Seat at the Table

    Incentivizing all stakeholders, throughout every level of the company, is paramount and, according to Riles, “It has to do with communicating what the vision is, and having a clear quality message that’s coming from leadership. Then, there has to be a shared quality mindset among all staff.” Riles notes that the quality mindset is shared by everyone in terms of understanding the organization’s objectives, policies and procedures and their roles in hoping to achieve them.

    This is reinforced by leadership at all levels, who are actively engaged in supporting the development of a quality culture, and they engage and motivate others to do the same. For it to be sustainable, we realize that success is based on the sum of all parts of the organization. They must be continuously monitored and fine-tuned as the organization grows, and this includes communication, reward and recognition, and engagement.

    About the Author / Dan Blacharski

    Dan Blacharski is a thought leader, advisor, industry observer and PR counsel to several Internet startups, and author of the book “Born in the Cloud Marketing: Transformative Strategies for the Next Generation of Cloud-Based Businesses.” He has been widely published on diverse subjects relating to cloud computing and technology, and he is editor of BoozeHub.com. He lives in South Bend, Indiana with his wife Charoenkwan and their Boston Terrier, Ling Ba.

  • Spurring the DevOps Adoption Journey

    Spurring the DevOps Adoption Journey

    Every few years, the IT canvas is splashed with a new initiative that sparks enthusiasm among businesses and technologists alike. DevOps is one such philosophy gaining significant momentum in today’s digital transformation landscape. At the same time, the concept remains misunderstood and adoption is slow.

    DevOps embodies Development plus Operations within software development. Traditionally, these two parts of an organization have operated siloed from one another with marked differences in both ethos and approach. The result: delays in launching products and releases to the market. The fundamental principles of DevOps are to reduce barriers between Development and Operations; increase Development autonomy; and to automate Development and Operations activities to reduce wait time (and waste from a customer’s perspective), thus enabling faster time to market—all while keeping the end customer at the center.

    Planning the Adoption Journey

    Here are four different aspects an organization should consider before starting the DevOps adoption journey:

    Conduct an as-is continuous delivery assessment on product development practices and processes within the organization

    This will best determine an organization’s current maturity level across several different parameters, including:

    • Culture and organization
    • Build management and continuous integration
    • Environments and deployments
    • Release management
    • Testing and verification
    • Data management
    • Design and architecture
    • Information and reporting

    This process also includes identifying current automation levels and opportunities to automate, inclusiveness of tools and environments supporting continuous delivery, and an assessment of existing product design to determine if it lends itself to frequent and fast deployments.

    Map the journey of a piece of code from a developer’s desk all the way to when the consumers use it

    Utilizing a development pipeline assessment to study the life cycle of a piece of code through its journey from a developer’s desk to production will best identify “waste” during the life cycle. This assessment should bring out critical information, including the number of environment hops, test pyramid maturity and level of continuous testing, level of provisioning and deployment autonomy and its automation.

    Establish a culture of inclusiveness, autonomy and a sense of a ‘common goal’ within the organization

    Product management, development and operations teams should have a common mission and goal for the product, sprint or release they are working on. The definition here should be the value delivered to the customer as opposed to the value of code, test results, or individual deployment steps. Including operations roles within a close-working scrum team benefits this cause by:

    • Bringing in common views on what a product, release or sprint is intended to deliver.
    • Creating an opportunity to bring forward and address operations needs during the development cycle.
    • Creating a better understanding of mutual expectations and empathy for delivering outcomes that meet customer expectations.

    Measure and track

    Finally, determine parameters the organization would like to establish to track progress towards a successful adoption. The key here is to have a few, simple metrics that truly reflect “value to the end customer.” Here are a few commonly considered metrics:

    • Production deployment frequency: The number of product releases within a specified time.
    • Average lead time for a production change: The typical amount of time it takes for a piece of code to traverse from a developer’s desk through production.
    • Average production recover time: The time taken to bring back production systems after an incident involving a release, release rollback or system outage.
    • Change failure rate in production: The number of releases that did not stick in the live environment and needed either a rollback or an immediate emergency fix.

    The goal and a true measure of successful adoption would be an improvement of all these parameters over time. Internally, they would require strong engineering rigor and cultural realignment to be able to improve these customer-facing metrics.

    Navigating DevOps adoption successfully is neither easy nor fast for a number of reasons. DevOps encompasses different parts of the organization, which historically may have operated in silos and with different ethos. DevOps also questions the status quo regarding engineering roles and practices, and focuses on automation and reskilling, all of which need both upfront time and effort investment. Finally, DevOps believes in and propagates continuous learning and improvement, whereas many organizations may have more stepwise-based programs in place.

    For a midsized IT organization, it could take anywhere from 18 to 24 months or more to be able to reach a reasonable steady state. That’s why it is important to carefully craft a charter that encompasses the above parameters before embarking on this DevOps adoption journey.

    About the Author / Amit Gupta

    Amit Gupta is leader of Ness Digital Engineering’s DevOps practice. He has several years of software delivery background. He has keen interest and has developed deep expertise in establishing practical software development processes especially for globally distributed teams. Amit currently leads Ness Digital Engineering’s DevOps practice, and engages with several customers on such areas as improving engineering effectiveness, engineering tools and process transformation. Connect with him on LinkedIn.

  • Improving DevOps Success with Well-Defined Metrics

    Improving DevOps Success with Well-Defined Metrics

    Collaboration within diverse project teams is often more difficult to achieve when there is no clearly visible aim, the planning is haphazard and the information shared is inadequate. However, these are crucial hurdles to overcome in any organization—and more so in product companies with globally distributed teams working on different parts of the product pipeline.

    Successful product development requires effective and constant communication between various teams through well-defined metrics, not only to reduce the engineering operations overhead but also to improve on the overall engineering deliverables.  These metrics, including  ROI or profitability, mean time to recover and deployment frequency provide a clearer picture to an engineering or business owner on how the Dev and Ops teams are working, their adherence to processes and guidelines and the technology they’re using.

    Every engineering owner likes to know if the technology investment they make is going to yield a significant ROI. It is no different with DevOps. It is important to identify the exact metrics by which the positive impact of DevOps can be measured.  The most effective way to illustrate these metrics in a way that would make sense to senior management is revenue impact.  Here are a few of them which have had proven success on internet of things (IoT) projects.

    Business metrics such as cycle time impacts incremental sales and customer satisfaction. Whereas other business metrics such as product investment and running costs impact profitability, DevOps implementation effectiveness can be measured by both. Cycle time is, in turn, derived from a number of product features delivered, sprint velocity and release planning metrics. The lower the cycle time, the more features get pushed and impacts the go-to-market. It also results in potential incremental revenue in terms of the value brought by reducing the cycle time.

    Another dimension to measure DevOps impact is engineering metrics. Companies today are worried about the cost of downtime in the operational phase as much as they worry about time it takes to bring the product to market. DevOps metrics are valid throughout the end-to-end implementation of a project.

    Build automation and code quality analysis, for example, can provide significant savings in build cycle time and build rollout time. Automating deployment process improves time to deploy and sprint velocity. Continuous testing improves mean time to resolve, and CloudOps monitoring tools can help reduce mean time to recover and uptime of any application. Further collaboration in automation through ChatOps tools can help improve mean time to respond. Once set in motion, all these matrices start improving the product quality, which leads to less rework. Intelligent automation also incurs direct productivity benefits.

    Organizations now measure these codes to release the metrics at the end of the day to get maximum ROI. A lot of these metrics also depend on the DevOps capability maturity. Organizations at the higher end of the maturity spectrum would tend to measure all of these metrics and try to optimize them. Also, the emphasis of these metrics vary with the domain and stage of the product life cycle being worked on. Home automation companies developing their IoT platform, for example, would emphasize build and deployment metrics, whereas companies in industrial automation with large infrastructure deployment would look at CloudOps monitoring metrics more closely. For telematics companies, test automation metrics become important when there is limited time and bandwidth to capture the data.

    DevOps is a cultural transformation and most of the time businesses measure the effectiveness in a very obvious way. However, a change in the way the organization operates should be looked in such a way that the metrics can generate long-term value. Thus, continuous measurement of the DevOps practice should also become one of the major focus areas of DevOps teams.

    About the Author / Urvashi Babaria

    Urvashi Babaria is a Product manager at eInfochips working in new age areas like IoT, DevOps and CloudOps. She is a techno commercial marketer with nine years of experience in product and project management, business analysis and transformation. She has keen interest in areas of data science including visualization, analytics and modeling. You can start a conversation with her at urvashi.babaria@einfochips.com

  • Measuring What Matters in Evaluating Software Performance

    Measuring What Matters in Evaluating Software Performance

     When developing and deploying a new feature or application, performance (speed, reliability) must be closely analyzed. After all, there’s no benefit to delivering a product if it doesn’t work well or users are forced to stare at a spinning wheel. To get a true view of performance, many organizations rely on metrics—a smart move since metrics, much like the scale, do not lie. Right?

    Unfortunately, that’s not always the case. Even when metrics are used, there often are different interpretations of performance, as well as debate over which metrics should be used in the first place. Metrics can be biased and manipulated, but does that mean we should stop using them? Of course not. Instead, we must learn to weed out bias and metric manipulation.

    What is Bias?

    Bias is not a bad thing; everybody is biased to some degree. Bias is defined as a particular tendency, inclination, feeling or opinion, especially one that is preconceived.

    Two common biases are anchoring and confirmation bias. Anchoring is the tendency to rely on a single piece of information, usually the first piece of information we encounter. The statistics presented first will most likely be remembered and drive decisions, responses and reactions.

    Imagine you’re about to launch a new application, but before doing so you run some performance tests to see how fast the application loads. The initial tests show the load time is 10 seconds. That’s too high, so the team looks for ways to improve performance. A few weeks later response times drop to 6 seconds, a 40 percent improvement. That’s great, and everybody celebrates. But what if initial tests showed page load times of 4 seconds and a few months after launch times crept up 40 percent to 5.6 seconds. Would you still be celebrating? No, you would be looking at what went wrong and trying to fix it. The initial anchor influences whether you see a time as positive or negative. 5.6 seconds is better than 6 but the initial anchor makes 5.6 seem worse.

    Confirmation bias is the tendency to interpret and search for information that confirms a pre-existing hypothesis. If you believe a new feature does not add value to an application, you may be more likely to focus on negative statistics rather than positive ones. If testing shows application load times will increase 15 percent with the new feature, you may use that as proof to delay or stop the release of the feature. If, however, you think the feature is a real game-changer, you will find the research about the 20 percent rule, which says people perceive changes in speed when the difference is at least 20 percent faster or slower. A change in 15 percent won’t be perceived by users. At the core, confirmation bias is about ego and not wanting to be wrong.

    The first step to avoiding biases is acknowledging they exist and everybody—yes even you—is susceptible. But there are ways to avoid them, or at least minimize their impact. Create your own anchor. Do research to determine what is an acceptable response time and use that as the anchor point. Search for facts that support and oppose your viewpoint, and don’t stop with a single site or fact; find multiple sources. Foster an environment where disagreement is encouraged in a positive and constructive manner, and listen to the dissenting viewpoints. Ask better questions and be willing to accept the answers even if they aren’t what you were seeking.

    Avoiding Metric Manipulation

    Metrics should be actionable and tied to business goals as opposed to being purely “vanity metrics”—those metrics that may make everybody feel good, but don’t reflect the true user experience and the consequent impact on the business.

    Specific to measuring web performance, there are countless metrics that can be selected to determine whether a user experience is positive or negative. If you choose to measure the time to the onload event as the core metric, you can recode a page to defer items to after the onload event. The metric will go down, teams will celebrate, but did this have any impact on the user experience? Was the goal really to reduce onload time or was it to better satisfy end users through a faster site in their eyes, increasing conversions and time spent on site?

    Here is a quick checklist you can use to choose the right user performance metrics:

    • Do improvements or declines in this metric impact what really matters: the user perception and business performance? Can this correlation be clearly made? How will this metric show progress towards the businesses goals and objectives?
    • Can the metric be gamed or influenced? Once something is being measured, people may look for ways to game the system and show improvement when in actuality there is none.
    • Is the metric “good enough”—i.e., the best one available, although it may not be perfect? Though not a performance-related example, popular website Medium’s choice of top-line metric illustrates this approach. While most websites rely on unique site visitor numbers as the ultimate gauge for their success, Medium, which views high user engagement as their key success factor, instead measures the time users spend reading articles on the site. This may not reflect the totality of user engagement (visitors who come to the site, but may just scan, not read) but it’s good enough and a more realistic indicator than alternatives.

    Whether we like it or not, people are heavily guided by bias and emotion, and they often manipulate reality (even subconsciously) to support their own motivations. Performance metrics are and always will be central to evaluating software performance, but it’s not enough to just lay out the facts. Organizations must frame and present metrics appropriately and sufficiently, and focus on those that are the most relevant and reliable. These are the keys to delivering the most complete, impartial canvas of performance information, helping guide the best decisions in the interest of the business.

    About the Author / Dawn Parzych

    Dawn Parzych is Director of Product and Solution Marketing at Catchpoint. She enjoys researching, writing and speaking about trends related to application performance, user perception, and how they impact the digital experience. In 15+ year career, Dawn has held a wide variety of roles in the application performance space at Instart Logic, F5 Networks and Gomez. Connect with her on LinkedIn.

  • Avoid Crashes: 5 Best Practices for Load Testing

    Avoid Crashes: 5 Best Practices for Load Testing

    Demanding customer expectations and the rapid distribution of information across social media have made website and applications crashes an off-limits path for today’s companies and organizations.

    Crashes resulting from traffic spikes cause immediate and long-term loss of sales, as well as tarnishing the brand name. When servers or websites go down during highly anticipated events such as Black Friday, the Big Game or before a major concert, the repercussions can be permanent.

    Yet, avoiding the “website temporarily unavailable” screen is also easier than ever before. By performance testing your website continuously and proactively you can easily detect errors, bottlenecks and bugs, and then fix them to ensure your website handles any amount of traffic.

    Here are five best practices for load testing your website or app:

    Define Your Load Goals

    Before starting your tests, you need to figure out what it is that you need to test.

    This includes the number of concurrent users, traffic patterns and areas that users can visit on your site. For example, if your site has 10,000 users concurrent at its peak, but  3,000 arrive in the morning and that total slowly climbs up to 10,000 in the afternoon—and these visitors mostly just browse your homepage—you’ll need to run a different test than if you have 10,000 concurrent users on your website all day long, constantly browsing multiple pages.

    To determine your load goals, you need to engage directly with your business colleagues. For instance, get your product manager to set the system’s expected abilities, ask the marketing team to inform you about any special campaigns that might increase website traffic, and then look at server logs and tools such as Google Analytics to determine previous customer patterns.

    Choose Your Load Testing Tools

    There are multiple open-source load-testing tools that you can use to run your tests.

    JMeter is the most popular tool, but you can also use Gatling, Locust, Tsung, The Grinder or Selenium. See here to learn more about the differences between these toolsets.

    Does this seem complicated? Taurus is an open-source automation test framework that simplifies running these tools, by using a simple YAML script. If you need to run your tests from the cloud, utilizing rich analytics or requiring user collaboration, you might consider using BlazeMeter.

    Take Your System to the Limit

    To make sure you stand up to your load goals, you need a buffer; specifically, you need to make sure that your system can handle heavier loads.

    This ensures that the CPU stays low and you don’t experience memory leaks. However, we also recommend you take your system to the limit and see when and how it fails. This ensures that you know exactly what your system’s weaknesses are, giving you a better ability to fix any errors that might occur.

    This is especially important if you come across an unexpected traffic spike—say, if your competitor’s website crashes and all their customers come running to you. Wouldn’t you rather be prepared for that?

    Monitor Test Results

    Set aside resources for looking at test results.

    Examine KPIs including Response Time and Hits/s, as well as the correlations between them, to learn what your system’s abilities and bottlenecks are. This information will help you see what needs fixing.

    As you continue testing over time, you will be able to identify KPI trends, which will help you monitor system health. We also recommend you monitor backend KPIs like DB Queries, with APM tools.

    Test Again

    So, you’ve tested, you’ve analyzed, and you’ve fixed.

    Now you have one last thing to do: Run your tests again to make sure everything is working smoothly after the committed changes. That ensures nothing gets overlooked. It would be a shame if all your hard work went down the drain due to a minor oversight.

    Now, let’s get testing!

    To get more load testing tips, check out this free whitepaper, “How to Ensure Your Website or App Won’t Fail at Peak Times.” To learn more about BlazeMeter, request a demo.

    — Noga Cohen

  • IT Leadership Still Struggles to Satisfy the Business, Deliver Innovation

    IT Leadership Still Struggles to Satisfy the Business, Deliver Innovation

    If a recently published report by Salesforce is to be believed, the rest of IT leadership is starting to catch up with what IT leaders have long known: Business technology needs to be customer experience-driven. This year’s report, Salesforce’s second annual broad look at the state of enterprise IT found that the line continues to blur between business leadership and IT leadership, driving innovation is the imperative, and IT is focused more than ever on providing business value.

    According to the “2017 State of IT Research” report, based on a survey of about 2,200 technology leaders worldwide, 71 percent of organizations reported they are shifting efforts from technology being a cost center to becoming a “value-based service brokerage over the next 12 to 18 months.”

    “Instead of being viewed as a cost center, IT is emerging as a value-based service brokerage,” the report states. “The old model of IT as a maintainer of the status quo infrastructure is giving way to a new mindset, in which IT adds innovative capabilities that bring a competitive edge to the business. Seventy-four percent of IT leaders say the business teams they partner with believe IT is the biggest driver of business success.”

    How are IT teams gauging their success? They’re measuring success based on satisfaction scores. A sizable 74 percent of IT leaders said that such business satisfaction scores are a leading key performance indicator, IT teams are only delivering on 56 percent of their customer-facing initiatives. With such less-than-flattering results, it’s no surprise that 67 percent of IT teams said that improving their collaboration with other lines of business is a high priority—second only to improving security policies and practices in priorities.

    This inability of some enterprises to execute on business initiatives couldn’t come at a worse time, as every company is tasked with becoming as agile and competitive as possible during a time of critical business disruption. According to the survey, Top IT teams are three and a half times more likely than underperforming teams to say it’s a critical priority to innovate for industry disruption.

    It’s important to note that Salesforce didn’t quantify the performance of the enterprise teams surveyed; instead, the respondents self-identified as underperformers, moderate performers or high performers against their competition.

    One of the biggest challenges IT has when it comes to innovating is the sheer amount of time they must spend keeping up on the basics, such as infrastructure. “Even with all the talk of prioritizing innovation, IT leaders still spend more time on tasks that keep the lights on (54 percent of their time, on average). A majority of IT leaders are moving to automate routine tasks so their teams have more time to innovate,” Salesforce wrote.

    According to the survey, about half, 52 percent, said that legacy technologies are a challenge to meeting strategic objectives.

    Finally, moving at speed remains a challenge as well. “Sixty-seven percent of IT leaders say improving the speed of development cycles is a high priority. And while speed is an important success metric, it’s also a top challenge. To improve, IT leaders are exploring options such as low-code solutions and citizen development. Some concerns—namely, security and insufficient governance or training—still hold IT teams back from putting business users into the driver’s seat,” Salesforce wrote.

    Where do they stand now? Just under half, at 47 percent, can deploy an app in under a month. Based on my reporting that’s quite an improvement in deployment time from just a year ago, and I think what we are seeing here are the fruits from agile, DevOps, continuous delivery, and low-code development platforms. And the half of enterprises that can’t deliver at speed are going to find themselves deeper and deeper down a competitive hole.

    — George V. Hulme

  • Using DevOps Metrics Effectively

    Using DevOps Metrics Effectively

    If you’re a DevOps leader, you have a very tough job. You have to radically transform processes and behaviors that have been ingrained in IT for decades. You have to adopt new technologies quickly while still delivering code quickly and cost-efficiently. And you have to do all this better than your peers at other companies. Otherwise, you’ll simply slow your company’s progress in the new digital marketplace while your better-performing competitors gain advantage.

    The good news is that the right metrics can help you gauge your success. Metrics can both tell you if you are traveling down the right path, or need to adjust, and help you prove the success of your DevOps initiatives to the rest of the business. But first you have to get them—and just as importantly, you have to use them.

    I wrote two previous blogs talking about how to get the metrics—one outlining what not to measure and another that delved into determining which metrics are right for your organization. In this blog, we will explore the latter part: how to use metrics to ensure ongoing DevOps success.

    Consider the Audience

    Measurements of any sort have two primary audiences: internal and external. The same metrics can be used and gathered for both, but the intent—and how they are communicated—is different.

    For internal audiences, you are measuring things to gain a better understanding of your own performance. It’s important to know what adjustments need to be made: where to double down and where to change course. Like a racing car pit crew monitoring hundreds of sensors on a vehicle, your DevOps team should be constantly looking at ways to extract the maximum performance and value from your efforts. Metrics will help you do this.

    External audiences are less concerned about the nuances and details and more concerned with the actual outcomes. Going back to the racing car analogy, external audiences care about lap times and top speeds; not about the operating temperature of the engine. It’s important to keep this difference in mind when you are communicating results to business leaders. Don’t bog them down with nuances and details; instead, show the results.

    Best Practices for Communication

    For both internal and external audiences, there are five best practices to consider when communicating metrics:

    1. Automation. Automation isn’t just important for efficiency and consistency in the software development life cycle, it is also useful for capturing and communicating DevOps metrics. Tools that automatically record and communicate your results will help you keep your finger on the pulse of your organization without getting bogged down in measuring and reporting.
    2. Evolution. The savviest DevOps leaders don’t marry themselves to a specific set of metrics. They intuitively understand that the metrics they use to evaluate DevOps progress will mature as the DevOps practice itself matures. The metrics you measure in the first six months may not be the ones you measure in year two.
    3. Action. This perhaps goes without saying, but metrics need to be communicated to both audiences listed above. It can be challenging communicating results when they are not what was expected, but the best way to communicate less-than-optimal metrics is to have an action plan to remediate any possible issues.
    4. Communication. As noted above, action and communication go hand in hand. Once you know what’s working and what’s not working, you should have a solid plan on next steps. When something’s working well, the plan should focus on how to replicate success; when something is not working as well, the actions should focus on future improvements.
    5. Self-examination. Metrics aren’t just indicators of what your team is doing right and doing wrong. They’re also useful diagnostics for leadership decisions and leadership style. So remember to take the responsibility and share the credit.

    When you marry the above best practices with the other measurement tips outlined in my previous blogs, you will not only be able to gather the right metrics, you’ll know what to do with them. Remember that, like DevOps itself, the practice of measuring DevOps success is something that can be started slow and expanded.

    Not every organization has the time or the resources to measure everything that should—or could—be measured. So, start slow, focus on the metrics that matter to your organization and use the best practices outlined above to guide you. For those who want to learn more about DevOps and DevOps metrics, my book, “DevOps for Digital Leaders,” explores these topics—and more—in a much more detail.

    Happy measuring!

    — Aruna Ravichandran

  • Metrics Only Matter When They Matter

    Metrics Only Matter When They Matter

    Many studies have shown the significant value that DevOps can bring to a software organization. However, organizations on their own DevOps journey need more than general industry studies or case studies. Any practitioner needs to be able to show the value—specific to their organization—that the changes to people, process and tooling made in the name of DevOps are having meaningful results.

    Measuring the success of a DevOps practice or project is critical to securing and maintaining support for similar projects in the future.

    In a previous blog, I talked about some of the pitfalls that come from focusing on the wrong DevOps metrics and outlined a few general guidelines around what makes a good metric. Here I’ll expand on that theme and discuss more specifically what types of metrics can help you show progress within your organization.

    To review, in the previous blog we looked at the characteristics of a good metric. Specifically, good metrics should be obtainable, reviewable, incorruptible and actionable. With those as general guidelines, it’s helpful to consider the three core components of successful DevOps implementation to help us determine where to look at measurements.

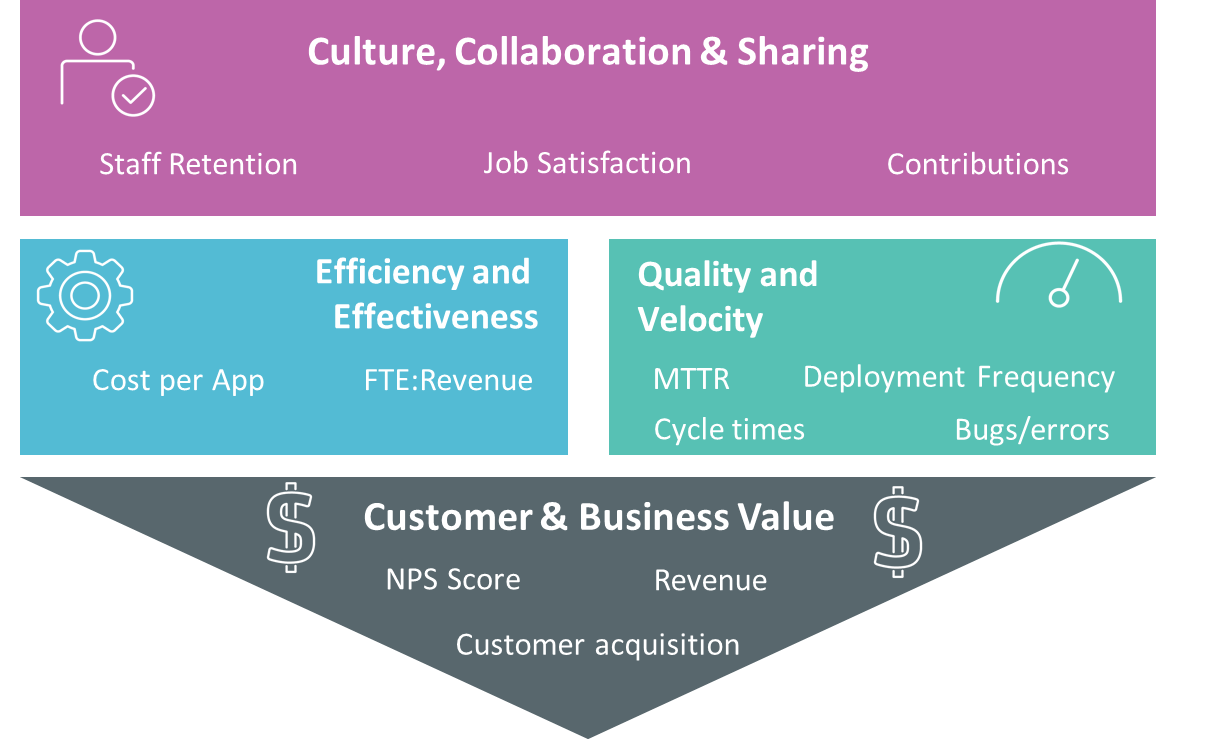
    DevOps is built around people, process and technology. But it doesn’t make sense to measure the components of DevOps; instead, we need to think about the goal, or outcome that each of these achieves. For example:

    • People changes are focused on improving culture, collaboration and sharing
    • Process changes are largely implemented with the goal of driving efficiency & effectiveness
    • Technology changes contribute to efficiency and effectiveness, but primarily drive quality and velocity

    Together, all three of these should lead to significant customer and business value.

    Notice how certain words above are in bold? That’s not an accident. These four key areas are the foundation of a successful DevOps practice—and therefore an excellent place to focus your measurement efforts. The figure below illustrates how these four areas fit together, and provides a few examples of the types of things that can be measure in each area.

    Of course, it’s important to consider your own organization when considering what metrics to focus on, as well as the guidelines mentioned previously. For example, in some organizations people-related metrics could be difficult to obtain on a regular basis. That’s not to say they’re not important—it’s been shown that DevOps can have a meaningful impact on employee satisfaction—but these metrics may not be the primary focus for some groups.

    DevOps has a wide range of benefits and I’ve seen organizations often have their own primary motivation, whether it is costs, velocity, competition or something else. It’s best to focus on metrics that are aligned to your organization’s primary objectives.

    Metrics matter only if what you’re measuring matters to your organization.

    If you are interested in learning more about DevOps metrics, the book “DevOps for Digital Leaders” explores this topic in more detail.

    In my next blog, I’ll delve into what to do with the metrics, once you’ve gathered and analyzed them. Because even the best metrics are only as good as what you—and your organization—can learn from them.

    — Aruna Ravichandran

  • Beware False DevOps Metrics

    Beware False DevOps Metrics

    Metrics are important for any manager seeking to continuously improve critical work processes and the resulting work-product.

    That’s why DevOps leaders need DevOps metrics. With the right ones, those leaders can guide their organization’s adoption of DevOps best practices—progressively optimizing staff productivity, business agility and customer experience.

    But, what are the right metrics for DevOps success? And, what are the wrong ones?

    These next few blogs will offer field-proven guidance on DevOps metrics. Much of the material in these upcoming blogs can be found in the book, “DevOps for Digital Leaders,” which I co-wrote with Kieran Taylor and Peter Waterhouse. And I’d love for you to comment below so we can all share lessons learned about how to effectively measure DevOps maturity—and, just as important, how not to measure it.

    Change Your Metrics, Change Your Culture

    DevOps leaders tend to struggle with metrics because DevOps entails changes that are both operational and cultural—and span different teams or functional areas, including development, test and operations. So inexperience may cause leaders to adopt new ones that are counterproductive—or, as is often the case, continue using traditional ones that don’t align well with the cross-functional nature of DevOps objectives.

    Three pitfalls have proven to be especially common in the transition to DevOps:

    • Vanity metrics. These appeal to the “hero” mentality of individual coders, rather than the collaborative process goals of cross-disciplinary DevOps and continuous delivery teams. They include total lines of code produced and total function points created. If incentives are linked to these metrics, developers can focus too much on volume at the expense of other essential activities such as refactoring and design simplification.
    • Those that promote interteam conflicts. Metrics that pit teams against each other undermine critical DevOps behaviors—such as code-sharing, mentoring and constructive peer reviews. So, while gamification may be useful in other areas of the business, Agile leaderboards that rank teams based on the prevention of extraneous deployments and changes can actually work against DevOps culture.
    • Traditional metrics. Many DevOps leaders persist in utilizing traditional/incumbent ones such as mean time between failures (MTBF) and the ratio of full-time equivalents (FTEs) to servers. But while these may have been useful in the past, they can work at cross-purposes with DevOps transformation. After all, with faster delivery of services, some failure is to be expected. And as IT improves its responsiveness to the business, it must look past costs alone to total economic impact.

    What Makes a DevOps Metric Useful?

    While future blogs will propose some specific metrics that DevOps leaders should find useful in their efforts to bring about cultural transformation, here are a few general guidelines to consider:

    They must be obtainable.

    A metric won’t do you any good if you can’t actually capture it. So you need DevOps tools that help you capture the metrics you need. You may also have to measure some attributes indirectly. For example, rather than measuring employee morale directly, it may make sense to use staff retention rates—which you can readily capture—as your performance indicator.

    They must be reviewable.

    Any metric you choose to employ as part of your DevOps leadership effort must be able to stand up to rigorous scrutiny in a business context. Your credibility as a leader depends on your ability to communicate its relevance to the stated values and mission of the team.

    They must be incorruptible.

    It’s never a good idea to promote metrics that can be influenced by individual team members or any group as a whole. You should also be on guard against metrics remaining entrenched—despite the fact that they may inhibit change—because bonuses are linked to SLAs associated with them.

    Metrics must be actionable.

    Useful metrics must enable DevOps leaders to make better decisions about workflows, incentives, policies, training, tools or some other “lever” of transformation. Not every such decision will be a game-changing one—but incremental gains in knowledge lead to incremental improvements in process, which collectively do change the game.

    In my next blog, I’ll discuss the metrics that DevOps leaders are using today to successfully drive the digital transformation of their businesses. In the meantime, if this is a topic that interests you, be sure to request a free copy of my book, “DevOps for Digital Leaders.”

    — Aruna Ravichandran