Tag: JIRA

  • CircleCI Adds Integration With Atlassian Jira

    CircleCI Adds Integration With Atlassian Jira

    One of the trickier issues IT vendors in the age of DevOps are dealing with is that very few organizations have standardized on a platform from a single vendor. Not only do organizations mix and match tools as they see fit, but different departments within the same organization also embrace different tools to automate the same tasks. That DevOps reality requires collaboration between IT vendors that normally would prefer to not work together, whether they like it or not.

    Case in point is a move by CircleCI, a provider of a continuous integration/continuous delivery (CI/CD) platform, to provide integration with the Jira project management software developed by Atlassian. While Atlassian makes its own CI/CD platform, customers and business partners alike have made it clear they needed CircleCI to support Jira, says Tom Trahan, head of business development for CircleCI. In some cases, those organizations have adopted Jira without having Atlassian’s CI/CD platform in their environment, while in other cases, a department within one part of an organization has opted for CircleCI while others are employing a CI/CD platform from Atlassian.

    At the same time, Trahan notes that many DevOps projects now span multiple organizations that have standardized on different DevOps platforms. Jira provides a way for teams in differentorganizations to manage those projects collaboratively, he says.

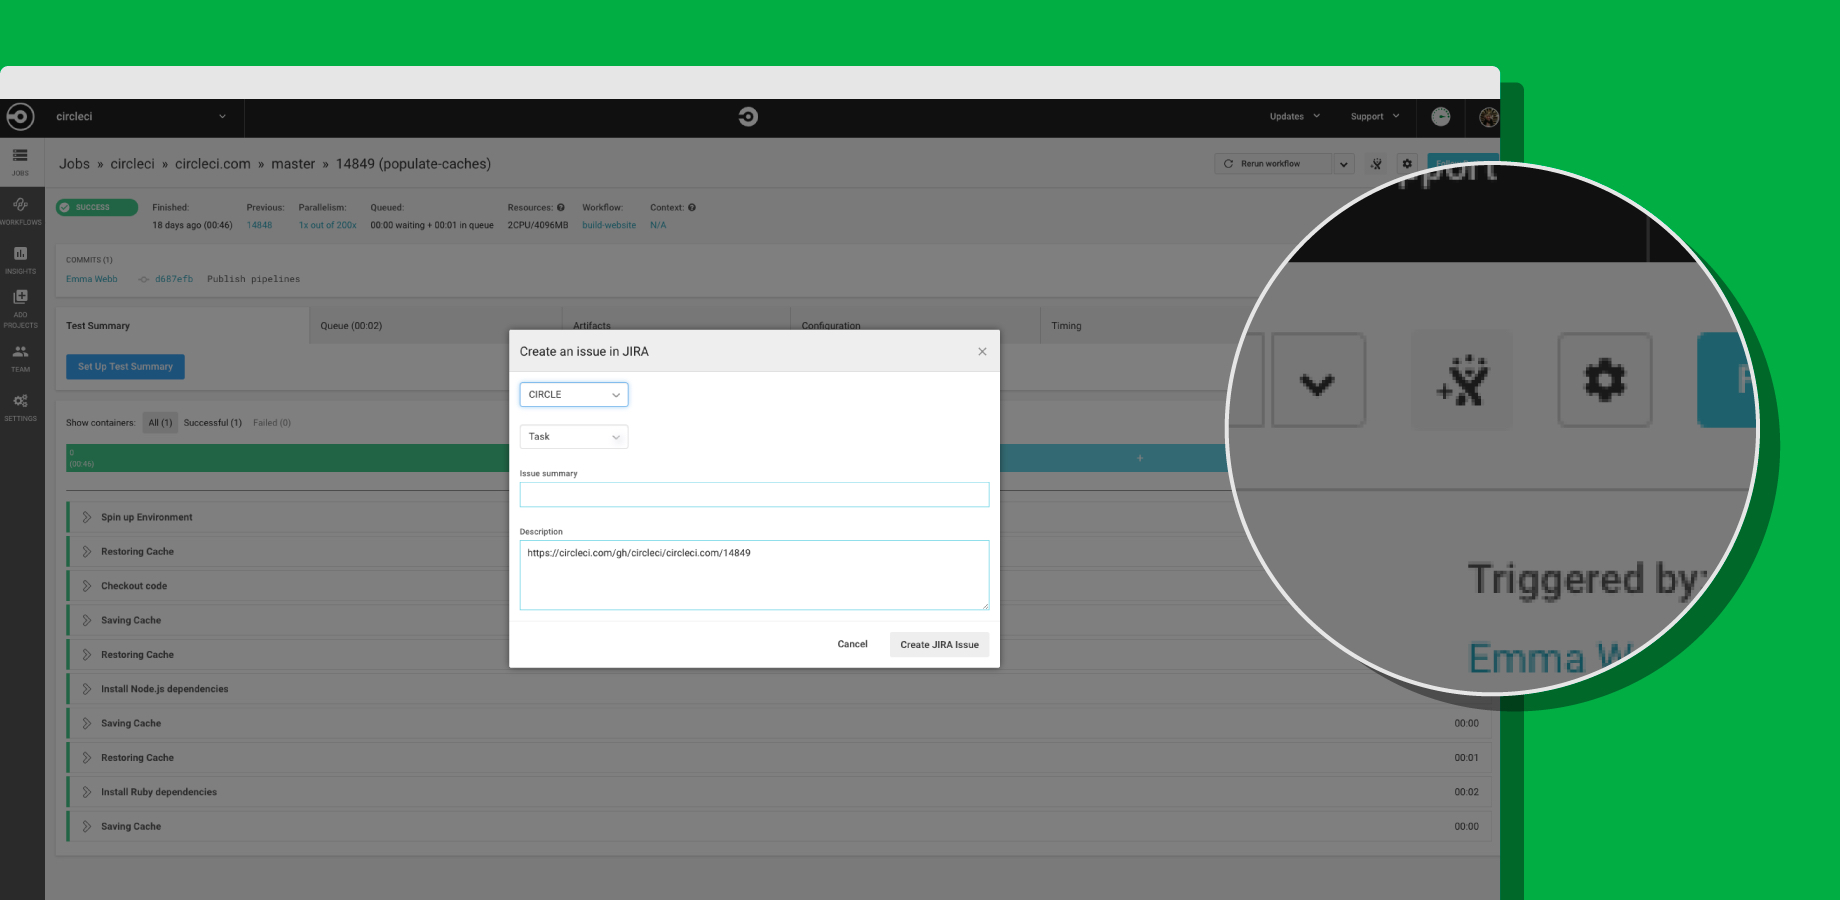
    To achieve integration with Jira, CircleCI now offers its CircleCI for Jira module, through which teams can assign new tasks and fixes based on job status with CircleCI orbs, a set of reusable configuration packages that allow CircleCI customers to integrate external tools into their workflow. That capability also makes it possible to launch new Jira issues directly from the job page within the CircleCI user interface.

    CircleCI Integrates with Jira

    Trahan says that in the polyglot world of DevOps, it is apparent vendors are being required to expose open application programming interfaces (APIs) that enable organizations to build and integrate various DevOps platforms anyway they want. Organizations won’t consider IT vendors that are too rigid in terms of what level of integration they enable, he says.

    As DevOps continues to evolve, it’s clear that a wave of merger and acquisition activity is makeing the IT vendor landscape somewhat volatile. Providers of DevOps tools that organizations have standardized on are being acquired at a rapid rate. IT organizations can’t be certain that any given tool or platform they are using won’t be scooped up by a vendor they might not want to engage. In that kind of environment, it’s critical for IT organizations to leverage open APIs that not only make it easier to collaborate, but also replace elements of their DevOps stack whenever they deem necessary.

    The challenge, of course, is that IT vendors are always trying to lock customers in as much as they can. Those efforts are not as heavy-handed as they once might have been. But almost inevitably, the extension being offered to access functionality will disappear if the underlying platform that enables it suddenly disappears. IT organizations, therefore, need to determine whether those extensions are worth any potential trouble they might cause somewhere down the DevOps road.

    — Mike Vizard

  • Atlassian Integrates DevOps Portfolio

    Atlassian Integrates DevOps Portfolio

    At its Atlassian Summit 2019 conference, Atlassian announced updates to all the DevOps tools that make up Atlassian Data Center as well as upgrades to its Opsgenie incident management software to provide deeper integration with the rest of the company’s portfolio.

    At the same time, Atlassian revealed it has rebranded the AgileCraft business planning application it acquired earlier this year to Jira Agile.

    New capabilities added to Atlassian Data Center include the ability to set up smart mirror farms for Bitbucket Data Center; content delivery network (CDN) support for Jira Software, Confluence, Bitbucket and Jira Service Desk Data Center; rate limiting for Bitbucket, Jira Software and Jira Service Desk Data Center; issue archiving for Jira Software and Jira Service Desk Data Center; templates for deploying on Microsoft Azure and Amazon Web Services public cloud; and a mobile application for Jira Server and Data Center.

    Atlassian Data Center now incorporates Jira Software 8.0, Confluence 7.0, Bitbucket 6.0, Jira Service Desk 4.0 and Portfolio 3.0. The latest version of Jira Software 8.0 now executes advanced searches using Jira Query Language (JQL) 31% faster on average, while agile boards load two times faster and re-indexing times are now 71% faster. The latest version of Confluence adds support for multimedia files and additional analytics tools to the content management platform.

    The Atlassian Cloud service has also been expanded to increase the user limit to 5,000, with an early access program signaling an intention to bring that up to 10,000 users soon.

    Meanwhile, specific capabilities being added to OpsGenie include support for incident timelines to track response activities and key events; postmortems to help discover root causes and track remediation activities, a user interface that aligns with the rest of the Atlassian portfolio that fosters bi-directional workflow, the ability to automatically trigger events, integration with Slack collaboration software, the ability to encrypt data and Statuspage services integration to make it possible to share alerts with third-party services. Atlassian has also rebranded its Automation Actions to Opsgenie Actions; the company acquired Opsgenie last fall.

    Berkay Mollamustafaoglu, co-founder and head of product for Opsgenie, said now that Opsgenie is part of the larger Atlassian product family there’s clearly more focus on helping organizations integrate best DevOps practices with more structured processes based on the ITIL format. The latest version of the ITIL format provides makes those processes more flexible, but there’s still plenty of room for Atlassian to improve the tenor of the conversation across what has become a bi-modal IT operations environment. As the level of synchronization across those processes increases, the amount of fatigue IT operations teams experience lessens as the number of alerts that need to be correlated across multiple platforms decreases, Mollamustafaoglu noted. In fact, rather than convening in a physical “war room” to resolve a issue, most incidents will increasingly be resolved via online chats, he said.

    It may take a while before a period of détente emerges between advocates of DevOps and ITIL processes inevitably emerges. In the meantime, the more IT services management (ITSM) platforms become integrated with one another, the easier it becomes to achieve that goal. In fact, the major obstacle that needs to be overcome are much more likely to cultural rather than the level of integration that can be achieved using any specific ITSM platform.

    — Mike Vizard

  • Using Spark and Jenkins to Deploy Code into Hadoop Clusters

    Using Spark and Jenkins to Deploy Code into Hadoop Clusters

    This article illustrates how to deploy an application into a Hadoop cluster using GitLab/Jenkins/Spark application.

    In this article, we will cover the following:

    • Auto-triggering Jenkins build when code is committed in Git.
    • Pulling the latest code from the repository through Jenkins.
    • Building, compiling and packaging the “.jar” using SBT tool.
    • Uploading the .jar to the Nexus repository with defined version.
    • Pulling the versioned jar and dependent files from Nexus repository to server.
    • Deploying the versioned “.jar” file through Spark job into Hadoop cluster.

    Getting Started

    The following must be performed first:

    1. Download and install Java 1.8.
    2. Install Jenkins.
    3. Integrate GitLab and Jira.
    4. Install SBT.
    5. Create the Hadoop cluster: Hadoop and Spark.

    End to End Steps in Detail

    When a developer pushes code to GitLab, Jenkins will trigger a predefined job using webhooks.

    The Jenkins job will pull the code from version control using Git; it builds the code and makes the package as .jar file using the build tool SBT. This .jar file can be deployed into a Hadoop cluster with the help of a Spark command.

    Once the deployment is completed in the Hadoop cluster, the application will start running in the background.

    Initially, we can see the current running application in Hadoop (see Figure 1). It has an application ID, which is in a running state.

    Figure 1
    • If we click the tracking UI, which is Application Master, it will navigate into the Spark streaming page.
    Figure 2
    • In Figure 2, we can see batches are running in 40 seconds. For this scenario, we are changing from 40 seconds in the code.
    • When a developer makes changes to the code, he will commit in his local machine and test his code, then push to remote repository. I have updated steaming time from 40 to 50 seconds and committed.
    • If we can specify the Jira task number in the commit message, the same comment will be updated in the Jira task as below.
    Figure 3

    In the Jira application, we can see our commit message as comments.

    Figure 4

    GitLab and Jira integration process:

    • Install Git plugin to pull code from GitHub repository and SBT plugin to build and make a package as a .jar file in Jenkins.
    • Configure the Jenkins job under source code management and provide the Repository URL along with credentials and branch details.
    Figure 5
    • Optional: Set webhooks to automatically trigger the Jenkins job when the push happens in GitLab.
    Figure 6
    • In the “build” section, add the parameters clean compile package in the Actions field, which will build the code and create a .jar file.
    Figure 7
    • Once the job has been triggered in Jenkins, monitor the Jenkins console for the next step and errors, if any.
    Figure 8

    Optional: If we have configured SonarQube, it will analyze the code files and provide the result in the SonarQube dashboard. This allows us to know the code quality, code coverage vulnerabilities and bugs to improve efficiency of code.

    • Optional: To maintain the versioning, we can upload our *.jar into Nexus/Artifactory.
    • Once .jar has been created, we can keep it in a specific folder and trigger a Spark job. This can be performed by triggering a Spark command from Jenkins. Execute the below command to submit spark job:

    # spark-submit –name appName –master yarn –deploy-mode cluster –executor-memory 1g –driver-memory 1g –jars $(echo $dependencyJarDir/*.jar | tr ‘ ‘ ‘,’) –class com.coe.spotter.DQModule –conf spark.driver.extraJavaOptions=../src/main/resources/log4j-yarn.properties –conf spark.sql.warehouse.dir=./spark-warehouse –conf spark.yarn.submit.waitAppCompletion=false app.Jar


    • Once deployed, we can see the application ID number has been increased.
    Figure 9

    Timeout in the Spark streaming job has been increased to 50 seconds.

    Figure 10

    — Nodagala Nagarjuna

  • The Role JIRA Plays in Complex Value Stream Networks

    The Role JIRA Plays in Complex Value Stream Networks

    No one denies that JIRA has taken over the developer space. The verdict is nearly universal: Most developers want to use JIRA only.  That’s fine, but without understanding the role it plays within the context of your entire value stream network, your organization has likely not crafted the most efficient value stream.

    JIRA plays a critical role within any complex value stream—and using JIRA to its fullest along with the other critical aspects of your value stream is the key to delivering software faster and achieving the software results you sought.

    But developers encompass only one role that is required to build complex software. And, as fabulous as JIRA is for developers, it is often not the tool of choice for the many other roles involved in building software, i.e., product managers, product analysts and test engineers. Even salespeople are part of your value stream.

    Fundamentally, we need to recognize and understand that delivering software requires careful orchestration between a large network of people with different roles who have the need for different tools. But we need the overarching value stream of information passing within that network to work together seamlessly. The information flowing through the network needs to be connected and traceable in an automated way. This really boils down to identifying the “centers of criticality” with the associated artifacts and architecting your value stream network accordingly.

    JIRA, Centers of Criticality and the Value Stream

    What are “centers of criticality” in software delivery value streams? They are the artifacts and associated tools that represent the primary connectors of business value to the manifestation of that business value. To be more specific, when the business asks for some new functionality, it is represented as one or more artifacts, typically either requirements, features or epics (sometimes all three). Those artifacts act as the “glue” for all of the other key information from which to “hang off.” You want the tests that run, the change sets and code reviews, the defects, the builds … all of that information should be tied to the requirements/features/epics. And those “glue” artifacts also need to be tied to the originating business initiative or program.  Thus, tools that operate on those types of artifacts really are your “centers of criticality.”

    And that is where JIRA comes into play quite significantly. It acts as the touchpoint—the center of criticality—between what the developer should build, tied to the actual artifacts that constitute the end working software, as well as tied to the originating business needs.

    Consider the familiar example of when a salesperson hears from customers that they really want a new feature. As a result, she wants to tie this net new ask to the opportunity—and be able to track via Salesforce whether the customers are going to get that new feature request anytime soon.

    And here’s a good value stream for it: The request is entered into Salesforce and naturally tied to the customer account. That request should flow to the product management tool in use, which in some cases might be JIRA, but often, especially at large organizations, is a more purpose-built product management, portfolio management or requirements management tool. At that point, the request that originated in Salesforce is reviewed and determined to be three different features. Once the company decides it wants to build them, those features then flow into JIRA as epics. From the epic in JIRA, the development team begins to create the stories and tasks necessary to build the feature, then connects the change sets and tests and defects to those stories and tasks.

    As a result, without any manual effort, the team has created a dynamic network of artifacts that provide full traceability from the very beginning of a customer requesting something through to its final delivery seamlessly. JIRA plays that critical touchpoint role of “what” should be built to the actual bits and bytes of the resulting software.

    Now consider a different example. You’ve released the next version of your application and all is going smoothly. Support uses ServiceNow, or one of the many IT service management (ITSM) tools that exist. Your support team is the originator of much of the follow-on work that happens regarding applications. Tickets originate with ITSM tools—but they, too, need to be connected to the resulting defect that requires attention. So, you need a seamless flow of tickets and incidents from the ITSM tool to the resulting defects that must reside in JIRA. And those defects need to be associated to the stories and epics that were affected. They also reside in JIRA.

    Both examples exemplify the importance of “centers of criticality,” with JIRA being one of those centers of criticality. In a complex value stream network, JIRA plays that crucial role of being the touchpoint between bits and bytes and business value.  But, without flowing information to and from JIRA from the other tools in the value stream, you are left with a broken value stream without real, accurate, automated knowledge of what and why you are building something. Because knowing if you’ve delivered business value comes from understanding the provenance of what you are building. It might be how many customers (internal or external) had asked for the 20 features that were delivered last release. Or how many customers were not going to renew your software if those features weren’t there. Or even how many new opportunities you can follow up on to say that what they’ve asked for is now in your product.

    Conclusion

    Building complex software that truly meets business needs necessitates that there will be an equally complex underlying value stream network that will only be efficient and effective if it is architected from the ground up with careful consideration of the critical artifacts and tools that need to be connected. JIRA is very clearly one of those tools. So, embrace JIRA being the heartbeat for developers—and know that by crafting your end-to-end value stream network with JIRA as one of the “centers of criticality” you can have an efficient, fully connected and fully traceable value stream. Happy connecting!

    — Nicole Bryan

  • 4 Top Tips for Developing a New Feature

    4 Top Tips for Developing a New Feature

    As a backend developer at CA BlazeMeter, I recently had the chance to work on a big feature for our web app. The feature required a massive change on our backend code, a big change on our frontend and multiple migrations. You know what I’m talking about—it was one of those projects that developers fear.

    But, I gained a lot of valuable experience from the project. Not only did we deliver a kick-ass feature, I also learned the importance of teamwork and patience when developing something new. Armed with those two values, and the right tools and technologies, you can deliver a new feature quickly and efficiently.

    Here are a few more things that I learned that should prove helpful whether you’re developing a major feature or one that only requires a minor code change.

    Tip 1: Plan to understand the development requirements

    The process of development starts way before you start coding, with planning. After the product manager decides what needs to be developed, R&D needs to understand the cost: how many days (or weeks) of development the feature will take, how many people will be needed and which APIs are required.

    To do that, the product manager needs to conduct at least three “grooming” sessions with backend, frontend and QA leaders. The grooming sessions start with the product manager presenting the product flow and requirements.

    Since no one wants to read a lot of text (except perhaps the awesome readers of this article), the product manager should prepare mockups. They don’t have to be designed or colorful, but they do need to show the team what the feature looks like in his or her vision. During our grooming sessions, we used Balsamiq, which lets you create screen sketches for how the product is supposed to look, feel and work.
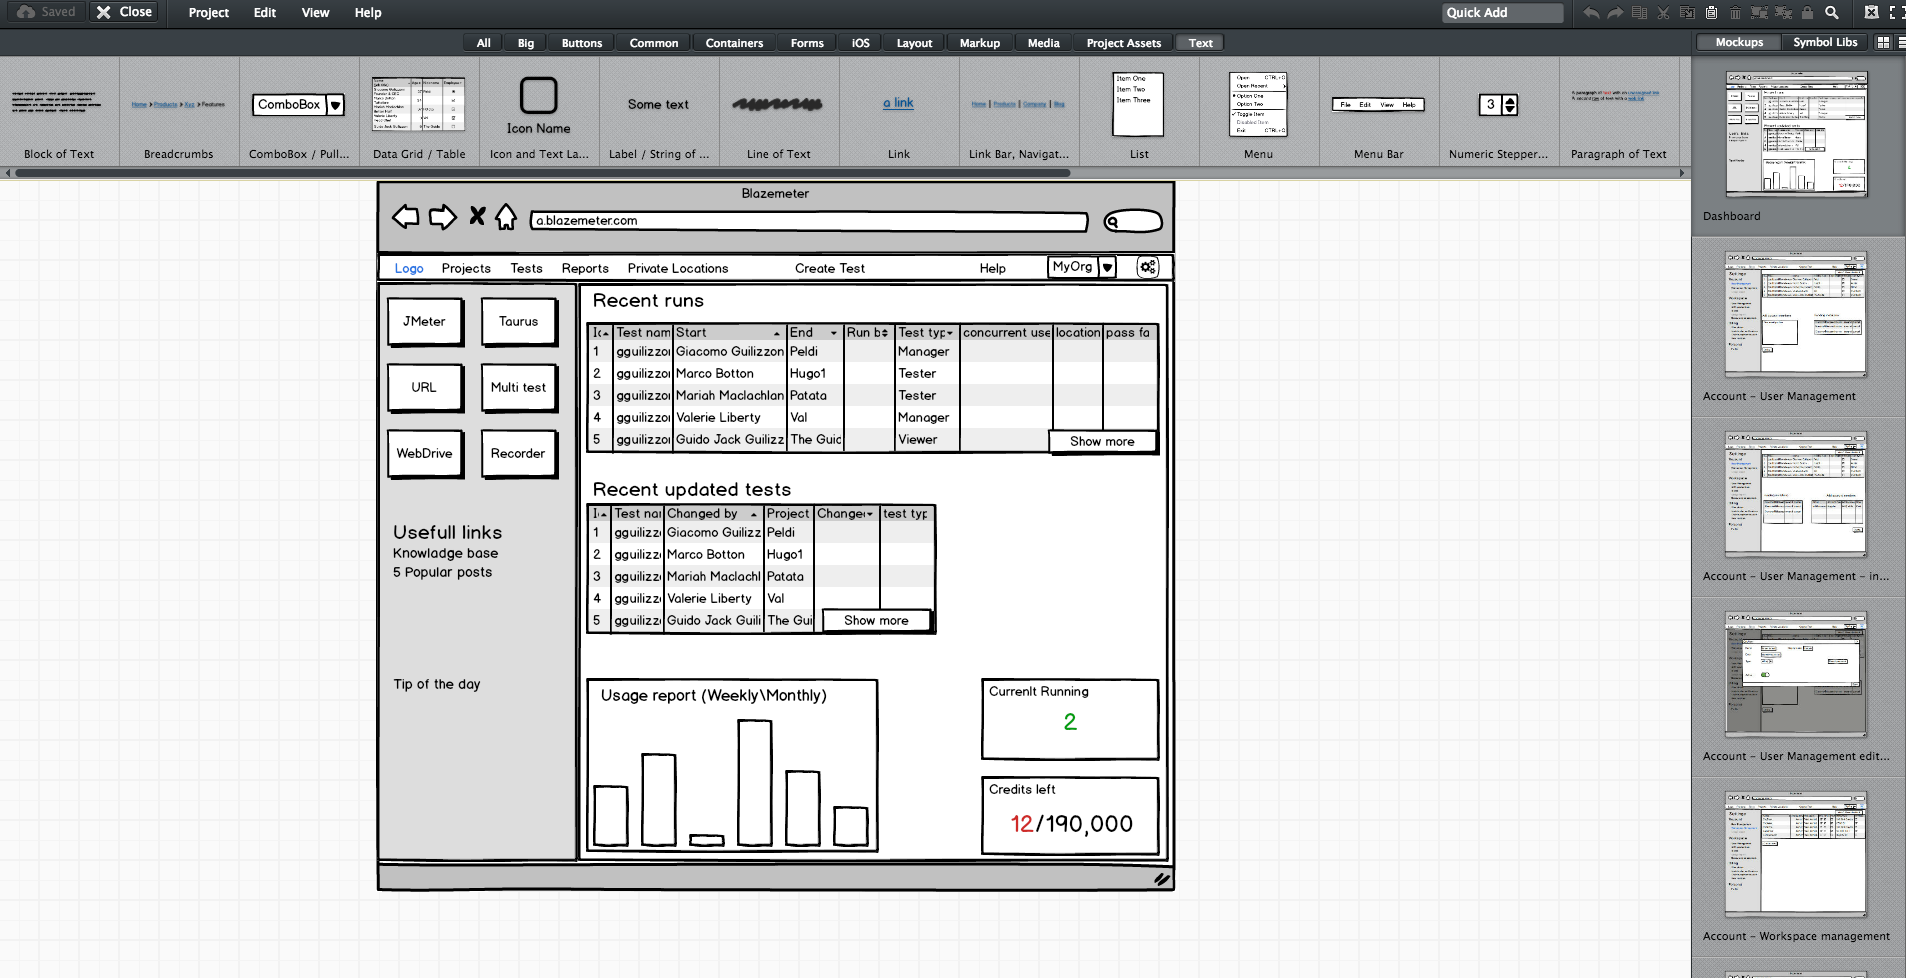
    Editing screen sketches using Balsamiq

    After the initial presentation, the sessions should include a lot of open discussion—asking questions, checking for answers and examining compliance, etc. —until everyone is satisfied and understands what the feature requires from them and from others.

    This is the time and place for frontend, backend and QA to give their opinion about the schedule and to alert and flag any potential problems in development or extreme use cases. It’s the role of the product team to answer questions and change the flow and requirements until there are no R&D rejections.

    Afterward, the frontend and backend leaders need to create a feature development plan, sitting down to determine what data they need to transform the product vision into a real thing. Or in other words, which APIs are required for each flow or button, how long each step is supposed to take, including buffers, and the order of development. APIs are the agreed “contract” between the development teams. After determining the contract terms, each team can proceed individually.

    I recommend you write your APIs in Swagger, which turns YAML files into detailed HTML pages with all the APIs.
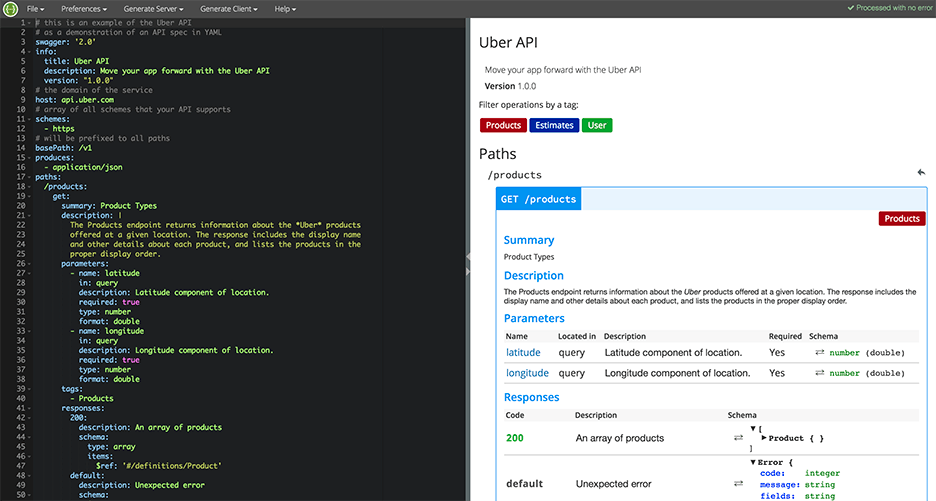
    Swagger Editor

    This plan needs to be transparent to everyone working on the project. In fact, it’s even better if each project participant can add and describe scenarios. Tools such as TestLink and Atlassian do just that. Then, when the code is ready, developers can go over the list and see everything is covered.

    We will need to stick to this schedule later on, especially when new demands unrelated to the feature come in, such as fixing bugs. Sticking to this plan is the best way to distinguish the wheat from the chaff of the development process.

    Start writing automation ASAP

    After planning, we want everyone to start working, and not only the backend. To do that, the backend can prepare mocks, either through outsourcing services such as JSON servers, which show inputs and outputs, or by writing dummy code.

    I mentioned earlier that we used Swagger to write APIs. We also used it to generate a server in NodeJS/Python, like this:

    Generating a JSON Server through Swagger

    From this moment on, frontend can begin writing and building screens and QA can start writing API automated testing, by using tools suh as JMeter. At this point, frontend and QA have the response codes and response bodies; they know which features to put where; and which APIs they need and how to use them.

    QA also know which data they’re missing, such as field names and field data. Sure, the backend code isn’t ready yet and all of the automated exams will return “red” instead of “green,” but the main issue is making sure everyone is as prepared as possible.

    This includes load and performance testing. You can use open-source tools such as JMeter, which is enhanced by CA BlazeMeter. By uploading our test script into, configuring the number of virtual users and ramp-up time, determining geo-locations to test from and analyzing KPIs to determine trends and the health of our system, we can ensure our product is delivered to our customers without crashing.

    This is also true about sending code to QA: Developers should test their code themselves and ensure that when they commit their code, it works 99.9 percent of the time.

    By starting automation as soon as possible, you can minimize future bottlenecks in the development process.

    Ensure the team communicates and works together

    Like I said before, teamwork is the most basic requirement when creating a new feature. This is because new questions arise during development and because requirements change. Therefore, everyone in the team needs to be in sync all the time, from the product manager and the designer to the developers and QA.

    Open communication lines are crucial because everyone is working on the same product at the same time, but each developer or QA should be working on a different part of the product and on different functionalities. Communication ensures each person’s work is compatible with the rest of the team’s work. This saves time, prevents frustration and redundancy and ensures maximum professionalism.

    To make sure everyone knew what was happening, we used Slack and opened a dedicated channel for the creation of this feature. We also had daily (short!) standups where we discussed what we have and what is missing.
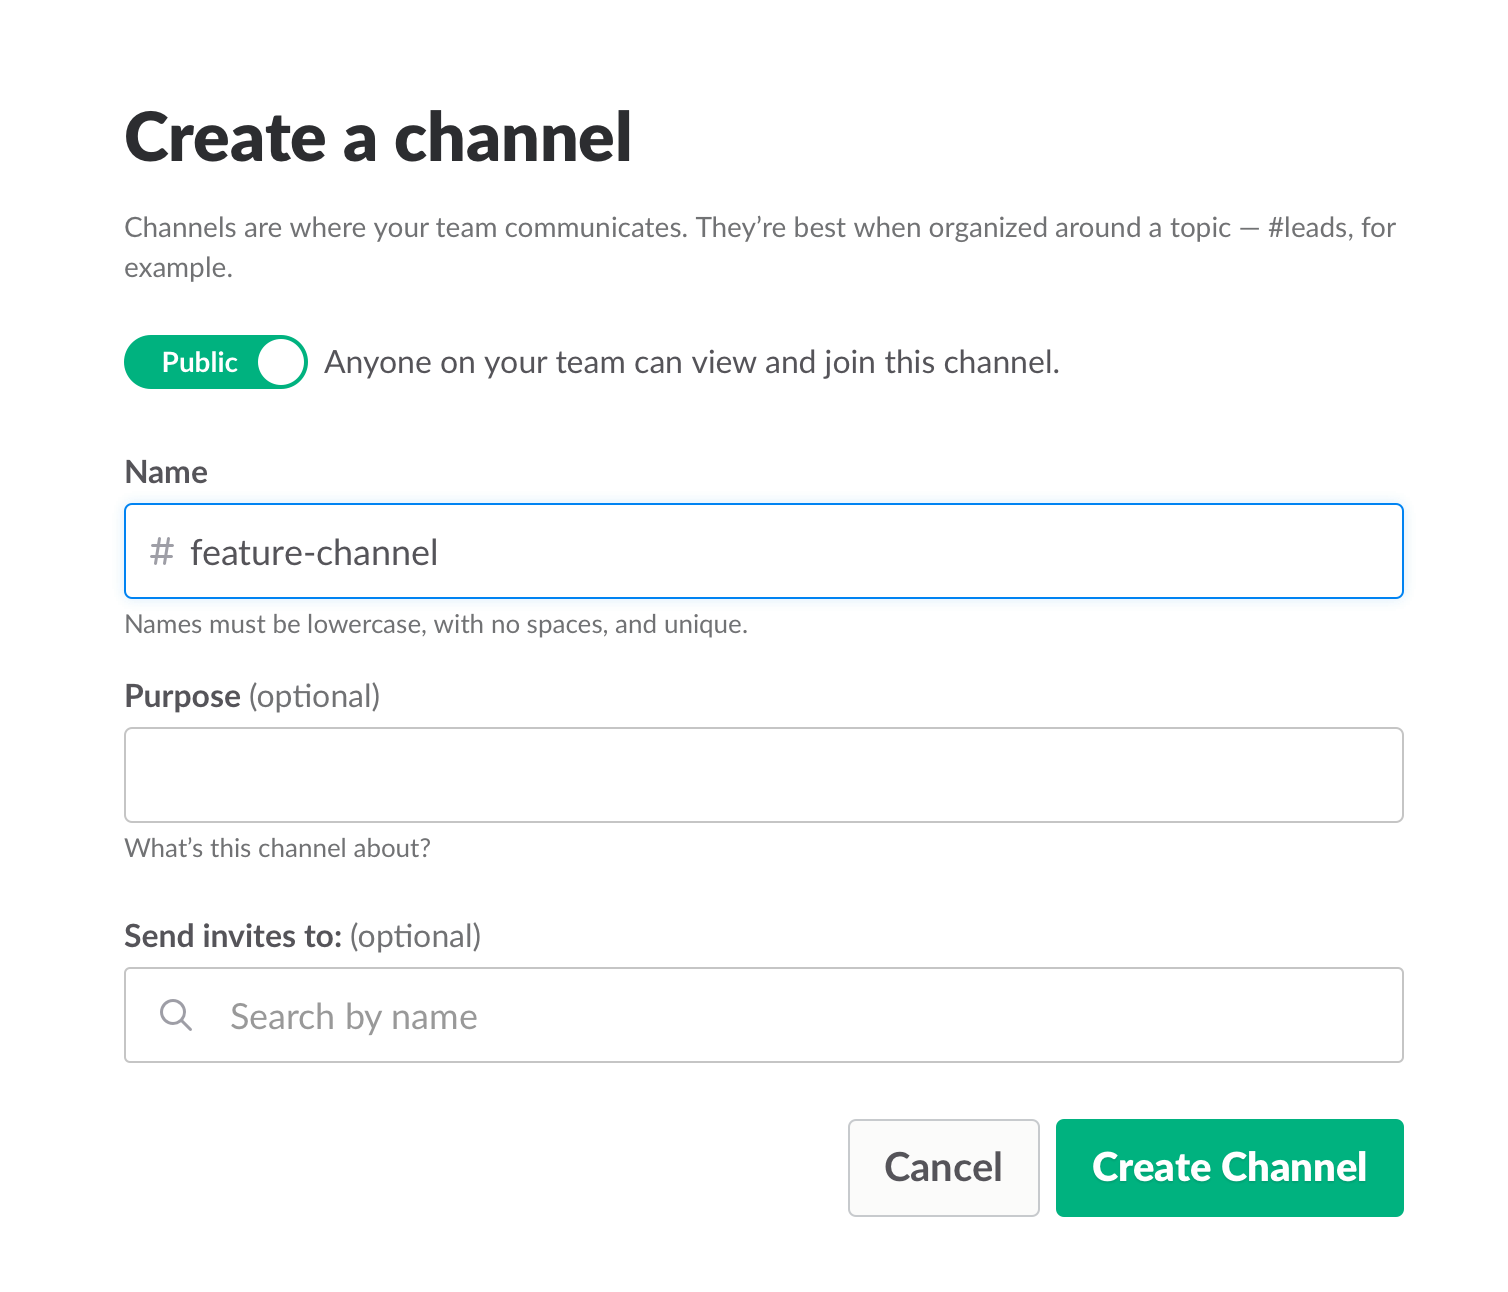
    Opening a Slack channel

    Communication also includes team and assignment management. JIRA, our primary issue tracking tool, offers Kanban-style, Scrum and fully customizable boards, which show the progress of each development task, including the developer assigned to it, and his or her exact status or phase.

    This helps you understand what other people are working on, and just as importantly, where people are stuck. If you can, get everyone to work in an open space and put a large screen in the middle of it. This lets you stay in sync at all times.

    We used JIRA to open and manage bugs as well. This was helpful when multiple QAs found the same bug. It’s important to carefully choose which tickets are opened and put them under one epic, so everyone stays focused.
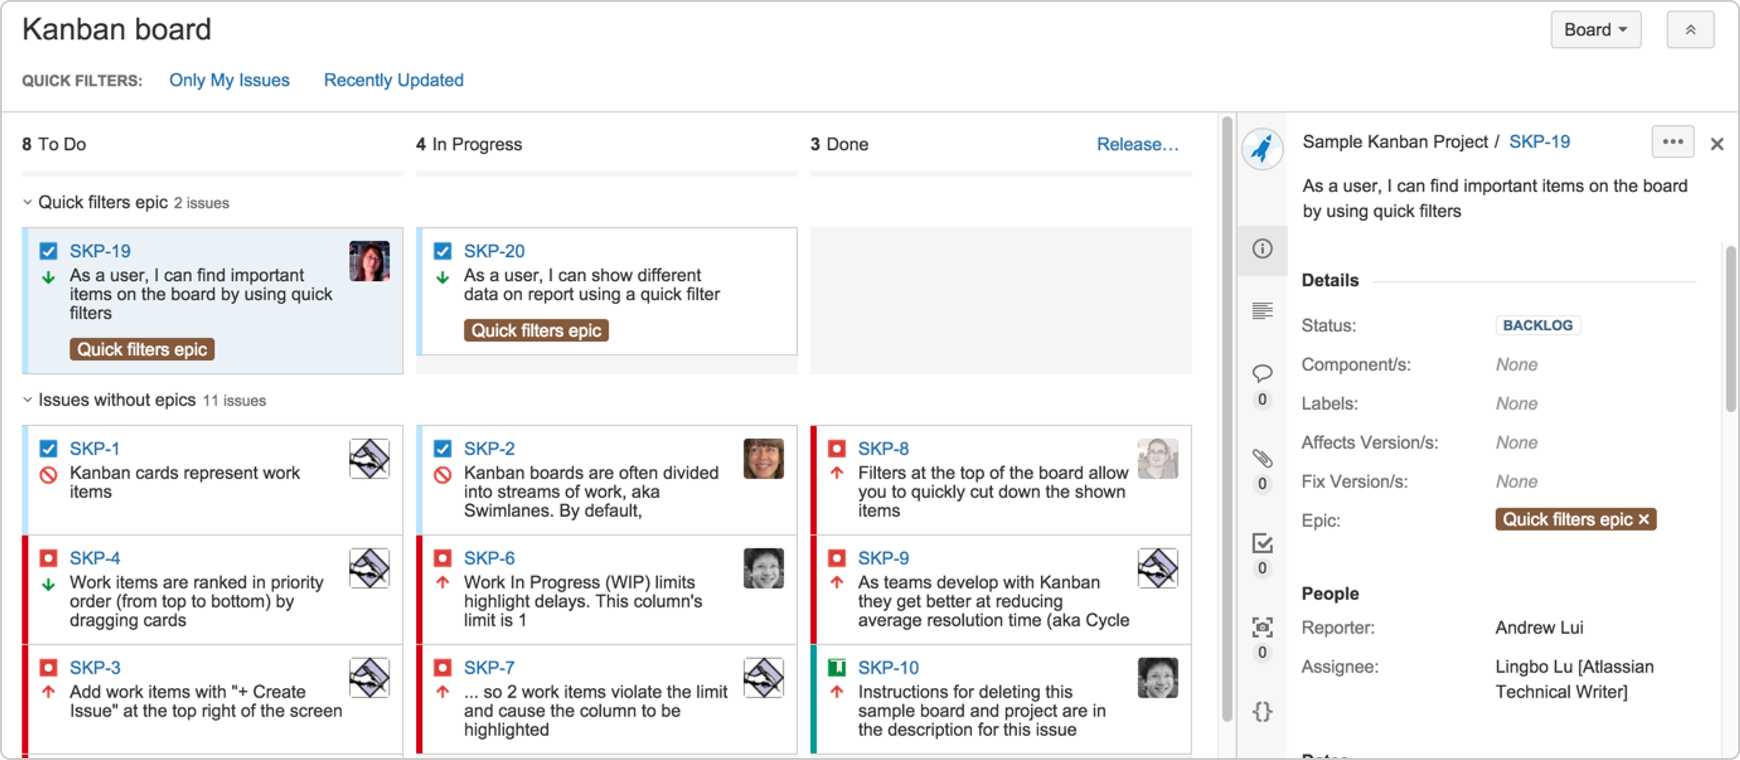
     

    JIRA Dashboard

    Another important aspect of communication is ensuring everyone uses the same terminology, as sometimes people might use the same term to describe different things or different terms to describe the same things. To prevent mixups that could waste your time, make sure everyone is on the same page. For example, do you say “system admin” or “<name (ex. BlazeMeter)> admin”?

    Work on the same development environments

    It’s important that everyone works on identical development environments and even on the same version of the tools and libraries. Otherwise, it could cause an (in)compatibility mess, including a lot of unnecessary back and forth and even might cause bugs to pop up. This environment needs to be as similar as possible to production, but only on a smaller scale.

    Conclusion

    Now look at the feature that came out of all that work here. I’m so grateful that I had the opportunity to work on it with an awesome team.

    I hope these best practices help you the next time you develop a new feature. Don’t forget to keep going agile after development and delivery by running tests in a continuous environment such as Jenkins for every commit.

    CA BlazeMeter works with Jenkins, ensuring you can load test in the cloud and analyze your data while shifting left. You can also use different APM tools, such as New Relic, AppDynamics and CA APM to alert you about errors before QA, which saves time.

    — Dor Atias

  • Datadog Monitoring and JIRA Integration

    Datadog Monitoring and JIRA Integration

    Operations uses monitoring to provide early detection of issues with systems/servers/networks. Among those monitoring options is Datadog, a software-as-a-service (SaaS) cloud service/application monitoring tool that allows Operations to be notified of issues with their applications in near-real time. Development teams, meanwhile, use JIRA to track tickets and manage overall agile development.

    But what if your product is the very thing that Operations manages? The sweet spot for DevOps is that location where the app is internally developed, and managed by Operations, because the entire stack is under IT management.

    That’s why Datadog and JIRA are now integrated.

    Datadog can monitor an infrastructure and application on a variety of levels at a variety of locations in the infrastructure stack, from disk availability to response times to memory usage. Datadog has the ability to monitor and emit alerts when things are abnormal or out of specified ranges, or they outright fail.

    JIRA is Atlassian’s Agile project management software, with issue tracking and all of the usual agile tools in one place.

    From Datadog Monitoring to JIRA ticket.
    Configuring Monitoring’s alerting to JIRA.

    Now, Datadog can create JIRA tickets, update them as more information becomes available and populate them with relevant information from the running systems.

    Say, for example, one cloud instance runs low on memory and passes over a threshold. Datadog detects the issue and opens a ticket in JIRA that shows what system and when, as well as whatever other information Operations has defined. That ticket is now in the system like any other, and a developer can grab it and look at memory use for the portions of the overall application that run on the instance in question.

    According to the press release, these are the three automations included in this integration:

    1. Creating JIRA tickets when performance issues are detected within Datadog.
    2. Populating JIRA tickets with pertinent information about identified issues.
    3. Updating existing JIRA tickets when new information surfaces.

    I’m an analytical person, so my first thought was, “How cool,” and my second was, “But what if it spams JIRA with non-development issues?” Since Operations configures what goes to JIRA, and Datadog supports alert rollups (multiple alerts in one or two notifications), it is possible to keep such spamming under control. An overzealous Operations staff initially might configure the reporting to send too much, but as experience grows, this should become a viable way to automate bug reporting. In particular, tagging of Datadog-generated events should show quickly what alerts are creating too many tickets, and give the team opportunity to change the way tickets are created—or, if it turns out they’re created because of a serious application-impacting error, raise the priority of the fix.

    Which brings us to the updating status part. In Datadog, operations can leave a comment on an issue with an “@jira-update” tag and JIRA will get notified of the comment. That means Operations can raise awareness of an issue that may seem mundane but has larger impact than is obvious, or add detail to a JIRA ticket if needed, all from within Datadog.

    It is interesting that Datadog is also integrated with BitBucket, another Atlassian product, so it is possible that opened tickets can be marked as “in test” when an integration build includes reference to the ticket. In short, BitBucket integration means that Datadog’s monitoring is aware of commits and checkouts, and Operations staff will be able to correlate that to issues that occur. Adding in JIRA integration means that Operations sees the commits, gets the alerts and updates JIRA. The wealth of information is such that you’ll want to use their various filtering techniques just to make certain you’re getting the important stuff.

    There are some areas that are intriguing to me, such as the impact of a particularly complex set of queries/reductions on a big data platform. I haven’t tried the Hadoop integration, but it appears that this agent would be able to communicate that a given reduction is the source of the problem to the JIRA interface. Even if these complimentary integrations aren’t there yet, you can feel it coming to where “This reduction caused systemwide issues” is what is generated in JIRA. That’s pretty cool.

    Overall, the integration of Datadog and JIRA is a DevOps dream come true, tying Operations closer into Development, and allowing Development changes to be tracked closer in Operations. After all, the point is to keep the systems running as close to peak efficiency as possible, and automate as much as can be. The issues spawning from Datadog alerts into JIRA tickets also pretty much guarantees increased need for development and operations to talk, as problems that crop up by the automated system are discussed and researched.

    If you’re dedicated to a cooperative environment for Dev and Ops—even if you aren’t calling it DevOps—the Datadog/JIRA integration is worth a look.

    — Don Macvittie

  • BigPanda Launches DevOps Tools to Troubleshoot and Maintain Healthy Infrastructure at Scale

    New Product Releases Include Unified Search, Incident Dashboards and Enhanced Integrations with Atlassian JIRA Software, Splunk and Datadog

    PALO ALTO, Calif.–(BUSINESS WIRE)–BigPanda, the Alert Correlation Platform that turns huge volumes of IT data and alerts into consolidated insights for businesses, today announced that it has launched new product updates and technology integrations which give Ops teams the ability to troubleshoot and maintain healthy infrastructure at scale. BigPanda’s platform now includes Unified Search and Incident Dashboards as well as new integrations with Atlassian JIRA Software, Splunk and Datadog.

    “Companies looking to mature their operational processes to better support end customers can now unify and visualize monitoring data across their organizations, drastically reduce mean time to resolution and increase uptime with these new features,“ said Assaf Resnick, CEO of BigPanda.

    Unified Search Provides Smarter Results, Less Noise

    Just released, BigPanda Unified Search is a new way for Ops teams to access alert data from all of their monitoring sources, eliminating the need to conduct parallel investigations within each monitoring tool.

    When a problem materializes in a datacenter, it’s not always clear when or where the failure occurred, and Ops teams may frantically search through tens of thousands of alerts from multiple tools to identify the root cause. BigPanda Unified Search drastically reduces time to investigate by giving users an interactive way to find the most relevant alerts and incidents. It surfaces insights from all sources of monitoring alerts by continuously organizing issues from all common modern and legacy tools, including Nagios, New Relic, AppDynamics, Pingdom, SolarWinds, Site24x7 and CloudWatch.

    Using BigPanda Unified Search, Ops teams can search through historical alerts even if the original monitoring tool does not retain that data and automatically find related incidents that were previously resolved or may still be open.

    Operational Health Dashboards

    Ops teams that need an at-a-glance representation of operational health now have access to the new Incident Dashboard in BigPanda. The new feature allows organizations to visualize the health of applications, services and infrastructure areas with personalized dashboards that enable them to be aware of and respond more quickly to issues that can impact the business.

    The new dashboard feature helps Ops teams answer questions about the overall health of their operations and environments and compare it to historical trends. Each dashboard can be customized with specific indicators, including incident counts by status, the percentage increase or decrease of active incidents, and how the volume of active incidents changed over time.

    BigPanda Enhances Integration with Atlassian JIRA Software and HipChat

    BigPanda’s technology integration with team collaboration software company Atlassian helps Ops teams using Atlassian’s JIRA Software and HipChat products collaborate to solve more problems faster.

    BigPanda enables JIRA Software users to automatically create tickets based on intelligent correlated incidents, which helps them save time, reduce ticket clutter, and get a real-time view of what’s happening so they can deliver better customer service and more reliable apps. With today’s announcement, BigPanda now supports a two-way integration with JIRA Software. This means customers who track development tasks now have the ability to automatically resolve BigPanda incidents when JIRA tickets are closed.

    “Many of JIRA Software’s more than 37,000 customers are manually tracking incident response tasks,” said Dave Meyer, senior product manager, Atlassian. “BigPanda’s JIRA Software integration will connect real-time insights from BigPanda with JIRA Software’s powerful search and workflow to help people resolve incidents faster.”

    Splunk and Datadog Integrations Reduce Alert Noise

    BigPanda also announced it is teaming up with two DevOps pioneers – Splunk and Datadog – to reduce alert noise and provide an alternative to filtering through thousands of redundant alerts, pages and emails.

    BigPanda’s powerful aggregation engine normalizes alerts from Splunk, Datadog and other monitoring systems into a single consolidated incident management center. Then, BigPanda analyzes all alert streams in real time, and it intelligently groups them into a simplified list of high-level incidents so Ops teams can detect critical issues faster.

    Now available in the Splunkbase App Store, the BigPanda App for Splunk allows Ops teams to trigger BigPanda incidents from Saved-Search Alerts by using the Custom Alert Actions capability in the Splunk 6.3 release. This app adds an option to the +Add Actions list in the Splunk user interface, making it easier than ever to correlate all alerts in BigPanda.

    BigPanda’s new integration with Datadog makes it easier to integrate the two systems in minutes and synchronize Datadog alerts with BigPanda incidents. BigPanda features like Environments, AutoShare rules, and Operational Analytics can now be used to help Datadog customers monitor infrastructure and reduce the time required to investigate and resolve issues.

    About BigPanda

    BigPanda’s mission is to keep businesses running by improving how IT teams manage the explosion of IT data they receive every day. BigPanda uses data science to analyze massive volumes of IT alerts from fragmented clouds, applications and systems and turn them into actionable insights. Founded in 2012, the company is backed by Sequoia Capital, Mayfield and Battery Ventures. BigPanda is headquartered in Palo Alto, California. For more information visit www.bigpanda.io or follow BigPanda on Twitter @bigpanda.

    Contacts

    BigPanda:
    Joe Schwartz, 415-902-3300
    joe@bigpanda.io

  • Continuous Delivery: The Atlassian Way

    Continuous Delivery: The Atlassian Way

    Sonatype’s Mark Miller (@TSWAlliance) caught up with Ian Buchanan (@devpartisan) for our 2016 DevOps Leadership Series. Ian discussed his experiences at Atlassian, including continuous delivery, ChatOps, and use of tools such as Bamboo, Nexus, Puppet and Datadog.

    https://www.youtube.com/watch?v=MgRaYKHGqeQ

    Buchanan: I’m Ian Buchanan. I’m a Developer Partisan at Atlassian, which is developer advocacy for our developer tools.

    Miller: Ian, most people know Atlassian from solutions like JIRA and Bitbucket.

    Buchanan: Yeah, I focus mostly on Bitbucket and Bamboo. Bamboo’s our continuous integration and deployment tool.

    Miller: Good. One of the subjects we talked a little about at dinner last night is how Atlassian is using Nexus. Can you give us some background on that?

    Buchanan: Yeah, that’s right. Well, we’re a big Java shop. We have been for a very long time and have a lot of Maven dependencies for external reasons; we also store a lot of our own internally developed libraries in our Nexus repository.

    _________________

     We’re a big Java shop. We have been for a very long time … we store a lot of our own internally developed libraries in our Nexus repository.

    _________________

     Miller: As far as a binary repository, are you using it for anything other than components?

    Buchanan: Not that I’m aware of. I know that we’ve recently started to get into Docker quite a bit and Nexus is a good fit for that as well. I don’t know the extent which we’re using Nexus for that purpose yet, as Docker’s still quite new for us.

    Miller: What does your continuous integration pipeline look like?

    Buchanan: It certainly varies by product in the details. Of course, we have our own continuous integration product, Bamboo. Bamboo is the most pervasive tool we have.

    For the Java stuff it’s pretty simple pipeline where libraries get built and published into Nexus so that they can be used downstream. We also have some interesting, newer cloud products that are built with Python. A lot of the deployments, whether they are Java or Python stuff, are handled by Bamboo’s deployment projects. They pull artifacts from Nexus and put them into production.

     _________________

    A lot of the deployments, whether they are Java or Python stuff, are handled by Bamboo’s deployment projects. They pull artifacts from Nexus and put them into production.

     _________________

    Miller: Are you guys using continuous delivery in house for your workflow?

    Buchanan: We’re in an interesting position that I think I see a lot of companies in. We have some behind-the-firewall products (our server products) and then we also have cloud products. In the cloud side, continuous delivery is used when we want to go very fast. But we also have to balance that with the approach we take for our server products so that they don’t fork terribly. We have continuous delivery up until there’s a product delivered. At that point, there is another kind of pick up—where the cloud products engage with other things like Puppet and Ansible to configure the environments with products that other people can pick up and run on premises.

    Miller: I was talking to your team in San Francisco. How are you guys using ChatOps with HipChat?

    Buchanan: I’ve been talking about ChatOps for quite some time. We do a lot of very interesting things with ChatOps. They play a very important part of our continuous delivery pipeline in that we publish build results in there. People can see when pull requests are ready and check those out. We get to see what’s happening from production as well. We have integration with Datadog; it tells us some of the monitoring things that are going on. It’s not just information coming into the chat room. There are also commands that folks can issue to make the continuous delivery pipeline move along. There are certain stages where you can type a command to our ChatOps and they will perform the necessary actions. Much of the deployment and change management happens in a ChatOps context.

    _________________

     There are certain stages where you can type a command to our ChatOps and they will perform the necessary actions. Much of the deployment and change management happens in a ChatOps context.

     _________________

     Miller: Anything coming up in the future you guys are working on that’d be fun?

    Buchanan: Well, a lot of the innovation really happens at our quarterly “Ship It” events. That’s where our developers spend 24 hours doing whatever kind of innovation interests them. A lot of time is spent scratching an itch they have. Some of the things that I saw there were about having more information coming back upstream, not just into the chat rooms, but into JIRA where more of the longer-term tracking is going on. They’re experimenting a lot with putting more information into JIRA.

    Miller: Nice. Final question, if you were going to be a superhero, would it be Dev, Sec or Ops?

    Buchanan: I’ve played Dev roles and Ops roles and I almost feel like I know those much more. But from a lot of the sessions at DevNexus, I have to feel like Sec is the superhero. They’re the superheroes because they solve some unsolvable problems in a lot of ways. But I don’t feel ready to play that role at the moment, myself.

    Miller: It’s interesting. I agree with you that they are unsung heroes. Most of the time they just get hammered for what they’re doing.

    Buchanan: That’s true. Yesterday I was in a session about securing REST endpoints. The speaker went through problems with BASIC off , DIGEST off and J2EE—all of these things which we use in our products. At the end we’re left with, “What is the answer?”

    Well, the answer is that for each of these, there are different problems. So we have to identify the right context. We have to understand where some things are broken, know that those things aren’t perfect, and design for that imperfection. That’s a mindset that we have to carry through dev, ops and sec. I hope more security folks step up and start telling those stories.

  • cPrime and AgileCraft Partner to Scale Agile with Atlassian’s Jira Suite

    Partnership enables organizations committed to Atlassian suite to scale agile across all levels of the enterprise – including team, program, portfolio and enterprise levels.

    Foster City, CA (PRWEB) March 31, 2016

    cPrime, the industry leader focused on solutions to help companies adopt, transform and scale their business with Agile Development methodologies and AgileCraft, the leading provider of enterprise agility platforms to simplify software at scale, have partnered to help companies drive business agility and transformation at scale.

    “Customers interested in scaling agile to the enterprise are rapidly adopting JIRA along with AgileCraft to align business and technology.” Said Zubin Irani, CEO of cPrime. “Our customers tell us that using AgileCraft with JIRA allows organizations to bridge the PPM / ALM gap in a modern and highly scalable way. The result for customers is better software – delivered on time and on budget – with clear visibility and trace-ability from start to finish.

    “Our business model is to embrace partners to drive the implementation and customization of our platform” said Steve Elliott, CEO of AgileCraft. “cPrime already deeply understands the needs of organizations scaling agile, and was looking for a tool to help solve the problem of true enterprise agility. cPrime has repeatedly worked with our team to deliver innovative solutions that accelerate the path to operational agility.”

    Built from the top-down to support agile at scale, the AgileCraft platform helps align entire organizations around common goals and objectives while providing actionable views and metrics to everyone touching the technology product lifecycle.

    To learn more about scaling agile to the with cPrime and AgileCraft on platforms like Jira register for a one-hour complimentary webcast featuring a product overview and technical deep dive to be held on May 10, 2016.

    About cPrime Inc.

    cPrime enhances the full lifecycle of product development with comprehensive solutions for adopting and scaling Agile methodologies and software. Hardware, DevOps, JIRA, cPrime covers it all. The alignment of  people, processes and technology solutions build and optimize a lasting framework for client growth. cPrime works with the most notable enterprises; providing training, consulting, and team augmentations to help organizations adopt and scale Agile methodologies. Additionally, cPrime deploys and optimizes the software used to support client’s unique processes. The cPrime solution sets span the full application lifecycle management pipeline to ensure quick and quality product delivery.

    About AgileCraft

    AgileCraft® delivers the most comprehensive software solution available for scaling agile to the enterprise. AgileCraft transforms the way organizations enable and manage agile productivity across their enterprise, portfolios, programs and teams by aligning business strategy with technical execution. The AgileCraft platform combines sophisticated planning, analysis, forecasting and visualization with robust, multi-level collaboration and management. Designed to be open, the AgileCraft platform compliments and extends existing agile tools, methods and processes and can be deployed through the cloud or on premise. AgileCraft customers get the best agile solution on the market and benefit from a platform that is specifically designed to scale enterprise wide. For more information, please visit http://www.agilecraft.com.

  • 31 Reference Architectures for DevOps and Continuous Delivery

    31 Reference Architectures for DevOps and Continuous Delivery

    At QCon London, David Farley (@davefarley77) told the audience that “continuous delivery changes the economics of software delivery”.  I could not agree more.

    If you have been drawn to the evangelists like David Farley, Jez Humble, and Gene Kim, you’ll know that high performance IT organizations are seeing a massive payoff in their continuous delivery investments.  Industry leaders big and small are sharing noticeable results:

    • 8x more frequent production deployments
    • 50% lower change failure rates
    • 12x faster service restoration times when something went wrong

    5 Principles

    How are they achieving these results?  They are following a few key principles that David and Jez outlined in their seminal book, Continuous Delivery (highly recommended).  The principles outlined in their book and in David’s QCon presentation are as follows:

    • Deliver fast
    • Automate almost everything
    • Keep everything in version control
    • Build quality In
    • Empower the team 

    Reference Architectures for DevOps and Continuous Delivery

    In their book, they also provide insight to continuous delivery tool chains and processes which highlight build tools, CI platforms, testing suites, artifact repositories, and many other components. There are numerous examples of reference architectures available, and each of them vary in levels of detail, tools highlighted, and processes followed.  Yet, there is a constant theme among the tool sets: Jenkins, Maven, Nexus, Subversion, Git, Docker, Puppet/Chef, Rundeck, and Sonar seem to show up time and again.

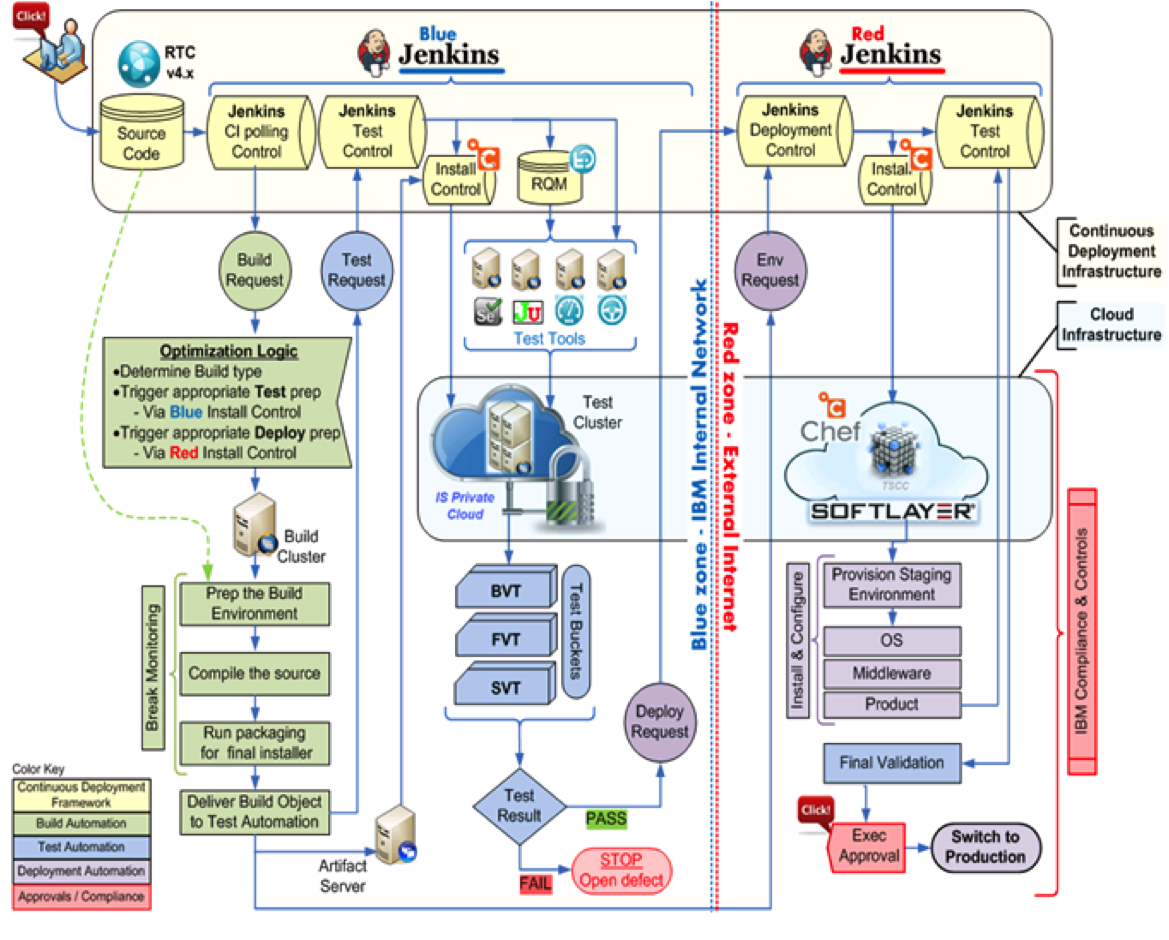
    To help you along your continuous delivery and DevOps journey, I have compiled a set of 31 reference architectures created by users across the continuous delivery and DevOps communities.

     CD and DevOps tool chain

    Each architecture is accompanied by a link to the original presentation or blog where the architecture was referenced to ensure you have access to the full context of the discussion. You can also freely download the presentation from SlideShare where we now have over 7,000 views.

    Offer to help others: If you have a reference architecture to share, please consider posting a link to it in the comments section below.  I am sure others would love to see it and learn from it.