Tag: IT operations

  • Artificial Intelligence: Coming to the Rescue of ITOps

    Artificial Intelligence: Coming to the Rescue of ITOps

    According to McKinsey’s Global Institute Report of 2018, artificial intelligence (AI) has the potential to create an annual value of $3.5 billion to $5.8 billion across different industry sectors. Today, AI in finance and IT alone accounts for about $100 billion; hence, it is becoming quite the game changer in the IT world.

    With the onset of cloud adoption, the world of IT DevOps has changed dramatically. The focus of ITOps is changing to an integrated, service-centric approach that maximizes business services availability. AI can help ITOps in early detection of outages, potential root cause prediction, finding systems and nodes that are susceptible to outages, average resolution time and more. This article highlights a few use cases where AI can be integrated with ITOps, simplifying day-to-day operations and making remediation more robust.

    Predictive Analytics of Outages

    False positives can cause threat alert fatigue for ITOps teams. One survey indicates that about 52 percent of security alerts are generally false positives. This puts a lot of pressure on the teams, as they have to review each of these alerts manually. In such a scenario, deep neural networks can predict whether an alert will result in outages.

        Alerts                                                                                Layers                                                                                 Yes/No

    Feed Forward back propagation with two hidden layers should yield good results in terms of predicting outages as illustrated above. All alert types within a stipulated time can act as inputs and outages would be the output. Historical data should be used to train the model. Every enterprise has its own fault line and weakness, and it is only through historical data that latent features are surfaced; hence, every enterprise should build its own customized model, as a “one size fits all” model has a higher likelihood of not delivering expected outcomes.

    The alternate method is a logistic regression where all “alert types” are input variables and “binary outages” would be the output.

    Logistic regression measures the relationship between the categorical dependent variables and one or more independent variables by estimating probabilities using a logistic function, which is the cumulative logistic distribution. Thus, it treats the same set of problems as probit regression using similar techniques, with the latter using a cumulative normal distribution curve instead.

    Root Cause Classification and Prediction

    This is a two-step process. In the first step, root cause classification is done based on keyword search. From free-flow root cause analysis fields, natural language processing (NLP) is used to extract key values and classify into predefined root causes. This can be either supervised or unsupervised.

    In the second step, random forest for multi-class neural networks can be used to predict root causes while other attributes act as input. Based on the data volume and the datatype, one can choose the right classification model. In general, random forest has better accuracy, but it needs structured data and right labeling and it is less fault-tolerant to data quality. While a multi-class neural network will need a large volume of data to train, it is more fault-tolerant but slightly less accurate.

    Prediction of Average Time to Close a Ticket

    A simple weighted average formula can be used to predict time taken for ticket resolution:

    Avg time (t) = (a1.T1 + a2.T2+ a3.T3 )/(count of T1+T2+T3)

    Where T1 are ticket types.

    Other attributes can be used to segment the ticket into right cohorts to make it more predictable. This helps in better resource planning and utilization. Weightage of features can be done heuristically or empirically.

    Unusual Load on System

    Simple anomaly detection algorithms can inform whether the system is going through a normal load or it has high variance. A high variance/deviation from average on time series can inform the unusual activities or resources that are not freeing up. However, the algorithm should take care of seasonality, as a system load is a function of time and season.

    Given the above scenarios, it is obvious that AI has a tremendous opportunity to serve IT operations. It can be used for several ITOps including prediction, event correlation, detection of unusual loads on system (e.g. cyberattack) and remediation based on root cause analysis.

    — Vivek Singh

  • Cloud Performance Management Needs Precedence Over APM in a Cloud World

    Cloud Performance Management Needs Precedence Over APM in a Cloud World

    A majority of today’s businesses follow a cloud-first strategy. DevOps engineers with these businesses prefer using infrastructure as a service (IaaS), platform as a service (PaaS) or cloud services from leading cloud services providers (CSPs). Given the rate at which the IT is evolving now, from on-prem to XaaS, the future seems a lot more promising for Dev and Ops of an application.

    But while the IT has evolved, have the monitoring and management tools evolved along these lines, too? Many DevOps engineers still use the good-old application performance monitoring (APM) tools for measuring the performance of apps and for debugging issues.

    This article deliberates on shifting the focus from application performance management (APM) to cloud performance management (CPM).

    APM is Good,  Infra-Centric APM is better, CPM is the Best

    Use of cloud services is a norm in DevOps today. On the one hand, these services act as building blocks for developing or running application(s) and contribute heavily to the performance of that application. On the other hand, they bring with them several layers of idiosyncratic abstraction layers. To top it, new cloud services or SaaS occasionally introduce new trends.

    The monitoring and management market has yet to catch up with the pace at which IT is evolving. There are only a handful of cloud monitoring tools available in the market, and they provide siloed reports and dashboards. Result: DevOps engineers are still stuck with good-old APM tools.

    APM tools are good at offering insights. However, these insights are just enough to understand what’s happening in the application tier.

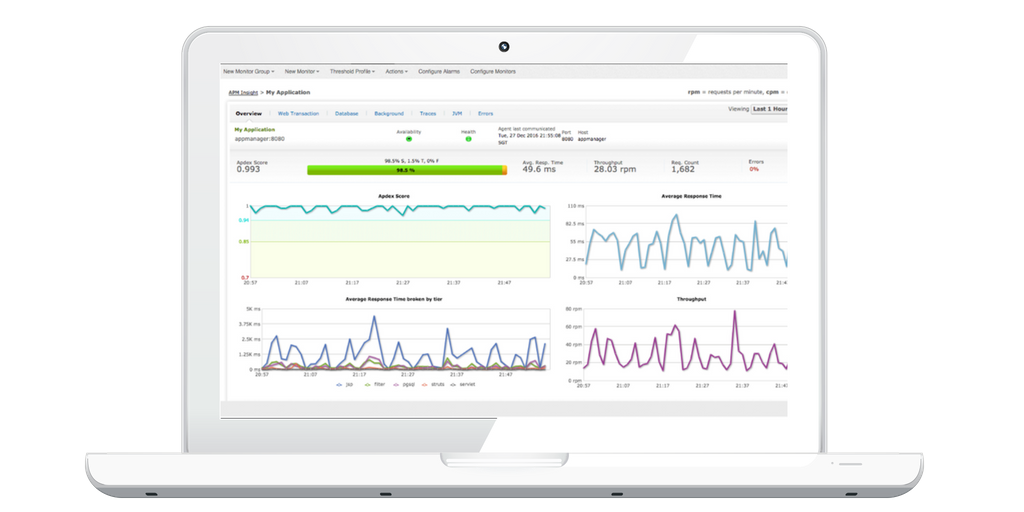
    If you observe the above APM dashboard, there’s the summary of server status and app throughput, response time and more beautifully packaged with visualization graphs. If there’s a need, one can even get information on CPU usage, memory usage, disk usage details, etc.

    Then there are infra-centric APM tools that go one level beneath the app tier to provide information on network statistics, such as bandwidth or opened ports. However, none of the tools provide complete contextual information. Day in and day out, a DevOps engineer must dabble with several dashboards.

    Let’s take a look at a very simple scenario. Assume there is an image processing web application leveraging AWS cloud services such as EC2, S3 bucket for storage and SQS for queuing:

    From the APM tool, you can continuously monitor the application for response time, then app servers for metrics such as throughput (with <=10 images), CPU utilization, etc. Everything looks fine on the top while the pipeline is moving smoothly.

    Then one day, the number of users using the app at a particular time increases and the jobs start queuing up quickly on SQS, and the response time of the application suddenly goes low. However, the performance of all the servers seems fine on the APM tool.

    In such a scenario, how do you debug the root cause that is affecting the response time without having a monitoring tool that is watching the AWS SQS?

    Of course, AWS provides its own console to monitor its services. If the DevOps engineer is aware of the root cause, debugging is a child’s play. However, when the underlying issue is unknown, it leads to dependency on several tools, which can unearth facts for them.

    When a business’ application or applications are dependent on several cloud services that do not have a monitoring tool yet, how can an APM tool, which can pull only specific data, help provide complete visibility?

    In this cloud-driven world, a developer needs to be aware of how their application interacts with different tech stacks, and how that interaction drives performance, availability and cost.

    Unified CPM Complements APM Bringing the Complete Context

    The industry has traditionally separated the performance management of applications and infrastructure, resulting in multiple toolsets in each of these domains.Neither APM nor IPM alone will successfully address and solve shift-left monitoring requirements.

    APM focuses only on the application tier providing visibility into just part way down the tech stack. If you are a DevOps engineer with an enterprise or an SMB looking into different customer applications, you know it is difficult to make sense of all the resource usage across availability zones and make a case of each application’s cost/performance trade-off, ability to scale, time-to-market, etc. While the cloud services make it easier for development, each service has its own learning curve and abstraction.

    A unified CPM tool thrusts the context up to the shore of APM, in a tech stack. Developers need such tools where they can monitor all the services and get end-to-end visibility from a single pane of glass.

    Conclusion

    Analyzing performance of each dynamic service in context with other dynamic players (services) in the tech stacks will quickly provide the right context and help detect an underlying problem easily—especially, in cases where the problem lies with the cloud resources rather than the application code itself.

    — Pradeep Kumar

  • Ops: The Other DevOps

    Ops: The Other DevOps

    Much of the conversation around DevOps, including right here on devopsy.kinsta.cloud, is about helping developers get easier access to production systems, increasing agility by shortening release cycles. Most of the time, this focus on developers leads to a concentration on so-called “Day One” tasks, the Dev side of the equation, to the exclusion of “Day Two” operations—the Ops side of things.

    Cows in a field with farmer
    Photo via Damien Kuhn – https://unsplash.com/@producteurslocaux

    Recent moves in the DevOps market underscore the fact that the weight is still very much on the Dev side, and not so much on Ops. Microsoft buying GitHub is huge news, don’t get me wrong, not least because many people are still stuck in a very Nineties conception of Microsoft, and this acquisition should help clarify that this is not your parents’ Microsoft (full disclosure: my employer, Moogsoft, has a strategic partnership with Microsoft). News on the Ops side of the house, meanwhile, rarely achieves the same prominence.

    The reason for this imbalance is to be found in DevOps’ origin myth. The story is all about developer frustration with risk-averse operations procedures which prevented them from deploying as rapidly and frequently as they would have liked to. As with most good stories, there is a kernel of truth here, but the truth is more complicated. Ops people are risk-averse for good reason: When they mess up, they don’t have a safety net, and they get a lot of very public blame.

    That said, it is certainly true that a reasonable aversion to risk can be taken too far. Couple that with a very human tendency to define oneself by one’s job, and you wind up with people putting hands to keyboards for even basic, routine tasks, becoming bottlenecks for huge processes.

    What Does DevOps Mean To Ops?

    The biggest benefit of DevOps from an Ops perspective is that it has forced that hard conversation about moving from artisanal, handcrafted IT infrastructure, to industrial and scalable models that don’t require a human in the loop for routine operation. This cultural shift began with the famous pets-versus-cattle analogy, but the transition is far from being complete.

    A big sign that there is still work to be done is the relative lack of sophistication around tooling  in IT Operations. There is a lot of talk about software-defined infrastructure and desired-state automation, but relatively little practical uptake, especially when it comes to operating such frameworks day-to-day. These new models will require a wrenching transition from traditional Ops models, with pervasive automation working to augment human sysadmins’ capabilities.

    This is not the old style of automation, with cron jobs and shell scripts, which any BOfH worth their etherkiller has been doing for decades. The new serverless frameworks do away with the last vestiges of persistent coupling of infrastructure components to individual business services. What vMotion promised in 2003 is now coming to pass, with workloads moving, growing and shrinking to support changes in user demand, and infrastructure reconfiguring itself top to bottom in response.

    Key Questions To Ask About Operational Automation

    In this context, operational automation can no longer work on the old model of “set it and forget it.” Every process set in motion needs real-time contextual awareness of what is going on around it and how that is constantly changing. Without that visibility, backup scripts may go on faithfully backing up what used to be a high-priority server, but is now a backwater of the application infrastructure. Meanwhile, the cloud services where the bulk of the application’s logic runs are not meaningfully integrated into the disaster recovery (DR) plan.

    All of these facets need to be reviewed regularly, in terms of need, function and ownership.

    Who Needs This Automation?

    Anything that runs should be linked to some kind of business requirement, however indirectly. “This ensures that our infrastructure can scale and flex seamlessly in response to user demand”: Good. “This keeps our operating systems patched”: A valid goal, but do we need to do it in production if the average lifetime of provisioned operating systems is shorter than the patch cycle? Just patch the templates and you’re done. “We’ve always done it this way, and I’m not sure what might happen if we stop”: Time to set some chaos monkeys loose, and see what happens.

    What is the Function of This Automation?

    We are in the middle of huge technological transitions, and the waves of innovation keep coming closer and closer together. As an industry, we had just about come to terms with virtualization by the time cloud computing came along, but that was far from settled when containerization got underway, and it looks like that may be undermined by serverless architectures before it even comes to its full fruition. Watch out for hidden assumptions in terms of the way you go about a task, and check back in regularly. Ops types should take a leaf from Dev’s book, and regularly consider refactoring their automation to remove cruft and take advantage of new developments.

    Who is the Owner of This Automation?

    Someone has to own every piece of automation, so that they can maintain it over time according to the previous two points, and so that everyone else knows who to call if (or realistically, when) it breaks. Again, developers have been talking about technical debt for a long time: the impact of older, unmaintained code. Meanwhile, sysadmins used to pride themselves on the uptime of individual servers. That attachment needs to move from the individual server to the overall infrastructure and the automation and management that develop over time to ensure its availability and performance. They’re cattle, not pets, remember?

    Ops is the Other DevOps

    As Ops becomes more and more about managing the automation, the distinction between Dev and Ops starts to blur. With Dev roles “picking up the pager” and taking responsibility for production operation of their software, Ops roles develop more and more code to fulfill the promises of those applications. With traditional Ops tasks evolving or even disappearing, new roles will appear. The job of automation architect will become much more relevant than any job that requires someone to ssh into an individual server or router. In this transition, old-school Ops people can learn a lot from what our Dev colleagues have been up to over the last few years.

    One day, the term DevOps will no longer describe developers and non-developers, but two different types of developer, one focused on business logic and one on architectural underpinnings.

    — Dominic Wellington

  • CA Technologies Looks to Shift Automation Left

    CA Technologies Looks to Shift Automation Left

    CA Technologies, at its recent CA Automation Summit, advanced its case for leveraging automation to create a software development factory via an update to the CA Automic One automation platform that adds automation-as-code functionality.

    Gwyn Clay, vice president of product management for the Automation Business Unit at CA Technologies, said the latest release of CA Automic One make is simpler to “left shift” automation artifacts by making it possible for developers to embed those artifacts within application code versus having to wait for a DevOps teams to run them out of band.

    The latest version of CA Automic One also now includes version control and lifecycle management for automation artifacts that enables automation objects such as jobs, workflows and scripts to be promoted from development to production as part of an integrated DevOps process, said Clay.

    CA Technologies also revealed it is embedding intelligence into workflows enabled by CA Automic One, which enables dynamic runtime estimations that can predict potential issues within certain paths in the workflow execution.

    Other new capabilities added to the automation platform include support for PostgreSQL databases, as well as new integrations with CA Workload Automation, CA Continuous Delivery Director and CA Jarvis analytics software delivered as a cloud service.

    CA Technologies has been on a multi-year campaign to embed automation across the entire DevOps processes. With this latest release, that campaign effort is being extended to developers themselves. Clay said the rise of digital business transformation—much of which is being driven by cloud-native applications built with technologies such as Docker containers, Kubernetes orchestration software and serverless computing frameworks—is finally forcing the automation issue in the enterprise. Not only are applications being built faster than ever, but the complexity of those applications has increased exponentially. And yet, the size of the overall IT staff has remained stagnant. Without some form of automation being embedded within the applications itself modern software development practices becomes difficult to sustain, she said.

    Clay noted that most organizations are not yet at the point where they are deconstructing monolithic applications into a set of microservices. But it’s already clear most new applications will be built on a microservices architecture. CA Automic One represents an opportunity to apply automation across both legacy monolithic applications in addition to embedding artifacts directly within new applications, she noted.

    It’s not clear the impact the ability to embed automation artifacts will have on how enterprise IT is managed going forward. IT operations teams still will need to be able to set policies and constraints concerning the level of automation a developer might be able to invoke. Most developers don’t have much regard for the need to share limited infrastructure resources with other applications. But as the ability to infuse automaton into almost every application becomes pervasive, the locus of power within enterprise IT organizations will continue to shift to the left. The challenge now is determining the best way to strike a balance between all the competing factions looking to control who gets to automate what exactly when.

    — Mike Vizard

  • The Need for a Command Center in Managing Complex IT Operations

    The Need for a Command Center in Managing Complex IT Operations

    A few days ago, I was traveling from Bangalore to Mumbai. It was an overcast and wet morning so I started out early to avoid having to battle traffic and worry about the prospect of being delayed. At the airport, I checked in, went through the usual formalities and boarded the flight.  I was anticipating a delay, but to my surprise the flight was on time.

    While we were approaching the main runway, I could see many flights ahead of us in a queue, waiting for their turn to take off. At the same time, there were two planes that had landed within a couple of minutes of each other. The entire environment of the runway and the surroundings looked terribly busy. While our flight was preparing to take off, the air traffic control (ATC) tower grabbed my attention. That tall structure looked very calm in the midst of what seemed chaos, orchestrating every move of all the planes, making sure that the ground operations were smooth, error-free and efficient in difficult weather conditions.

    I started comparing the runway and airport ground operations with that of the complex IT environment in enterprises today, and the challenges it poses to the IT operations teams. Today, critical business services reside on complex IT infrastructure such as on-premises, cloud and hybrid cloud environments. These require security, scalability and continuous monitoring. But do they have the ATC or the command center that can orchestrate and monitor all the IT assets and infrastructure for its smooth functioning? For instance, if the payment service of an e-commerce service provider is down for few minutes, it would have to incur significant losses and impact overall business opportunities creating an adverse impact.

    Perhaps, today’s IT operations team needs one such command center, just like an ATC at the airport, so that they can fight downtime, eliminate irrelevant noise in operations and provide critical remediation. This command center should have the ability to provide a 360-degree view of the health of the IT infrastructure and availability of business services besides providing the topology view of dependent node structure. This could help in assessing the root cause analysis of a particular IT incident or event occurrence. The command center should also provide a complete view of all IT assets, aggregated alerts, outage history and past incident occurrence and related communication, enabling the IT team to predict the future occurrence of such events or incidents to prevent the outages of critical business services. In case these outages or incidents did occur, it would be a boon for the IT operations team if a command center could provide critical data-driven insights and suggest remedial actions, which in turn could be provisioned with proactive BOTs.

    I arrived at my destination on time, thanks to the ATC, which made it possible, despite the challenging and complex weather conditions. This brings me to a critical question that I need to ask: Do you have the required ATC or command center for IT operations to help you sustain, pre-empt and continue with business operations in a complex IT environment?

    — Neeraj Deuskar

  • Splunk Pushes Into the Realm of DevOps

    Splunk Pushes Into the Realm of DevOps

    On the heels of its recent acquisition of VictorOps, provider of incident management software, for $120 million, Splunk is gearing up to expand its foothold in DevOps significantly.

    Rick Fitz, senior vice president of IT Markets for Splunk, said the provider of widely used operational analytics software in the enterprise sees a significant opportunity to expand its presence across a range of DevOps processes.

    Incident management is a natural extension of operational analytics, said Fitz, noting Splunk chose to acquire VictorOps because the investments the company has made in applying machine learning algorithms to monitoring IT events. That approach significantly reduces the number of irrelevant alerts being generated and provides actionable intelligence into potential events that could adversely impact IT operations.

    Most IT operations teams suffer from alert fatigue, Fitz noted, and most alerts are ignored because of a lack of context. The combination of Splunk and VictorOps will result in alerts that more precisely identify the root cause of any IT issue, he said, and a better overall “systems of engagement” for IT operations teams in keeping with DevOps principles.

    Splunk has been steadily expanding its focus on DevOps. Earlier this year the company announced Splunk Insights for Infrastructure, which IT organizations can host on an Amazon Web Services (AWS) public cloud to monitor IT infrastructure deployed anywhere. The latest versions of Splunk Cloud and Splunk Enterprise also make use of machine learning algorithms on top of a revamped metrics engine that enables IT administrators to monitor everything from CPU speeds and available hard disk space to temperature readings in internet of things (IoT) devices and sensors. Splunk recently also added connectors for Docker and Kubernetes, as well as the Apache Kafka messaging platform for streaming data in real time.

    IT operations and cybersecurity teams already rely on Splunk operational analytics software extensively to identify anomalies. By investing in machine learning algorithms and acquiring incident management software, Splunk is moving to turn all the data it analyzes into actionable intelligence, which then could be shared in real time with developers to ensure application availability and optimize application performance.

    While adoption of DevOps processes in traditional enterprise IT organizations remains spotty, IT vendors that focus on IT operations such as Splunk have clearly seen the writing on the wall. Fitz noted that investments made in machine learning algorithms, for example, will enable IT operations teams to more respond to changing application requirements with greater agility at a time when the IT environment has become exceedingly complex. That agility is critical for any organization engaged in digital business transformation, Fitz said, because invariably those efforts lead to more applications being deployed.

    It’s not clear the degree to which incumbent providers of IT operations software will be able to remain relevant in the age of DevOps. But most of them certainly have the financial resources to at the very least acquire a portfolio of DevOps tools that will enable them to exert a lot more influence than many of them have to date.

    — Mike Vizard

  • Benefits and Drivers of Full-Stack Monitoring

    Benefits and Drivers of Full-Stack Monitoring

    As organizations undergo digital transformations, there is increasing need to modernize the way IT operations is managed and to deliver applications faster, while at the same time delivering business value by managing applications’ availability, performance and outages in a cost-effective way.

    Because outages have a huge impact on revenue, there is a growing demand for site reliability people and monitoring systems, which can enable them to handle applications’ uptime, performance and reliability with a proactive and predictive monitoring approach.

    This article series focuses on the need for full-stack monitoring in today’s digital operations, the considerations for selection of monitoring tools and design considerations for implementing a full-stack monitoring solution.

    Why is Full-Stack Monitoring Necessary?

    Full-stack monitoring refers to the capability of monitoring all of the following:

    1. Infrastructure monitoring—Monitor servers, network, containers, cluster orchestrators, cloud, middleware, app servers, web servers and databases.
    2. Application performance monitoring—Perform log monitoring and analytics, synthetic transactions, sql transactions, data correlation with metrics and logs, end user experience monitoring, profiling and transaction-level tracing with code-level visibility.
    3. Performing end-end monitoring across the workloads in on-premises/cloud/hybrid environments through a centralized dashboard/visibility across the stack.
    4. Provide alerts, analyze, act and remediate the incidents faster, using the instrumentation data leveraging IT service management (ITSM), ChatOps and collaboration tools along with monitoring tools.
    5. Perform Analytics on the data being used to derive insights and predict demands.

    The following are some of the needs driving enterprises to implement full-stack monitoring:

    • Business agility: Business needs to deploy very frequently to sustain the market demands
    • Application reliability: Site/application platform is expected to be reliable, available and scalable, as outages impact revenue and may result in losing business and customers.
    • Bandwidth bottlenecks can impact the application performance, leading to potential business loss and needs network-level deep monitoring.
    • Failure can happen at any level and go unnoticed, leading to overhead in recovery and remediation; hence, monitoring from various sources and at different angles with varied levels are needed.
    • Application complexity and dependencies: Applications use multiple-third party components, multiple hosts and several underlying services, components and infrastructure. If any of these do not function as expected, it can degrade an application’s performance and result in issues/defects going unnoticed—and often reported by end users.
    • Cloud born applications, which are multi-tiered and multi-layered, use mix workloads (PaaS + IaaS) and monitoring of different sources/workloads has to be done for distributed hybrid environments (multi-cloud).
    • Use of virtualization and container technologies, which have enabled environments with dynamic and ephemeral states and such workloads, need monitoring at the orchestration and container levels.
    • Lack of end-to end monitoring tools and lack of visibility across all IT assets and workloads, which has increased the need of centralized monitoring data. The SRE teams need to get stakeholders’ buy-in based on the monitoring data to push back on the bad releases and take calculated risks. They also need to cater different types of monitoring data to different stakeholders and line of business (LOB) owners and overcome cultural challenges to get stakeholders’ buy-in.
    • IT operations needs to forecast an application’s behavior, capacity and performance, based on how the system performs in the given conditions. Machine learning of monitoring data and patterns can help predict capacity and anomaly.
    • Large volumes of data are collected from multiple sources giving out metrics, logs, etc., for various components of the stack. The IT operations team needs in-depth information about the components and dependencies along with metrics to provide contextual/correlation information. They need to correlate the data to determine symptoms and causes for faster troubleshooting. As such, they need monitoring tools that can provide correlation out-of-box to reduce the effort involved in triaging.
    • Configuration changes: Deployment of application/infrastructure/services are done through infrastructure as code automation scripts, which may contain issues in configuration. Lack of testing infrastructure, services and application end to end can increase the number of issues to be resolved; hence, there is a need of monitoring right from provisioning of resources, usage, maintenance and de-provisioning of resources.
    • Lack of end user perspective and business metrics from traditional tools, coupled with the need to eliminate toil and perform faster triaging/post-mortem and automated incident resolution, demands use of new-age full-stack monitoring tools.

    Growing business demands and agility, application reliability, deriving business insights and end user experience analytics are the key drivers for implementing full-stack monitoring. Hence, the IT operations traditional approaches are rapidly being transformed to digital operations (SRE operations), along with DevOps practices being widely adopted across enterprises.

    In the second and third articles in this three-part series, we’ll look at the considerations for selection of monitoring tools and design considerations for implementing a full-stack monitoring solution.

    — Lavanya Subbarayalu

  • Riverbed Throws Down APM Gauntlet

    Riverbed Throws Down APM Gauntlet

    Riverbed Technology has expanded its approach to unifying application performance management (APM) and user monitoring based on a new architecture for its SteelCentral platform, now capable of supporting tens of thousands of agents monitoring billions of transactions per day.

    Nik Koutsoukos, vice president of product marketing and product management for Riverbed, said auto-tuning and data compression mechanisms combined with cluster architecture now makes it possible to analyze all the data in the enterprise to determine precisely where bottlenecks are adversely affecting user experience.

    In contrast, rival APM offerings only sample transactions and sacrifice metadata as well as depth in terms of being able to delve into a complete stack of software and associated IT infrastructure, he said.

    Koutsoukos noted the way APM is being applied will fundamentally change as organizations embrace digital processes. Most organizations today apply APM sparingly across a limited number of mission-critical applications. But as business processes become digitized, customer satisfaction increasingly will be determined by the quality of the application experience. That can’t be accurately determined without being able to leverage a set of software-as-a-service (SaaS) applications capable of monitoring the entire IT environment, he said.

    Riverbed, with this release of SteelCentral, is also adding analytics infused with artificial intelligence capabilities, as well as machine learning and predictive analytics to keep track of transaction trends over time. This release introduces a “Prism” report that analyzes longitudinally at the conversion funnel for a business transaction flow to visualize trends over time, spot issues and then resolve associated problems.

    In addition, Riverbed is adding support for Riverbed Xirrus Wi-Fi access points, which the company acquired last year, to the SteelCentral platform.

    Industry research suggest that only 5 percent of enterprise applications are actively monitored, Koutsoukos noted, but Riverbed is expecting that to change in a digital age where IT essentially has become the business. More senior business executives are soon going to be equating application performance with customer engagement and, by extension, opportunities to generate revenue.

    Riverbed expects that monitoring all those distributed applications and associated IT infrastructure will be possible only by using a set of software-as-a-service applications, which Koutsoukos said in many cases will pay for itself by eliminating the need for various application and infrastructure monitoring tools in silos across the enterprise.

    Given the relative light adoption of APM tools, the rise of digital business may provide an unexpected benefit for DevOps teams. As line-of-business managers demand more insight into the IT environment, the amount of metrics that should become available to DevOps teams should correspondingly increase. The challenge may lie in educating business managers why those metrics are relevant to them and then getting them to fund their acquisition.

    In the meantime, DevOps teams should be prepared for a lot more questions relating to application performance coming from business managers. Not every one of those questions might be all that informed. But over time, an educated business executive always makes for the best DevOps customer.

    — Mike Vizard

  • AppDynamics Taps into SAP Applications

    AppDynamics Taps into SAP Applications

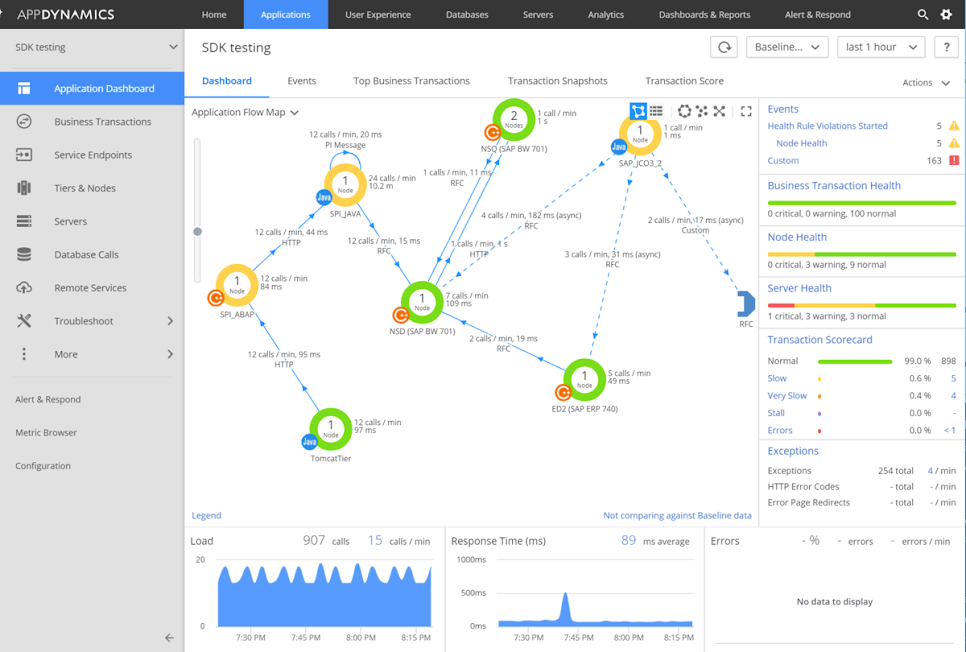
    Application performance management (APM) is starting to be  employed more widely as more organizations embrace digital business transformation. As the number of digital business processes spanning multiple applications increases, so does the need to understand what’s occurring inside both greenfield and legacy applications. In fact, at the heart of many of those digital business processes are enterprise resource planning (ERP) and customer relationship management (CRM) applications from SAP. To make it possible to gain insights into those applications AppDynamics, a unit of Cisco Systems, announced today it is making available AppDynamics for SAP.

    Jonah Kowall, vice president of market development and insights at AppDynamics, said his company is now able to support ABAP, the proprietary language SAP developed to build its applications. That language also has been employed extensively by IT organizations to customize those applications.

    SAP currently is trying to transition its customers to building custom applications on a cloud framework based on the Cloud Foundry platform-as-a-service (PaaS) environment. Most of those applications are be written in Java or the new Jakarta platform that replaces Java. SAP has also provided a software development kit and application programming interfaces (APIs) for tapping into S/4 HANA ERP applications.

    But there is a massive installed based of ABAP applications running in enterprise IT environments. Much of that code is now being integrated with other applications as part of a larger digital business transformation initiative.

    Kowall said those extensions are now driving organizations to apply an agent for the AppDynamics APM to custom applications written in ABAP. Historically, enterprise IT organizations only applied APM to their most critical applications. But as organizations move to digitize business processes, they now need to able to track transactions spanning multiple applications. Given the reliance many organizations have on SAP applications, it’s inevitable those transactions will involve SAP applications that were customized using ABAP.

    In addition, Kowall noted that being able to discover precisely where those custom applications are involved in any transaction is pivotal when it comes to upgrading to the SAP S/4 HANA applications, which are based on the SAP in-memory database, or lifting and shifting a legacy SAP application into the cloud.

    Kowall said organizations that have used ABAP to customize SAP applications now will have visibility down to the code level, including queries being made to the underlying database. From a DevOps perspective, that capability will go a long way to breaking down yet another silo in the enterprise. AppDynamics expects the first order of business for many organizations will be simply to create a performance baseline for their ABAP applications, which in many cases are likely to be an eye-opening experience, he said.

    The focus on digital business transformation is likely to spur adoption of DevOps processes over a much broader swath of the enterprise. Rather than simply apply DevOps processes to new applications, many organizations soon will extend DevOps into the realm of legacy application environments as well. That may take some time to play out, given the scope of the cultural changes involved. But at this point, those changes are now all but inevitable.

    — Mike Vizard

  • Red Hat Positions PaaS as Cure to Heal DevOps Divide

    Red Hat Positions PaaS as Cure to Heal DevOps Divide

    Red Hat is making a strategic bet that IT organizations increasingly will rely on platform-as-a-service (PaaS) environments to make a broad range of distributed services available to developers, which would eliminate friction without enabling IT operations teams to maintain control.

    Paul Cormier, president of products and technologies for Red Hat, said IT organizations are realizing PaaS environments such as OpenShift have evolved into a platform through which a broad range of curated distributed services can be exposed to developers by IT operations teams. That capability is critical because, otherwise, developers simply go around the IT operations team to download libraries. IT operations teams before too long are asked to support applications of uncertain provenance that in many cases wind up duplicating functions.

    As appreciation of the role PaaS environments play in enterprise IT, Cormier said Red Hat is increasingly having conversations with CIOs and other senior IT leaders who are trying to bridge the historic divide between developers and IT operations teams by exposing a broad range of curated distributed services via well-defined application programming interfaces (APIs).

    Red Hat is expanding the types of applications that can run on OpenShift alongside traditional 12-factor applications. In fact, by embracing Kubernetes container orchestration software, Red Hat is effectively obliterating the line between a PaaS and container-as-a-service (CaaS) environment, Cormier said, adding OpenShift makes it possible to build and deploy those applications on-premises or in the cloud as IT organizations deem best, based on cost, data gravity and regulatory requirements. Serverless computing frameworks will make it possible to bridge those environments by invoking an event-driven framework to take advantage of, for example, cloud bursting in a heterogeneous hybrid cloud, he said.

    In fact, Cormier noted more IT organizations will mix and match internal and external services, as each platform tends to run different classes of application workloads better. For example, IT organizations may want to be able to invoke one type of artificial intelligence (AI) service on one cloud over another based on their performance attributes.

    Traditional enterprise IT organizations are not looking to eliminate the need for IT operations teams, he said. Rather than have developers take over IT operations, most organizations would prefer to maximize the amount of time developers spend building and testing applications. The need to build more applications faster than ever will force IT leaders to separate those concerns to eliminate much of the internal friction that results when developers throw application code over the proverbial IT operations wall, Cormier said.

    Most IT organizations have yet to embrace a PaaS environment broadly. There tend to be pockets of adoption. But most applications today are still built and deployed without employing a PaaS environment, mostly because PaaS environments are viewed by many as being too prescriptive in terms of dictating application development workflow. Red Hat is betting that with the rise of microservices-based applications based on containers, many IT organizations will finally decide to trade a little less control in exchange or for much less IT infrastructure complexity.

    — Mike Vizard