Tag: application performance management

  • LinearB Aligns with Clubhouse to Advance Project Management

    LinearB Aligns with Clubhouse to Advance Project Management

    LinearB, a provider of an analytics application for software delivery projects, announced today it has allied with Clubhouse, a provider of a project management application that includes built in collaboration tools.

    LinearB’s analytics application uses code, Git logs and releases to automatically construct and visualize detailed timelines without requiring any manual input. That data can now also be automatically fed into the Clubhouse project management application.

    Dan Lines, COO, LinearB, said the goal is to make it possible for any project participant to keep track of updates without spending hours manually compiling and entering data into a project management application.

    In addition, DevOps teams can use both applications to gain visibility into every feature, bug and chore via a live feed of activity generated by branches, pull requests and releases for Clubhouse stories. Along with tools for tracking individual activity and collecting metrics, blockers, delays, high-risk code and branches merged without review for Clubhouse stories are also highlighted. There is also a shadow work detector that detects activity in a Git repository that is not attached to a Clubhouse story.

    Lines said one of the project management challenges organizations face today is the tools they employ only allow them to see segments of a DevOps pipeline. The LinearB analytics application unifies the data and metrics required to make an informed decision, without having to first collect and then normalize data residing in different tools. Instead, all the metrics required to make an informed decision about how best to allocate limited software development resources is automatically collected from the tools the DevOps team employs, Lines said.

    There is no need, then, for project managers to pester members of a DevOps team to enter data in a separate analytics or project management application, Lines added. Given the rate at which application development projects are now updated, much of the data manually entered into a project management application is usually outdated, anyway.

    LinearB employs the application programming interfaces (APIs) exposed by DevOps tools to gather the existing metadata about the status of any given project. LinearB then employs machine learning algorithms to construct and correlate that data to give DevOps leaders more accurate insights into the status of a project, instead of requiring that data to be entered manually.

    In fact, Lines said meetings should be shorter, too, because rather than the need to provide a status update, it will become apparent to everyone what the real status of a project is before a meeting even starts. That means more time can be allocated to determining how best to optimize limited application development resources, Lines said.

    In the wake of the COVID-19 pandemic, organizations have more application development initiatives underway than ever. Many of these projects are core to digital business transformation initiatives which a core group of developers are working on simultaneously. Being able to dynamically reallocate resources to a faster-moving project from one that is stalled is increasingly critical. The challenge has been that the more projects there are, the harder it becomes to collect data that accurately reflects their true status at any given time. The goal should be to eliminate the need to reenter data that, in one form or another, already exists in another tool.

  • Dynatrace Extends Reach of Observability Platform

    Dynatrace Extends Reach of Observability Platform

    Dynatrace this week updated its observability and software intelligence platform as part of an effort to expand its reach across modern enterprise IT environments.

    Announced at the online Dynatrace Perform 2021 conference, the company’s namesake platform can now capture logs from Kubernetes and Red Hat OpenShift as well as Amazon Web Services, Google Cloud Platform and Microsoft Azure cloud platforms.

    In addition, Dynatrace is adding support for open source log data frameworks such as Fluentd and Logstash. Those logs can now be centrally viewed via a Dynatrace Log Viewer that enables IT teams to search, analyze and segment both real-time and historical log data.

    Dynatrace also added a Cloud Automation Module based on Keptn, an open source tool for automating configuration of observability tools, orchestrating code tests and quality checks. Keptn was created by Dynatrace and is being advanced under the auspices of the Cloud Native Computing Foundation (CNCF).

    The company also launched a Software Intelligence Hub to make it easier to access more than 500 pre-configured integrations, as well as access tools for creating integrations without having to write code.

    Dynatrace also announced it has extended a previously launched Application Security Module to now include support for Node.js applications. In addition, the module includes the ability to enforce security policies against applications instrumented with its agent software, and offers extended capabilities to enable the detection of Kubernetes cluster vulnerabilities, as well.

    Finally, Dynatrace has added a Session Replay capability to its Digital Experience Module to enable IT teams to capture a mobile application experience.

    Steve Tack, senior vice president of product management at Dynatrace, said the company is moving quickly to add support for platforms and technologies widely employed within cloud-native applications to provide IT teams with a single platform through which they can manage monolithic and microservices-based applications.

    With the rise of microservices, IT environments are becoming too complex to manage without some type of observability platform. Historically, cost concerns limited IT teams to employing application performance management (APM) platforms, such as Dynatrace, only for their most mission-critical, monolithic applications. It’s now become apparent that observability platforms capable of correlating log and telemetry data captured from applications and infrastructure are required to effectively manage a modern IT environment.

    As part of that effort, Dynatrace is now collecting data from additional sources alongside the agent software it provides. That data is then fed into an observability platform, that Dynatrace has augmented with a Davis AI engine, to identify anomalies and other potential issues by employing machine learning algorithms.

    It’s not clear to what degree IT teams completely trust the recommendations surfaced by any AI engine. However, as platforms such as Dynatrace collect more data from an IT environment, the more accurate AI models tend to become. In fact,  IT teams that don’t have access to AI capabilities might soon be at a distinct disadvantage, compared to other IT teams that do.

    In the meantime, the battle for observability supremacy continues to intensify, as incumbent providers of APM platforms such as Dynatrace look to forestall a host of startup rivals, all promising greater visibility into IT environments at a lower cost. The challenge now is determining what level of visibility is achieved, and at what total cost.

  • New Relic Adds Visualization Tool to Observability Platform

    New Relic Adds Visualization Tool to Observability Platform

    New Relic announced today it has added a visualization tool, dubbed New Relic Explorer, to make it simpler for IT professionals to discover the root cause of issues that adversely affect application performance.

    Buddy Brewer, global vice president and field CTO for the Americas, New Relic, said the goal is to make it simpler for IT professionals to navigate and, ultimately, act on, all the metrics collected by the New Relic One observability platform.

    New Relic Explorer includes a New Relic Lookout capability that enables IT teams to drill down into telemetry data gathered from New Relic One, as well as other third-party sources, and a New Relic Navigator capability for determining the health of relationships between services, said Brewer. These capabilities make it possible to more easily identify correlations, abnormal history and traces that would be, for example, indicative of blind spots or unknown relationships between IT services, Brewer said.

    Just as importantly, IT professionals can more easily discover recent changes to an IT environment, which are most likely the cause of any new issue that is adversely affecting the IT environment, Brewer added.

    New Relic Explorer requires no configuration, and will be included as part of the existing New Relic Full-Stack Observability offering to give IT teams a single unified view of their IT environments, said Brewer.

    As IT environments become more complex, the amount of time spent looking for the root cause of an issue that might only take a few minutes to fix has substantially increased. As a result, organizations are allocating a significant amount of time to convene “war rooms” to identify the source of problems; those problems can now be more readily identified using New Relic Explorer.

    In general, Brewer said, New Relic remains committed to opening up the platform to external telemetry sources, including data collected using open source tools, such as Prometheus and OpenTelemetry agent software, both advanced under the auspices of the Cloud Native Computing Foundation (CNCF).

    New Relic, like providers of similar tools, has recently begun repositioning itself as a provider of an observability platform, rather than of application performance management (APM) tools, that provides insights into both applications and the infrastructure on which they depend. That approach promises to provide IT teams with more context any time an issue arises. As part of that shift, New Relic is making it clear that while it views its agent source as a richer source of telemetry data, its platform can consume relevant data wherever it can be found. New Relic will also remind customers that its agent software, and the other data collection tools it provides, are simpler to install and update.

    The tradeoff, of course, is cost. While open source software itself is free, the total cost of implementing and managing that open source software can be substantial. Regardless of approach, however, the days when IT teams only applied application monitoring tools to their most mission-critical applications because of cost concerns are coming to an end. It has become impossible to manage a modern IT environment made up of both monolithic and microservices-based applications without such capabilities.

  • IBM Acquires Instana to Advance Observability Strategy

    IBM Acquires Instana to Advance Observability Strategy

    IBM this week announced it plans to acquire Instana, a provider of an application performance management (APM) platform that is optimized for microservices.

    Robin Hernandez, vice president of hybrid cloud management and AIOps for IBM, said Instana will plug an observability gap that has emerged in IBM’s portfolio as organizations start to build and deploy cloud-native applications more broadly.

    Previously, IBM provided APM capabilities via a Tivoli portfolio of tools that were optimized for core static Java applications, noted Hernandez. Instana will add an APM platform designed from the ground up to automatically instrument applications as they are being deployed by DevOps teams, he said.

    Istana also provides distributed tracing capabilities that the existing Tivoli portfolio lacks, Hernandez added.

    The data collected by the Instana agents injected into those microservices also will play a critical role in IBM’s overall approach to applying artificial intelligence to IT operations, also known as AIOps. The IBM approach to AIOps seeks to combine data from platforms such as Instana and Tivoli with third-party data sources such as ServiceNow to advance IT automation, he said.

    Available both as a software-as-a-service (SaaS) platform and as software that can be deployed in an on-premises environment, Instana has gained traction as organizations have embraced observability as a core tenet of a set of best DevOps practices. Historically, IT teams only employed APM platforms to monitor their most mission-critical applications because of both the cost of the APM platform and the inherent difficulties involved in applying agents pervasively.

    Hernandez said observability takes monitoring to the next level because instead of simply tracking a known set of processes, platforms such as Instana make it possible to observe interactions in a way that discovers unknown relationships and dependencies between applications and infrastructure.

    IBM plans to primarily focus its Instana efforts on microservices-based applications. However, Instana can also be applied to observe existing legacy applications. IBM is still studying that use case as part of its ongoing due diligence, he noted.

    Massive amounts of capital have been pouring into observability startups that are trying to supplant legacy APM platforms as organizations transition to microservices. Providers of legacy APM platforms, meanwhile, are re-engineering their platforms to support microservices-based applications that are most often deployed on Kubernetes clusters. IBM is addressing that challenge via an acquisition that complements its renewed focus on hybrid cloud computing and AI, Hernandez said.

    It’s too early to say which vendors will triumph in the observability wars, but the one thing that is certain is there is no shortage of options. It’s not clear to what degree the shift to observability will result in the rolling up of a variety of tools to manage IT, but the days when IT tools simply monitored a process are starting to fade away.

  • AppDynamics Expands APM Data Consumption

    AppDynamics Expands APM Data Consumption

    AppDynamics, a unit of Cisco Systems, this week extended the observability capabilities of its namesake application performance management (APM) platform to ingest data from open source tools and agentless services alongside metric collected via its agent software.

    At the same time, AppDynamics has added a Cloud Data Collector that automatically captures data from public cloud services generated by tools such as Amazon CloudWatch from Amazon Web Services (AWS).

    Finally, AppDynamics has added a visualization interface optimized for monitoring cloud-native applications and integration with Cisco’s Intersight Workload Optimizer tool, which organizations can employ to better optimize IT infrastructure resources usage to reduce costs across a hybrid cloud computing environment.

    AppDynamics CTO Ty Amell said the need for deeper levels of observability into IT environments has become more pronounced in the wake of the COVID-19 pandemic. Organizations have launched multiple digital business transformation initiatives that depend on the ability to correlate events occurring in IT environments in real-time. To provide that capability AppDynamics has been investing in machine learning algorithms to analyze data that can now be more easily collected, he said.

    Cisco, meanwhile, has been investing in various machine learning technologies to automate the management of compute, networking and storage infrastructure, which Amell said also serves to provide deeper insights into the overall IT environment when combined with the AppDynamics platform.

    The shift toward a more holistic approach to observability justifies Cisco’s acquisition of AppDynamics, which provides a widely used APM platform. However, much of that shift is being made by DevOps teams, where roles tend to be a lot more conflated than in traditional IT environments. Nevertheless, Amell noted the shift will continue to accelerate as IT organizations realize they can also reduce costs by rationalizing legacy monitoring tools.

    As IT environments continue to become more complex, there’s no doubt the tolerance for spending days and sometimes weeks navigating multiple tools to uncover the root cause of an issue is declining. It’s especially frustrating when the root cause of an issue turns out to be something trivial that can be fixed in a few minutes.

    Of course, it will be up to each organization to strike a balance between observability and automatic remediation of an issue uncovered by an observability platform. Many IT teams prefer to review changes before they are applied.

    Regardless of their level of comfort with automation, the amount of metrics, logs and traces that can be collected and analyzed has increased dramatically. As more of that data is collected, the more precise the observability platform becomes. The challenge now is finding the most efficient way to instrument an IT environment as the number of platforms running either monolithic or microservices-based applications continues to expand. In fact, at this point collecting all the relevant data is still often a bigger challenge than analyzing it.

  • Help Developers Thrive by Finding the Right Platform

    Help Developers Thrive by Finding the Right Platform

    If our developers have what they need to create the best possible applications, they—and our customers—benefit

    Goji Investments was founded on the principle of democratizing access to real estate, business lending, renewables and other alternative investments. The idea is to allow financial service organizations to provide traditionally unavailable investment opportunities to private investors on a global scale. A critical component of the Goji plan for success is the investment platform. Not only do we make the application available as a white-label solution, it can easily integrate into other platforms via APIs. We wanted to create a modular platform that we could update in pieces when needed and easily scale up as clients came online.

    High-Performance Development Teams

    A major reason for Goji Investments‘ success in these first few years is our high-performance development organization, which is instrumental in building and delivering the vision of the investment products needed to generate new business. As we’ve moved from simply building our applications into making them more scalable, we’ve focused on getting the right tools in place for Ops and Dev. Of course, bonus—it makes developers happier if they have cool tools to use.

    One of the things we try to do is keep our application/platform deployment process as agile as the applications themselves—constantly looking to improve and making updates whenever necessary, whether needed to deploy new technologies and applications or based on feedback from the team. The idea is to keep our DevOps pipeline operating smoothly and efficiently.

    One of our key operational strategies is that if we make our developers happy at work, they will deliver better quality applications, which results in happier end users. Of course, developers like to create to come up with innovative ways to deliver great features. One roadblock to coding innovation is performing repetitive low-level tasks, so we’ve actually gone out of our way to automate whatever we can and free up Dev resources for more value-specific application development.

    Automating Deployments is a Start, but Just a Start

    We automate the deployment process through GitHub. Each developer pushes their own services into GitHub themselves, where it goes through a quick review process. After review (if it passes), it’s merged into the master. Any master merge triggers build pipeline execution (which is using ThoughtWorks GoCD), and this automation includes several rounds of testing: unit test and integration test followed by an automated acceptance test. Developers have the option of executing additional tests themselves when desired.

    Any new master is promoted into pre-prod, which mirrors production. When changes are finally rolled into production, we use HashiCorp Nomad’s blue-green deployment capabilities—if a problem were to occur (which means it was missed in official testing), Nomad takes care of any rollback needs.

    The stack is fairly straightforward: The applications are written in Java and run on a DropWizard framework in containers. Nomad is our orchestration platform. One of our foundational principles when selecting application and infrastructure technologies is the ability to automate our deployment processes. We’ve done a fairly good job of automating anything we possibly could, but automating monitoring was more difficult. Our traditional APM tool was fine for alerting us to issues such as an EC2 crash or a resource availability issue for a reboot, but if we wanted to actually troubleshoot the issue we essentially just had to examine logs and hope we could see something out of the ordinary.

    As much as everyone is excited about writing data into logs, combing through those logs to troubleshoot application issues is a waste of time and valuable developer resources. After all, operating 20 different microservices that cover everything from taxes and payments to customer notification required optimization of each element of the DevOps pipelines. The last piece we added was performance monitoring.

    The Value of End-to-End Distributed Tracing

    There’s a great line from Jurassic Park: “T-Rex doesn’t want to be fed. T-Rex wants to hunt.” Well, developers don’t want to be analyzing log files; they want to code. In fact, they want to be creating the next great feature. To get our dev team out of the weeds, we began thinking about a different way to get—and analyze—application performance data.

    We wanted a system that added observability, monitored performance, managed service levels and included visibility from our end user requests all the way into our back-end systems. Oh yeah, we also wanted all of that to happen automatically so that our developers never had to worry about anything other than their own features. Installation, agent setup, discovery, mapping, alert configuration and reporting—as much as possible without requiring human setup.

    We knew tracing was critical—so much so that we avoided missing any problems by specifying a 100% solution, wanting a complete trace of every request to the application.

    Troubleshooting Application Performance Problems

    The real reason you buy application monitoring software is to solve problems, so optimizing our ability to find bottlenecks and eliminate them is a key component of our monitoring solution. First, like the other aspects of monitoring, we didn’t want to have to spend time configuring thresholds for warning and danger alerts. Our need was for automatic anomaly detection with event analysis. Every little bit helps keep our dev team focused on dev, not analyzing data—especially in logs.

    Of course, sometimes, you can’t help it; you have to look at log data, but we wanted to be smarter about that, too. We wanted our application monitoring tool to automatically integrate log analysis tools so that all data could be analyzed at the appropriate level whenever needed.

    Don’t Forget Testing

    Sometimes, testing gets lost in the value of a good monitoring solution. While we weren’t necessarily looking for a testing tool, we knew if a monitoring solution could also operate effectively in test (that’s not just the ability to run in test; rather, I mean the ability to add value in the testing process), well, so much the better.

    It turns out that our applications are quite complex, and that complexity can create lengthier test cycles—commonly in this scenario:

    We recently released a new feature for distributing dividends. As you can imagine, this is a fairly important feature, so we wanted to ensure that it operated as desired and expected. We were especially concerned with being able to scale the feature appropriately. We set up a stress scalability test that took 20+ hours to run (essentially processing hundreds of thousands of payments).

    What we didn’t count on was having to stop some way into the test for someone to either submit an optimization update or actually fix a bottleneck—getting 10-12 hours into the test, then having to halt it and restart it—over and over and over again. We started thinking we might never finish.

    This is one of the pain points we hoped to solve with an automated way of monitoring. By pointing the automatic APM solution at our test environment, not only did we not have to configure anything (or even set up a special start command) but we also got almost immediate feedback on any change (both positive and negative). It also pinpointed the exact location in the code where the problem occurred, so the developer could almost immediately update their code and initiate a restart of the test. Finally, we could pick any two runs and compare their execution and performance to identify the real problem.

    Two things happened:

    • We were able to iterate different runs ~5 times faster.
    • We got such great bottleneck and debugging data from our solution that we cut the runtime of the test from 20 hours to less than one hour.

    Give Developers the Tools to Shine

    While all employees like to succeed, developers especially love when they can rise above their challenges and deliver high-performance code. We like to give our dev team the best possible tools to help them achieve this excellence. Approaching the decision process for selecting a tool for them should be handled no differently than thinking about your end users:

    • Identify pain points.
    • Find a resolution.
    • Execute the solution.

    For our development team, that meant relieving them of low-thought repetitive tasks that we could automate and stop making them spend their time culling through performance logs.

    Making the Right Choice??

    The long and short of it is that we replaced our legacy APM tool with a solution that delivers the automation we crave and eliminates the need for log deep-dive analysis to solve any problem. It also supports log analysis with various integrations, which was important to us.

    We get a trace of every single call, which is important to the Ops and customer support teams—and they profile every production process automatically, which gives our developers more than enough information to take action.

    Ultimately, we’ve accelerated our application delivery and update processes, streamlined testing and monitoring. And our developers are super happy that we give them the tools they need and then challenge them to make the best possible applications using those tools.

  • Observe Unveils Observability Platform Built on Snowflake DBaaS

    Observe Unveils Observability Platform Built on Snowflake DBaaS

    After raising $35 million in seed funding, Observe Inc. has emerged from stealth with early access to a namesake observability service that leverages the database-as-a-service (DBaaS) platform created by Snowflake Inc.

    Company CEO Jeremy Burton said rather than build another data lake platform, it makes more sense to make an observability platform available using a software-as-a-service (SaaS) application model based on an existing cloud service.

    Burton said Snowflake, which is based on a relational database running on the Amazon Web Services (AWS) cloud, has already proven it can scale to ingest logs, traces and metrics. The Observe platform leverages that platform to correlate that data to monitor application and infrastructure environments in a way that provides more context than legacy tools that monitor software components and infrastructure in isolation.

    The context is achieved by creating a “resource” to represent, for example, a user, a session, a shopping cart, a pod, a container, a help-desk ticket or a build. Observe then enables IT teams to also track relationships between resources in a way that the average IT administrator can query without having to tag each resource, said Burton. IT teams can also track how the attributes of a resource change over time, which Burton noted can be employed to reconstitute the state of an entire IT system at any point in time.

    That approach can be applied just as easily to existing monolithic applications and emerging microservices applications because all the data required is ingested into the Snowflake service without requiring IT teams to first instrument and then update each application, added Burton.

    The pricing model for Observe will be based on the amount of data stored in the AWS S3 bucket and the number of queries launched. IT teams will purchase Observe credits that are billed only when the platform is actually used, noted Burton.

    While observability is a core tenant of best DevOps practices, Burton said there is a need to democratize observability in a way that allows any member of an IT team to troubleshoot any issue. There shouldn’t be a requirement to assemble every member of an IT team to diagnose an issue, said Burton, noting over time, that just aggravates developers who don’t really need to deal with, for example, an infrastructure issue.

    IT teams will be provided access to dashboards that enable novice or intermediate users to quickly ascertain the root cause of an issue, while more seasoned engineers with be provided access to worksheets based on a spreadsheet-like interface through which they can manipulate data, said Burton.

    Competition among providers of observability platforms is already fierce. However, as organizations look to rationalize existing legacy monitoring tools in favor of platforms that add more context, the overall size of the observability market will be measured in billions of dollars. Each IT teams will need to decide what type of platform makes the most sense for them based on costs and their preference for one capability a vendor might have that another doesn’t provide.

  • Instana Applies DevOps to APM Agent Management

    Instana Applies DevOps to APM Agent Management

    Instana has announced it has become the first provider of an application management platform (APM) to enable IT teams to automate the deployment of agent software to monitor IT environments using any Git repository of their choice.

    Jim Hirschauer, director of product management and sales enablement for Instana, said agent software used to instrument an IT environment, including software and infrastructure, can now use a Git repository to automate the configuration of agent software during startup and reboot in addition to being able to pin a specific version of Instana agent software to a branch within a Git repository.

    One of the challenges any DevOps team faces when instrumenting an IT environment is the agent software employed to collect data and metrics needs to be managed like any other piece of software. By adding support for Git repositories, Instana is making it possible to apply DevOps processes to the management of that agent software, he said.

    The ability to configure agents as code also means DevOps teams can turn on and off agents as part of an effort to reduce agent management fatigue, he added.

    By embracing GitOps practices Instana is looking to distinguish itself from rival APM platform providers by “walking the talk” when it comes to best DevOps practices, Hirschauer said.

    The ability to configure agents as code follows a recent update to the Instana APM platform that, among other things, added support for Redis Enterprise Monitoring Sensor, IBM MQ Monitoring Sensor and NGINX tracing, which automatically integrate with Instana End User Monitoring (EUM) to natively extract tracing requests.

    Although competition across the APM space is crowded, Instana as a startup is trying to take advantage of two macro trends to supplant rivals. The first is the shift toward converging the management of software and IT infrastructure. The Instana APM platform discovers all application service components and application infrastructure and then automatically deploys monitoring sensors that trace all application requests and profiles every process. It then detects application and infrastructure changes in real-time, adjusting its own models and visualizing the changes and any performance impact without requiring any human configuration or even application restarts.

    The second trend is the rise of microservices. Historically, IT teams have used APM platforms to only monitor their most mission-critical applications because of the cost of deploying agent software. However, given the inherent complexities of microservices-based applications, IT teams are employing APM platforms more broadly to monitor dependencies.

    It’s too early to say how this latest round in the APM platform wars will play out. However, there are more organizations than ever evaluating APM platforms, many of which would never have employed one before. The good news is that as open source agents become more widely available, the cost of employing APM platforms should come down. However, open source agents are still not quite as simple to configure and deploy as most proprietary agent software. DevOps teams will need to decide for themselves how much that convenience is worth.

  • CNCF Provides Jaeger Distributed Tracing Update

    CNCF Provides Jaeger Distributed Tracing Update

    The Cloud Native Computing Foundation (CNCF) has made available a report detailing the progress being made around the open source Jaeger distributed tracing software. Among other things, the report notes there are now more than 300 organizations contributing to the project.

    Jaeger is designed to provide a framework for monitoring microservices-based applications in a way that captures every interaction as part of an effort to simplify troubleshooting.

    Originally developed by Uber, Jaeger has almost 2,000 contributors. Developers from Uber and Red Hat make the bulk of those contributions., while other developers work at Ryanair, IBM, Ticketmaster and CloudBees.

    Thus far, there have been nearly 40,000 contributions, 4,300 code commits and 3,200 pull requests for Jaeger.

    Yuri Shkuro, a software engineer at Uber who created and maintains the Jaeger project, said as open source agent software in the form of OpenTelemetry, a separate sandbox-level initiative also hosted by the CNCF, gains traction, the more feasible it will become for DevOps teams to embrace distributed tracing. Currently, most DevOps teams are dependent on sampling techniques typically employed via an application performance management (APM) platform. While that approach can indicate there might be an issue, distributed tracing makes it easier to pinpoint the precise problem.

    That’s critical because many DevOps teams can spend hours, if not days, trying to identify the source of an issue that often only takes a few minutes to fix. The trade-off is that distributed tracing collects a lot more data than sampling, so IT teams will need to decide how long they may want to store that data. Most organizations will only store tracing data that identifies anomalies based on a reasonable retention schedule rather than allocating storage resources to what could become massive amounts of tracing data, noted Shkuro.

    Providers of commercial observability platforms have been embracing OpenTelemetry to provide distributed tracing services, so it’s not clear to what degree IT organizations will opt to deploy Jaeger on their own or access a managed Jaeger-based service.

    Regardless of how they are invoked, next-generation observability platforms based on Jaeger should become more affordable at a time when microservices-based applications are being more widely deployed. Given the inherent complexity of those applications, observability platforms that are a core tenet of any best DevOps practice become a requirement. In comparison, the use of ALM platforms was typically limited to only the most mission-critical applications because of the costs associated with deploying proprietary tools.

    It may be a while before every application is instrumented by default. In the meantime, Shkuro said the Jaeger project is looking to recruit additional maintainers. As is often the case with any open source project, there are plenty of contributors. IT professionals willing to volunteer to maintain a project are often more scarce.

  • SolarWinds Extends APM Reach to Infrastructure

    SolarWinds Extends APM Reach to Infrastructure

    SolarWinds has updated its application performance management (APM) platform to provide more visibility into the IT infrastructure on which applications depend.

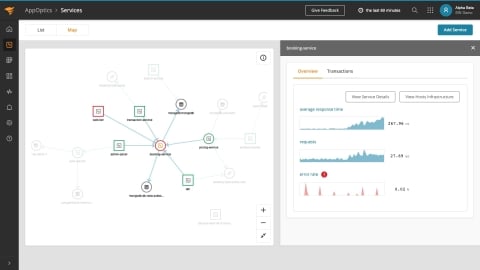
    Jim Hansen, vice president of products for application management at SolarWinds, said the AppOptics service map within SolarWinds APM Suite now enables DevOps teams to visualize dynamic relationships between services and their dependencies. IT teams can view metrics such as average latency, requests per minute, error rate and CPU usage as time series data within a service trace topology.

    DevOps teams can view which services and dependencies are causing resource constraints, surface unknown dependencies and misconfigurations in services and determine how business transactions are flowing across application services, said Hansen. The goal is to make it easier to conduct root cause analysis at a time when the dependencies between software and infrastructure have never been greater or complex.

    Hansen noted that in the wake of the economic downturn brought on by the COVID-19 pandemic there is a lot more interest in reducing the total cost of IT. In many cases, IT teams today are relying on separate tools to monitor applications and IT infrastructure, which often not only results in higher costs but also fails to provide enough context, he said.

    At the same time, responsibilities within IT teams are converging. According to a recent survey of 227 IT professionals in North America conducted by SolarWinds, 54% of respondents said they are spending more time managing applications and services than infrastructure and hardware. The survey also notes there are more IT teams than ever using log analytics (58%) and tracing (24%).

    SolarWinds has also added a web transaction recorder to its Pingdom monitoring tool to capture how an end user interacts with a web application without requiring developers to write and deploy scripts. The recorder captures each step made during a transaction and automatically translates the information into a script that can automatically play back, said Hansen.

    Finally. SolarWinds has enhanced its Loggly tool, adding the ability to automate indexing and parsing to deliver time to value faster, he said.

    Hansen said SolarWinds via its software-as-a-service (SaaS) platform, is trying to make APM simultaneously more affordable and accessible. The challenge is making it possible for IT teams to apply APM services more broadly even when consumption of those services scales up and down in ways that are not always predictable, noted Hansen.

    There are no shortages of options when it comes to APM platforms these days, and most are accessed via SaaS platforms. SolarWinds has been making the case for an APM service that costs substantially less than rivals while providing most of the functionality required by the average IT team. Many teams have limited their adoption of APM platforms to only their most mission-critical because of the cost involved. As APM services become more affordable, there should be a corresponding increase in reliance on APM services at a time when IT is becoming more complex to manage daily.