Tag: application performance management

  • Nobl9 Simplifies SLO Identification

    Nobl9 Simplifies SLO Identification

    Nobl9 today added a Replay capability to its service level objectives (SLO) management platform that makes it simpler to collect the historical data a DevOps team needs to get started.

    Nobl9 COO Kit Merker said Nobl9 Replay makes service level indicator (SLI) data instantly available in minutes using 30 days of historical data collected from observability and application performance monitoring (APM) platforms. Previously, DevOps teams would have had to wait as long as a month before the Nobl9 platform could collect enough spreadsheet data to create a graph that identified the relationship between various services.

    Nobl9 now enables historical data to be merged with data collected in real-time to allow DevOps teams to view SLO charts and generate reports shortly after creating an SLO within a Git-based workflow.

    Nobl9 is trying to spur greater adoption of SLOs by making available an open source SLO specification that defines a common interface for constructing them that has garnered support from Dynatrace, Sumo Logic and others. SLOs, of course, are not a new idea; they have been used as a metric to track the performance of IT services for decades. However, as more microservices-based applications are built and deployed, it’s becoming more challenging to maintain SLOs across applications that have many more dependencies than legacy monolithic applications.

    The Nobl9 platform is designed to enable DevOps teams to employ an SLO-as-code approach that makes it simpler to gather the metrics that confirm whether SLOs are being achieved.

    It’s not clear whether reliance on SLOs has waned over the years or if application environments simply became too complex to track meaningful metrics. A recent survey conducted by Dimensional Research on behalf of Nobl9, however, found a full 94% of respondents that have or plan to implement SLOs intend to map them directly to business operations, with 91% reporting they expect that effort to improve decision-making. More than 80% also said their organizations are planning to increase the use of SLOs, with 87% indicating SLOs should improve overall microservices performance.

    The issue is that most organizations have limited visibility into their IT environments. The survey found less than half of respondents (46%) had visibility into all their IT environments. Only 45% and 35% claim to have visibility into containers and microservices, respectively. More than three-quarters (78%) said hybrid clouds make observability more difficult, even though 45% said they already employed 11 or more observability and monitoring tools. Trying to track SLOs using tools such as Grafana dashboards that DevOps teams need to set up and maintain is simply too difficult, noted Merker.

    As applications are increasingly constructed using services that drive digital business transformation initiatives, it’s now only a matter of time before SLOs are more widely tracked. That will enable DevOps teams to not only ascertain their current level of performance but also more easily work toward achieving their actual performance goals, he added.

    The challenge is that defining an SLO in a highly dynamic application environment where services are added and replaced with much greater frequency is often a lot easier than maintaining it.

  • Why More Incidents Are Better

    Why More Incidents Are Better

    Ask most SREs how many incidents they’d have to respond to in a perfect world, and their answer would probably be ‘zero.’ After all, making software and infrastructure so reliable that incidents never occur is the dream that SREs are theoretically chasing.

    Reducing the number of actual incidents as much as possible is a noble goal. However, it’s important to recognize that incidents aren’t an SRE’s number-one enemy. What matters more than the number of incidents you experience is how effectively you respond to each one.

    Plus, there’s value in incidents. They are a learning opportunity. If your business never experienced them, it would arguably be facing more risk, not less.

    We know: These ideas may sound a little counterintuitive. You might even accuse us of being “pro-incident”—which we sort of are. Allow us to explain.

    The Silver Lining

    In many respects, incidents are inherently bad. When one occurs, it means something broke. That’s bad. It may also mean that users were disrupted, operations halted or money was lost. Those things are even worse.

    On the other hand, incidents aren’t all bad. They actually benefit SRE teams for several reasons:

    • Learning opportunities: Incidents are opportunities to figure out what went wrong and prevent it from recurring. They can also help teams learn how to react more quickly or efficiently the next time something fails.
    • Get ahead of bigger issues: Sometimes, working through one incident means you can avoid another that’s even worse. Perhaps one server fails, for example, and your response revealed that the failure was due to a larger issue that would have eventually caused a worse outage if left unaddressed. But thanks to the incident, you detected the larger issue before it triggered a more massive failure.
    • Reinforce team culture: Nothing breeds camaraderie or a spirit of collaboration like working alongside other engineers to respond to a crisis in the middle of the night. Although being in this setting may not be anyone’s first choice, it does often have a positive impact on your team’s culture and esprit de corps.
    • Demonstrating value: Assuming you handle them well, incidents are an opportunity for SREs to prove how valuable they are to the organization. If incidents never happened, it’s a safe bet that some bosses would start to wonder why they need SREs in the first place. (It would be a flawed train of thought, of course, because SREs would deserve credit for preventing incidents, but it’s a thought that may float around some C-level brains nonetheless.)

    We could go on, but the point is clear: Although incidents cause problems in some respects, they actually create value in others.

    Focus on Response, Not Avoidance

    This is not to say that you should welcome incidents with open arms. Obviously, any decent SRE should focus first and foremost on being proactive and preventing incidents from happening whenever possible. They should use chaos engineering to identify problems that could be lurking unseen in production environments. They should leverage IaC to minimize risks. And so on.

    That said, what ultimately matters more than incident frequency is the effectiveness of incident response. It’s better to experience ten incidents that you resolve in under an hour each than one incident that takes mission-critical systems offline for a week.

    So, in addition to investing in tools and processes that mitigate the risk of incidents, SRE teams should place equal emphasis on ensuring that they can react quickly and effectively when an incident happens. This means having the ability to share information efficiently, define clear roles, know what to prioritize when working through complex incidents and have clear plans in place that spell out how you’ll handle a problem as soon as you detect it. Without these abilities, you’re at risk of letting incidents that should be small turn into major outages.

    ‘Zero Incidents’ is not Realistic

    It’s important to recognize, too, that while it can be fun to imagine a world where zero incidents occur, the reality is that such a world will never exist. If it could, we wouldn’t see new records set each year for the number of security incidents that businesses collectively suffer, for example.

    Nor would we see headlines about major outages at huge enterprises like Facebook or AWS on a recurring basis. If those companies, which have world-class reliability teams and virtually endless resources at their disposal, can’t reduce incidents to zero, neither can anyone else.

    Conclusion

    The bottom line: There is no such thing as total incident prevention, no matter how hard you try. And even if there were, that wouldn’t actually be a good thing, for the reasons explained above.

    So, by all means, undertake reasonable proactive efforts to prevent as many incidents as you can from happening. But don’t let investment in prevention cause under-investment in response. Being prepared to handle incidents when they happen—which they inevitably will—is what matters most.

  • Dynatrace Advances Application Environments as Code

    Dynatrace Advances Application Environments as Code

    Dynatrace, at its online Perform 2022 event, launched a bevy of updates to its portfolio that make it easier for DevOps teams to programmatically embed observability and other software intelligence capabilities within applications.

    At the same time, Dynatrace also revealed that it has extended the reach of its observability platform to now include all the major serverless computing platforms.

    Additionally, the company extended its existing Application Security Module to provide the ability to detect vulnerabilities and block attacks against application runtimes in real-time using the framework defined by the Open Web Application Security Project (OWASP). That module is based on Dynatrace Smartscape topology software and a Davis artificial intelligence (AI) engine to provide real-time visibility into IT environments that enables DevSecOps teams to better prioritize which vulnerabilities to remediate first based on their severity.

    Dynatrace CEO Rick McConnell told conference attendees that all these capabilities are enabled by agent software that can be programmatically embedded within applications as code using application programming interfaces (APIs) and templates to automatically surface software intelligence. Rather than having to deploy multiple agents, McConnell said, IT teams can deploy a single agent to drive a wide range of analytics.

    That capability makes it easier for IT organizations to achieve service level objectives (SLOs) for performance, quality, and security at a time when more responsibility for the management of applications is shifting left toward developers, he added.

    It’s not quite clear how far responsibility for the management of applications after they are deployed is shifting left toward developers. It tends to vary widely by organization. The one thing that is certain is more applications are being instrumented. Adoption of application performance management (APM) platforms was previously limited by cost concerns and the challenges associated with embedding agent software in applications. As it becomes easier to instrument applications the data that can be collected and analyzed from logs, metrics and traces are now considerably greater. As such, APM platforms are now being positioned as observability platforms that can correlate analytics collected from applications and the underlying infrastructure upon which they depend.

    Much of that need for greater instrumentation is being driven by digital business transformation initiatives, noted McConnell. Many of those applications are being constructed using microservices that have dependencies on each other. A single agent makes it easier for IT teams to instrument cloud-native application environments, he noted.

    There is no shortage of options when it comes to instrumenting and observing applications. The issue now is turning all the data being collected into actionable intelligence. As a result, observability platforms are being imbued with AI engines that make it possible to analyze massive amounts of data. Armed with those insights, it then becomes possible for an existing IT team to manage a much more complex IT environment at scale. In fact, it’s now no longer a question of whether AI engines will be injected into DevOps workflows as much as it is to what degree.

  • Splunk Expands Scope of Observability While Lowering Costs

    Splunk Expands Scope of Observability While Lowering Costs

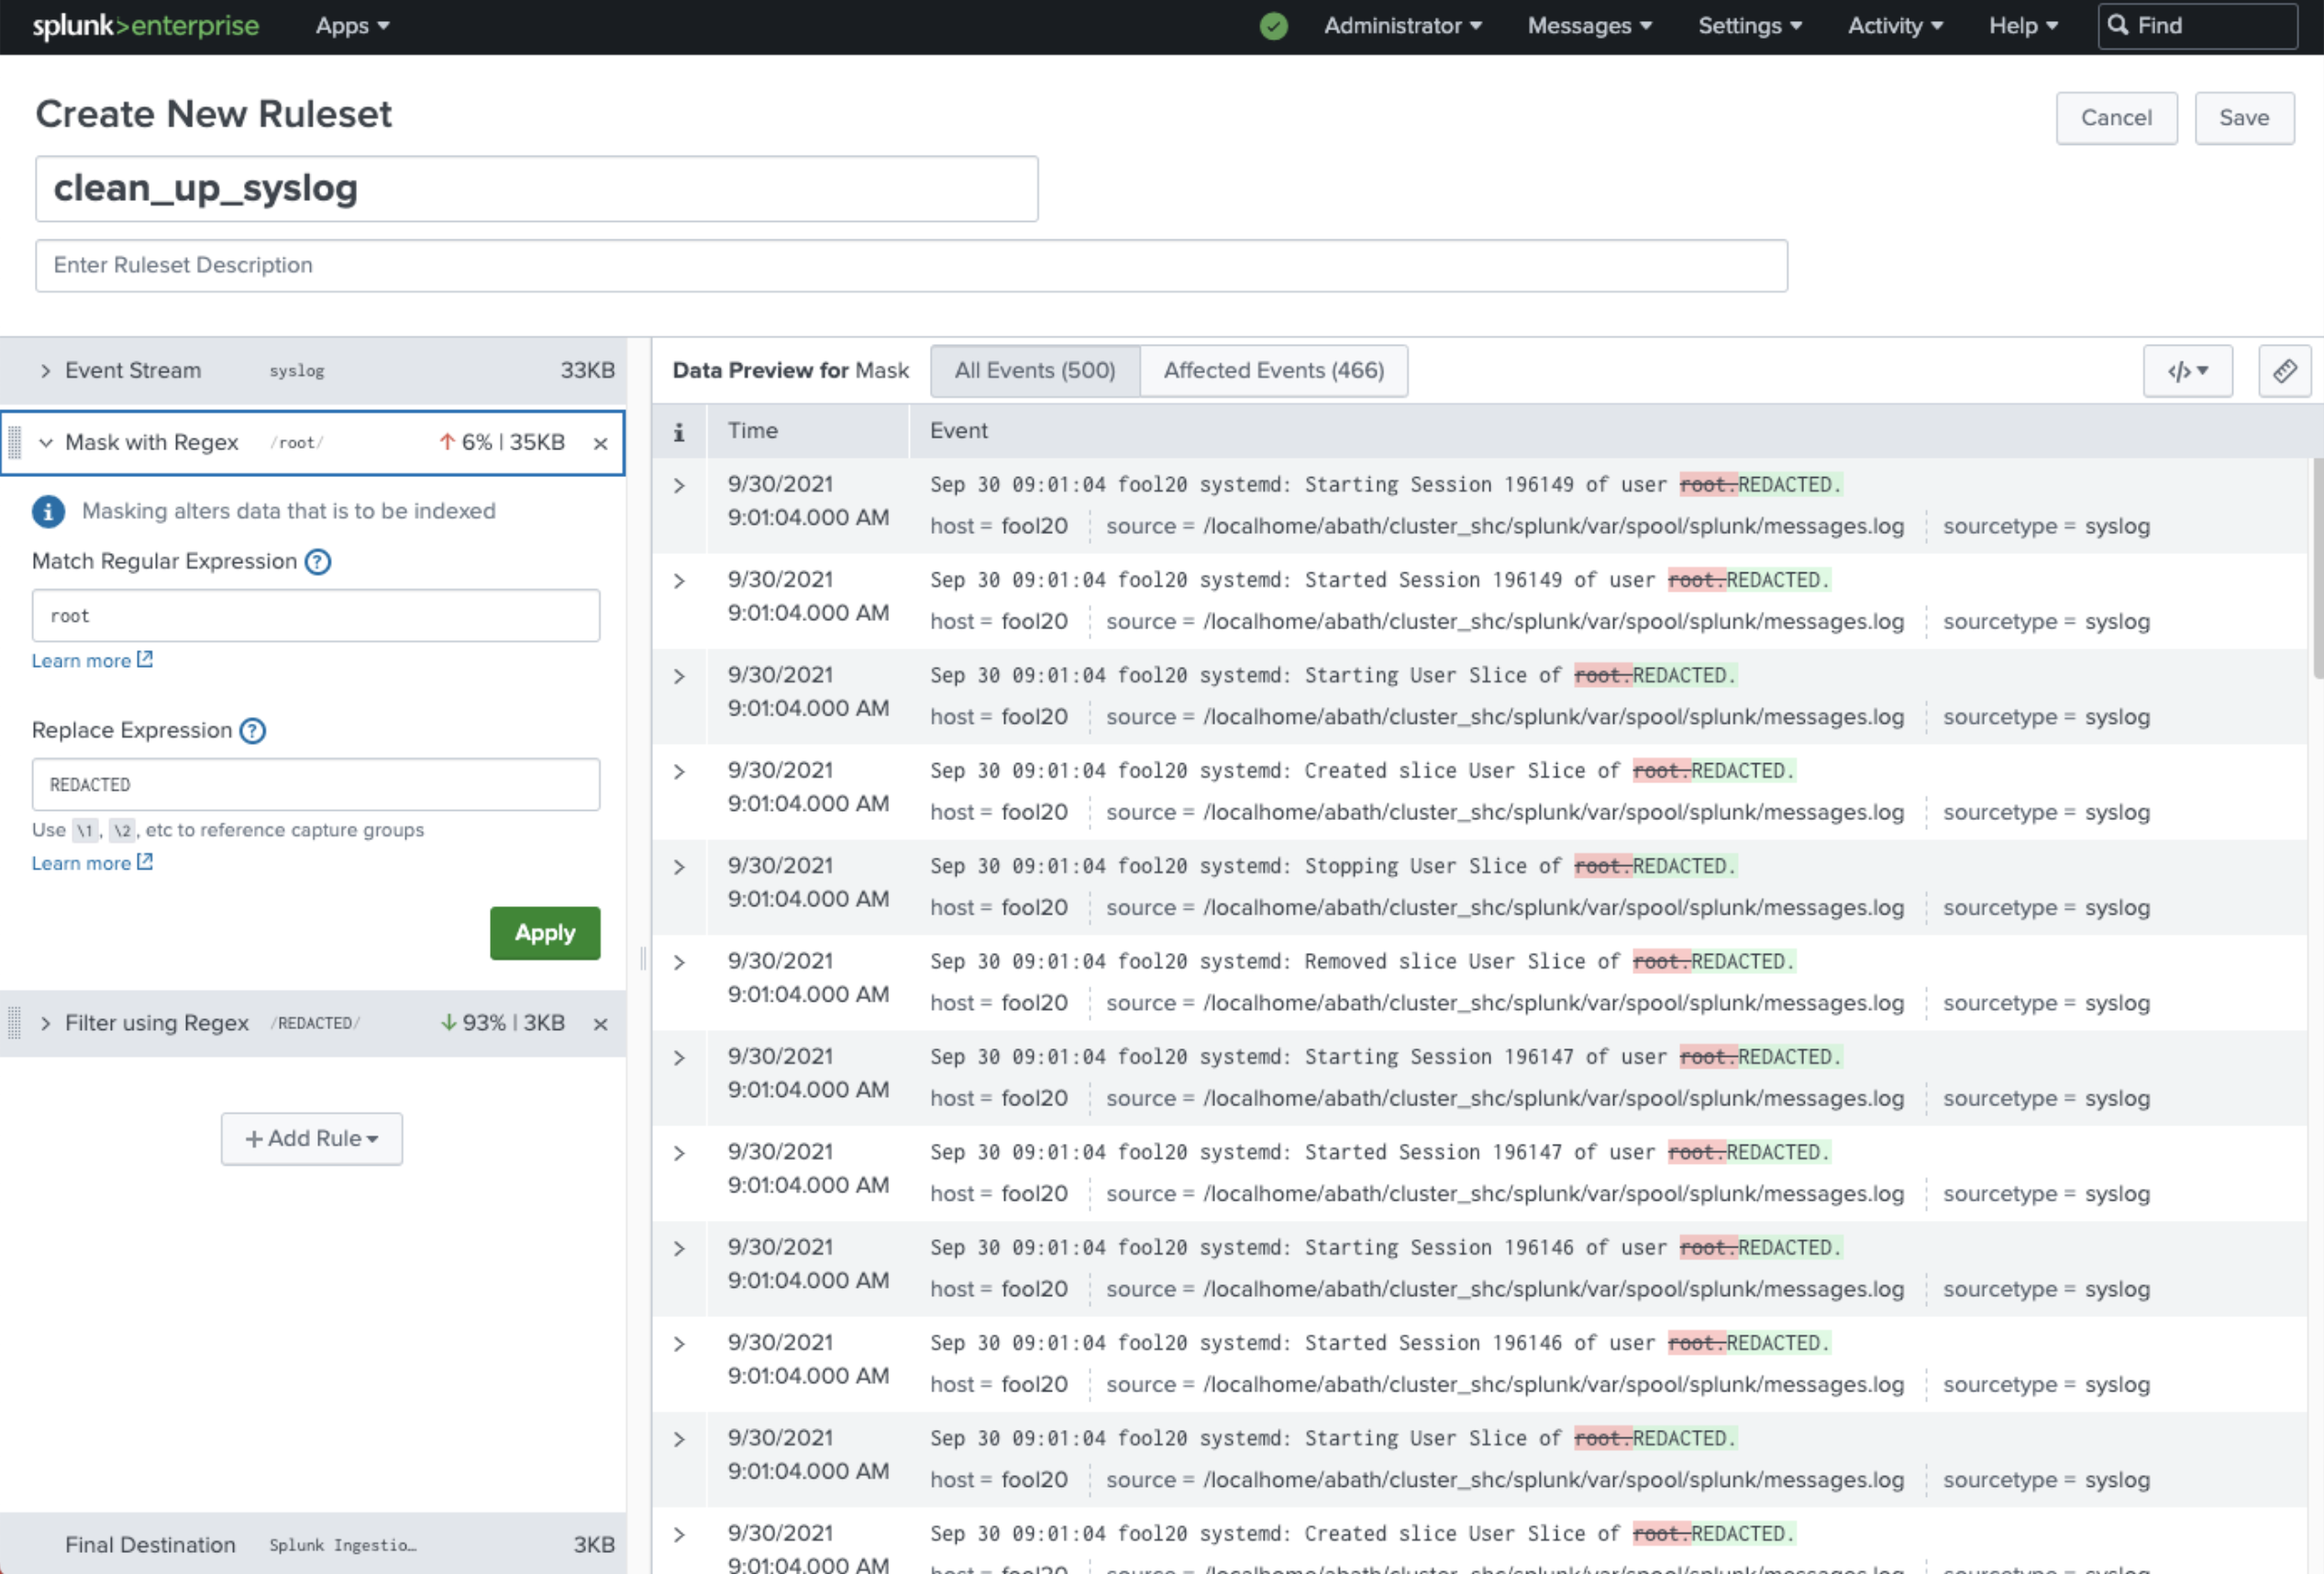
    During its online .conf21 conference Splunk Inc. today revealed a bevy of updates that advance observability while at the same time reducing the total cost of deploying its platforms.

    As part of that effort, Splunk also announced it will now make workload-based pricing available to all customers.
    Previously, a select number of small customers had access to workload-based pricing while other customers licensed Splunk platforms based on how much data was loaded into the platform. That approach, however, tends to discourage IT teams from loading as much of their data as possible.

    CEO Doug Merritt said workload pricing was created to enable a value-oriented pricing model that customers could employ instead of a data-centric model that can discourage IT teams from analyzing as much data as possible to improve IT operations.

    To further lower total costs, the company is also previewing a Flex Index option for customers that choose workload-based pricing to enable longer retention for lower-value data at a lower cost. Splunk is also expanding its cloud storage to include a preview of SmartStore, which allows larger volumes of data to be stored more cost-effectively on Microsoft Azure Cloud initially with support for Amazon Web Services (AWS) and Google Cloud Platform (GCP) forthcoming.

    Other enhancements to the portfolio include a preview of a data manager, a revamped onboarding tool for data stored in Amazon Web Services (AWS) and Microsoft Office 365, and Ingest Actions, which enables IT teams to act on data in motion in addition to data at rest stored in Splunk or the S3 cloud service from AWS.

    The company is also now making it easier to find and explore data via a federated search tool and a Splunk Dashboard Studio offering, available via Splunk Mobile, that makes it easier to create dashboards.

    At the same time, the company is also making available Splunk Operator for Kubernetes to make it easier to install its platforms in cloud-native environments. There is also now Splunkbase, a curated catalog that makes it simpler to find or develop a Splunk application.

    In terms of observability, the company is providing a preview of AlwaysOn Profiling for its application performance management (APM) platform, dubbed Splunk APM. AlwaysOn Profiling extends existing tracing capabilities to provide continuous code-level visibility and analysis.

    In addition, there is now a preview of an enhanced version of Database Visibility for Splunk APM, which automatically uncovers slow queries that are causing transaction latency without having to instrument a database.

    The company also announced that its real user monitoring (RUM) for mobile applications, which makes use of open source, now is generally available alongside the Splunk Observability Cloud for Mobile platform. The company also revealed there are previews of integration between Splunk Log Observer and Splunk Enterprise and Splunk Infrastructure Monitoring AutoDetect, a tool that automatically discovers infrastructure anomalies. There are also now additional Content Packs for managing Microsoft365, third-party APM tools and synthetic monitoring.

    Finally, Splunk has expanded its security portfolio to include Splunk SOAR App Editor, which provides a way to edit, test and create security orchestration, automation and remediation (SOAR) applications. There are now more than 350 SOAR apps now available on Splunkbase. The company also launched Splunk Intelligence Management based on a platform it gained with the acquisition of TruSTAR earlier this year and that it is making available security services via a team of experts dubbed SURGe.

    It’s not clear to what degree these additions will enable Splunk to fend off what has become a larger number of rival providers of observability platforms. However, as one of the most widely used IT operations management platforms in the enterprise, it’s clear Splunk enjoys an incumbent leader status it is determined to maintain.

  • 5 Steps to Succeed With Blue-Green Deployment

    5 Steps to Succeed With Blue-Green Deployment

    By allowing teams to maintain two production-ready environments at the same time, the blue-green deployment technique can significantly boost reliability. But blue-green deployment can also be difficult to execute and manage. Let’s unpack how blue-green deployment works, why it’s important and which best practices to follow for blue-green deployment success.

    Blue-Green Deployment, Defined

    Blue-green deployment is a software deployment technique in which teams maintain two identical but distinct environments that are capable of hosting a production application. One environment is “live” and actively serving users, while the other is kept in reserve.

    When it comes time to deploy a new version of your application, you deploy it to the reserve environment. You then test and validate it to make sure it meets performance and reliability requirements.

    If it does, you reconfigure your DNS or load balancers so that user traffic is directed to this environment, which becomes the new production environment. Meanwhile, the previous production environment is placed in reserve.

    Benefits of Blue-Green Deployment

    The blue-green deployment technique can boost reliability in several ways:

    • Environment parity: Because the reserve environment in which you test your application becomes the live production environment, blue-green deployment ensures parity between testing and production. In turn, it reduces the risk that configuration differences could cause unforeseen problems in production.
    • Failed deployments: If a deployment fails, it doesn’t impact your users because you deploy into the reserve environment. You can fix the issue while a stable user-facing version of your app continues to run in the other environment. 
    • Redundant environments: Although blue-green deployment is not a data protection or disaster recovery technique, having two production-ready environments available is useful in the event that one of your environments is wiped out by an event like a data center failure. In that case, you can restore operations quickly by using the other environment (provided it’s hosted in a separate data center, of course).

    How to Use Blue-Green Deployment: Steps and Best Practices

    While blue-green deployment is a great way to increase reliability, it does present some challenges. The following best practices can help you to handle them.

    Use Scalable Infrastructure

    One obvious potential downside of blue-green deployment is that it can essentially double the amount of resources you need to host your application since you have to maintain two identical environments. That can double your hosting bill.

    One way to reduce the cost impact of blue-green deployment is to create environments that can scale rapidly without changing their core configuration. You could do this using cloud-based virtual machines (VMs) and autoscaling or via containers and an orchestration engine (like Kubernetes) that can scale them.

    Using this approach, you can set up two environments that are effectively identical except that the production environment includes more VM or container instances than the reserve. Although you could argue that this is not quite a blue-green deployment because the environments are not perfectly identical, that semantic downside is outweighed by the benefit of not wasting a bunch of money on infrastructure you don’t need.

    Chaos Engineering

    Typically, chaos engineering entails experimenting with a production system to test its reliability. Chaos engineering offers many benefits, but it presents the obvious risk of creating a problem in production that impacts your end users.

    Blue-green deployment allows you to work around this risk by practicing chaos engineering in the reserve environment. Of course, because you won’t have real users, performing chaos engineering under these settings may not allow you to test every aspect of your production application. But you can still test many of the configuration variables by issuing requests yourself within the reserve environment—all without worrying about breaking things for actual users.

    Managing Database State

    Keeping databases in sync when you switch between environments is one of the biggest challenges of blue-green deployment. Even small discrepancies in database state could cause big reliability issues.

    The simplest way to address this issue is to turn off the database before switching and perform tests to ensure that databases in both environments are identical before they are reenabled. Of course, this approach may impact application functionality, because the app may not work properly if the database is turned off.

    Another solution is to sync databases between your two environments. This should ensure that database state remains identical even as you switch from one production environment to the other. But it also means that problems with the database will affect both environments.

    The bottom line: There is no simple way of managing database state in blue-green deployment. You should evaluate the different options available and consider which one best meets your needs. If you can tolerate a little downtime, stop the database and restart it during the switch. If you need total continuity, use syncing, but be sure to manage the associated risks.

    Change Load Balancers, not DNS

    There are two main ways to manage where traffic is directed, and hence which is the production environment: You can change your DNS configuration when you want to switch. That’s easy to do—you would simply change the mapping for yourapp.com from one IP address to another, depending on which environment is the live one.

    You can also use load balancers to manage traffic. Load balancer configuration is more complex than simply changing DNS entries, but it also enables more sophisticated and granular control.

    In general, it’s a best practice to manage blue-green deployment switches via load balancers, due to the extra control they provide.

    Prepare for the Unexpected

    While blue-green deployment can reduce the risk of user-impacting disruptions, it’s no silver bullet. You must also be sure that you have the reliability management tools you’ll need to detect and remediate issues within both of your environments.

    Blue-green deployment is a powerful reliability engineering technique. But to get the most out of it, you must optimize the way you handle requirements like infrastructure management, traffic routing and database state. 

  • Does Shift Left Matter to SREs?

    Does Shift Left Matter to SREs?

    If you’re a software engineer, you’ve likely heard all about shift left, a practice that can streamline certain aspects of software development.

    But shift left isn’t just for developers. It can be equally valuable for site reliability engineers (SREs). Although the main mission of SREs is ensuring the reliability of software after it has been deployed rather than actually developing software, encouraging shift left practices as part of a software development strategy can nonetheless make it easier to optimize reliability.

    To prove the point, here’s an overview of what shift left means and why it matters for SREs.

    What Does Shift Left Mean?

    Shift left is the detection of application problems early in the software development process. The core idea behind shift left is that instead of waiting until just before deployment to test software for bugs, security issues or other problems, teams should begin the testing process as early as possible. In other words, they should shift some testing to the “left” of the software development life cycle instead of testing only in the middle—hence the term “shift left.”

    In so doing, they can detect problems early in the development process, at which point they are typically easier to resolve. If you don’t catch a performance, reliability or security bug until just before you plan to push your application release into production, you may have to overhaul a large part of your codebase to fix the issue. In many cases, you’ll have to change not just the specific code that triggered the bug, but also other code that depends on or integrates with the buggy code. But by finding buggy code early, developers can often fix the problem with minimal adjustments to the application as a whole.

    Shift left is a high-level concept, and it can be implemented in multiple ways. In some cases, developers may start running performance tests on new code right after they write it, even if it has not yet been integrated into the main codebase. In other cases, shift left testing could mean compiling some parts of the codebase in order to run tests against it before the application as a whole is built and tested in a dev/testing environment. Either way, the result is a testing process that begins earlier than it would under a conventional approach.

    Importantly, shift left doesn’t mean that teams skip the tests that they would normally perform just prior to deployment. Those tests, which are important for catching bugs that materialize only when testing the application as a whole rather than individual parts of it, typically still happen as part of a shift left strategy. Thus, shift left means that testing begins earlier and coincides with a broader portion of the overall development pipeline, not that testing is simply shifted to the beginning of the pipeline at the expense of mid-pipeline tests.

    Shift Left and SREs

    Again, the main job of SREs is to manage the reliability of systems. They may spend part of their days working alongside software engineers to help devise architectures and coding strategies that maximize the resiliency of applications against reliability and performance issues. But SREs also devote much of their time to managing what happens post-deployment. They use monitoring and observability tools to detect problems that arise in production environments. They then take the lead in responding to them.

    In that sense, SREs may not seem to have much to gain from shift left. Shift left is a strategy that aligns with software development first and foremost, and software development is not the core focus of SREs.

    Nonetheless, a shift-left strategy can help SREs do their jobs better, for several reasons:

    • Fewer problems in production: Most obviously, shift left reduces the rate at which reliability issues reach production environments. In turn, it minimizes the number of incidents SREs need to respond to.
    • Optimizing software pre-deployment: By exposing reliability issues early in the development process, shift left is one way for SREs to acquire the insights they need to collaborate with developers on building reliability into applications. Shift left could highlight buggy dependencies or suboptimal architectural patterns, for example, which SREs can encourage developers to address.
    • Granular reliability insights: Because shift left is a great way to trace software problems to the specific code that triggers them, it provides highly granular visibility into reliability. It can help SREs find the weakest links within an application’s codebase or architecture. These weak spots can be harder to detect when monitoring or observing an application as a whole.

    How SREs can Follow the Shift Left Methodology

    Because the implementation of shift left practices is a task that ultimately falls to developers, SREs need to work closely with development teams (and DevOps engineers, if they exist in the organization) to make shift left happen.

    The first step in that process is to get buy-in for shift left among developers. SREs can do this by highlighting the ways in which shift left can streamline the work of developers and reduce the complexity of fixing bugs. That’s important to communicate because it ensures that developers understand that shift left benefits everyone, not just SREs.

    SREs should also work with developers to identify the best approaches and practices to implementing shift left. A key factor to consider here is where reliability problems most often arise, and how shift left can help to detect them earlier. If most performance problems stem from code written by individual developers, for instance, testing code as soon as it is generated may be the best way to detect problems early on. In contrast, in situations where performance issues are triggered most often by environment configurations, the ability to test applications early under different environment variables could be the best way to surface issues early in the development process.

    Finally, SREs should partner with developers to respond to the issues that shift left reveals. After all, while developers typically don’t pay close attention to what happens post-deployment, SREs have a special ability to understand how problems in development translate to problems in production. SREs may therefore be able to help developers identify the most effective way to fix bugs based on production environment requirements, even if it’s not the quickest or simplest way.

    Why SREs Need to Shift Left, Too

    Although the shift left methodology has not traditionally been closely associated with SRE, shift left is a crucial tool in the SRE toolbox. By helping teams to detect reliability issues when they are easier to resolve, shift left puts SREs in a stronger position to maximize the overall reliability of applications. At the same time, it reduces the number of production environment issues that SREs have to manage.

  • Perforce Charts Testing Course After BlazeMeter Acquisition

    Perforce Charts Testing Course After BlazeMeter Acquisition

    Perforce Software has acquired BlazeMeter from Broadcom as part of an effort to extend the scope of its testing tools beyond the Perfecto tools for testing mobile and web applications it acquired in 2018.

    Broadcom gained control over BlazeMeter after it acquired CA Technologies in 2018. CA Technologies acquired BlazeMeter in 2016. Terms of the latest acquisition involving BlazeMeter were not disclosed.

    Tim Russell, chief product officer for Perforce, said BlazeMeter adds a complete platform that spans everything from load and performance testing to application programming interface (API) testing. The goal is to enable DevOps teams to push continuous testing further left as part of an effort to accelerate the development and deployment of applications, added Russell.

    The need for continuous testing has become more pronounced as more organizations launch multiple digital business transformation initiatives, noted Russell. The real challenge will be finding ways to embed continuous testing within DevOps processes at a sufficient level of scale, added Russell.

    In fact, the quality of the digital experience those applications provide ultimately determines the degree to which those efforts are likely to succeed, which Russell noted is why so many enterprise IT organizations are reengineering their application testing processes.

    In general, organizations are taking two paths to shift testing further left. Some are giving application performance testing tools to developers to employ during DevOps sprints while others are trying to bring application testers into the application development process earlier. In some cases, organizations are doing both as part of a comprehensive effort to discover issues before applications are deployed in a production environment. Those issue are naturally more expensive to fix after an application has been deployed.

    Perforce, for now, expects to continue to make BlazeMeter and Perfecto available as a set of complementary cloud-based services with some cross-pollination of capabilities occurring over time, said Russell.

    In the longer term, it’s apparent that more artificial intelligence (AI)-based analytics will be embedded within cloud-based platforms that can collect enough data to build meaningful models of development processes. IT teams should also expect to see testing tools make greater use of computer vision algorithms to surface issues.

    One away or another, the entire application testing process is about to become a lot more automated as more organizations are simultaneously building multiple applications. That may not necessarily reduce the need for either a developer or tester to create and manage that process, but it does mean the amount of testing time required for each application should continue to steadily decline in the months and years ahead.

    Hopefully, all that effort will lead to better application experiences being provided to end users more consistently. There is nothing quite as frustrating for any application development team than to discover that 90% of the functionality of an application is not being used because end users are not able to easily surface it. Worse yet, of course, is when an application turns out to be too slow once it is deployed. In either case, it’s difficult to regain that initial end-user enthusiasm for any new application experience after it’s been lost, simply because no one thought through all the use cases that should have been tested much earlier in the application development life cycle.

  • Sentry Integrates Code Observability Tool with GitHub, GitLab

    Sentry Integrates Code Observability Tool with GitHub, GitLab

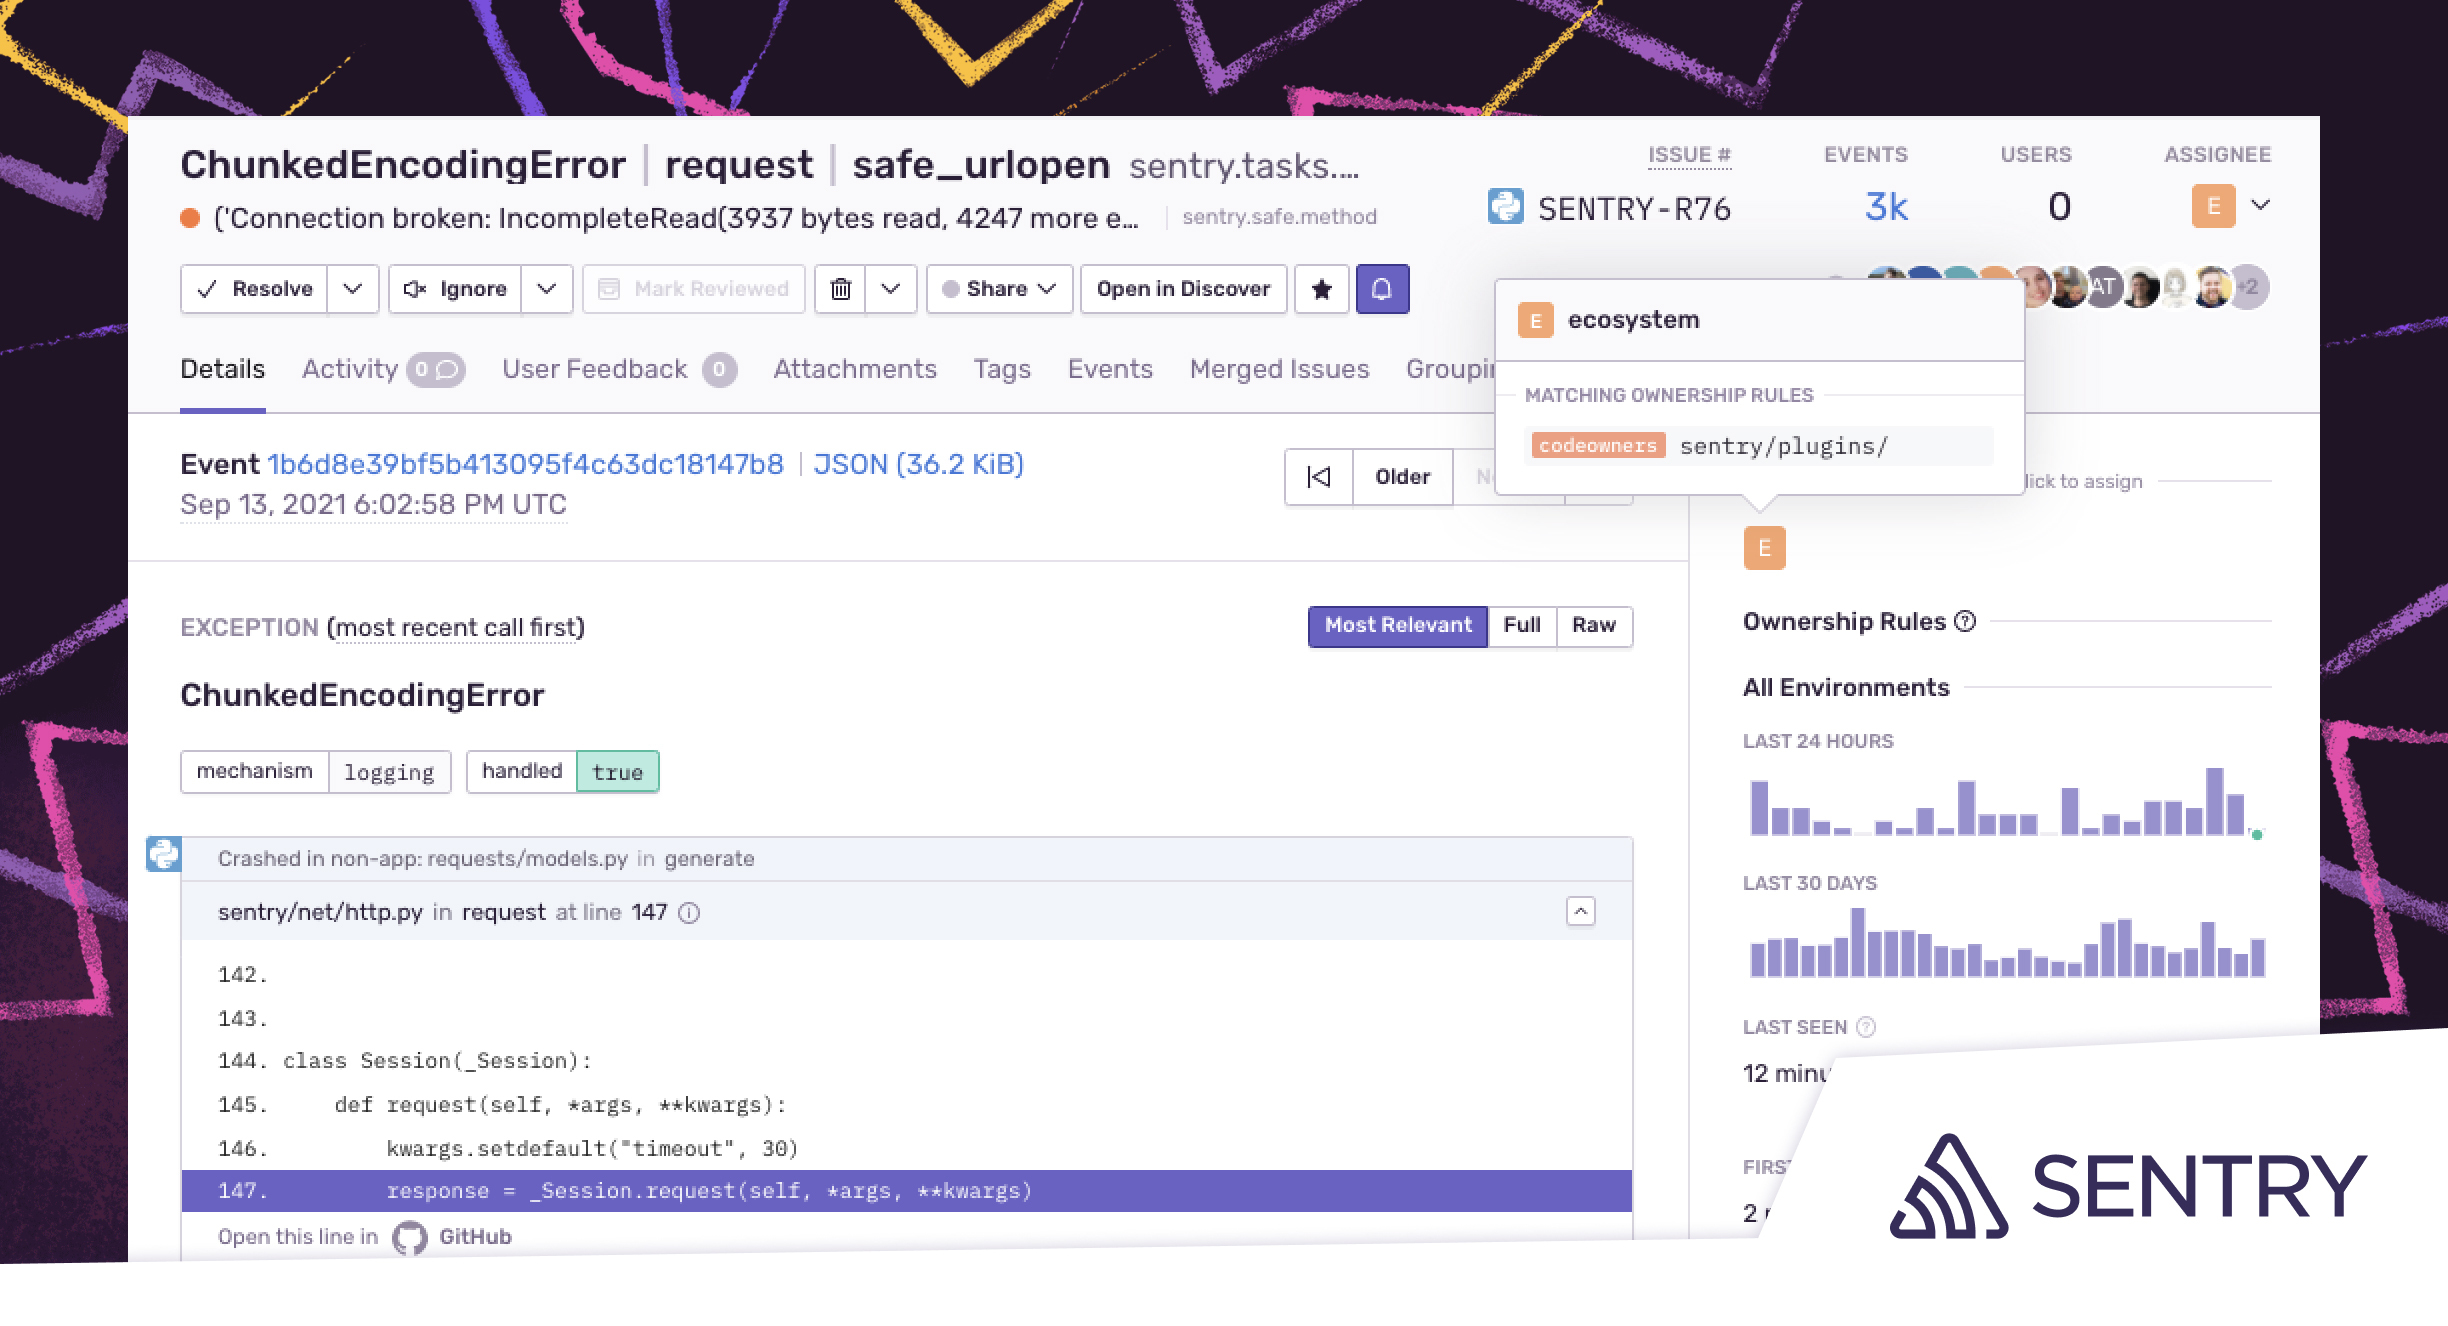
    Sentry this week extended its namesake observability platform for code to provide tighter integration with the DevOps platforms provided by GitHub and GitLab.

    Application development project managers can now assign issues to DevOps teams by integrating directly with the CODEOWNERS file in GitHub or GitLab. Error messages, for example, can now be automatically routed to individuals or teams that own the code via notifications in Slack.

    IT teams can now also identify and prioritize issues based on user impact by setting alerts based on when an issue exceeds a certain percentage of user sessions within a specific amount of time.

    Sentry CEO Milin Desai said that the percentage-based approach to alerts reduces the overall noise being generated in a way that enables DevOps teams to better prioritize their remediation efforts.

    Finally, Sentry has added an integration with the Okta identity management platform to make it possible to automatically provision and de-provision users and teams using the system for cross-domain identity management.

    As more responsibility for managing the application environment shifts left toward developers, there needs to be a way to streamline communications between developers and the rest of the IT operations team, noted Desai. Most developers today already spend less than one-third of their time writing code.

    The Sentry platform is already used by more than 75,000 organizations to enable developers to better observe and analyze code behavior. The company is now moving to bridge the divide between developers and site reliability engineers (SREs) by streamlining communications and workflows, noted Desai.

    As the responsibility for managing applications shifts left, developers don’t necessarily want to use the same tools that IT operations teams have relied on for years. Most developers want to be able to troubleshoot their applications with minimal interaction with IT operations teams.

    Historically, IT operations teams have relied on application performance management (APM) platforms to manage IT operations. Those platforms are now evolving into observability platforms that promise to provide more context by correlating events as they occur across both applications and IT infrastructure platforms. That approach, however, typically requires developers to insert agent software into their applications. Once inserted, that agent software needs to be maintained and updated, added Desai.

    The Sentry approach provides developers with a tool for collecting data from an application in a way that consumes just tens of kilobytes of memory after being embedded directly within an application. That approach eliminates the need to rely on much larger agent software to achieve observability of application code. Developers can then diagnose and possibly remediate issues in code without ever having to create a ticket asking a DevOps team to investigate an issue.

    Regardless of how developers go about instrumenting their applications, most everyone in IT agrees that the current state of observability needs to improve. The issue now is determining how best to achieve that goal in a way the benefits both the DevOps team and the developers that are now being asked to not just write code but also manage the entire application life cycle.

  • Logz.io Allies with Microsoft on Open Source Observability

    Logz.io Allies with Microsoft on Open Source Observability

    Logz.io this week announced an alliance with Microsoft that enables DevOps teams to deploy its observability platform—based on open source platforms such as ElasticSearch, Logstash, Kibana (ELK), Prometheus and Jaeger—on the Azure public cloud.

    Jonah Kowall, Logz.io’s CTO, said the multi-year effort enables those teams to deploy the Logz.io platform via the Azure Console with the click of a button. The Azure platform has a data collection capability that aggregates operating system events in a way that makes it simpler for the Prometheus monitoring solution to consume, he added.

    DevOps teams, however, will still have to collect data from the applications they instrument on the Azure platform, he added.

    Logz.io integrates multiple open source monitoring tools based on metrics, logs and traces within a single observability platform that otherwise would require considerable time and effort from internal IT teams on their own.

    Interest in observability is rising as organizations attempt to provide internal IT teams with more context when troubleshooting issues. Whenever there is an IT issue, most teams convene a “war room” where they attempt to discover the root cause of an issue by comparing analytics generated by a wide range of monitoring tools. Observability platforms promise to enable a DevOps team to replace many of those tools in a way that provides more context by integrating log data, metrics and distributed traces within a single platform.

    In many instances, existing application performance management (APM) platforms are being transformed into observability platforms by adding tools to monitor IT infrastructure. Conversely, platforms for managing IT infrastructure are adding support for tools to monitor applications. Elsewhere, a range of startups have emerged to offer observability platforms they have developed from the ground up.

    Regardless of the platform employed, the rise of microservices-based applications within many organizations is forcing the observability issue. The dependencies that exist within microservices-based applications are too complex to manage without a platform that provides some level of increased observability. Of course, most existing monolithic applications are not being retired any time soon, so the need for an observability framework for both legacy and modern cloud-native applications has only become more pressing.

    The Logz.io platform can, of course, be deployed on other cloud platforms as well as within on-premises IT environments. As hybrid cloud computing continues to evolve, it is apparent that observability platforms will need to extend their reach from the cloud to the network edge. Over time, artificial intelligence (AI) capabilities will be added to make it easier to, for example, streamline the number of alerts that are generated across complex IT environments.

    In the meantime, the most important thing with regard to observability may be simply getting started. Most IT teams start to analyze logs before moving on to metrics and then traces using the open source Jaeger agent software. After all, the only thing more difficult to instrument than an application before it is deployed is, arguably, one that is already running in a production environment.