Tag: application performance management

  • Visualize Logs to Get More Value from Data

    Visualize Logs to Get More Value from Data

    Why do you keep logs? Regardless of the type of logs we’re talking about, you keep them because you expect them to provide some value for the organization. Maybe the logs will help you improve profitability; perhaps they will help you recover from downtime or perhaps they are expected to alert you to a security incident in progress. If you’re a system administrator or someone tasked with infrastructure reliability and maintenance, you’d agree that logs are critical. They represent the source of truth you go to for information about your server status and activity, website traffic, application performance and much more.

    No matter the intended purpose of logs or how you use them, the information in these logs should be easy to access and interpret. Today’s complex systems generate enormous amounts of log data, making it almost impossible to dig through tons of data in raw text files to find important information. Finding valuable information is immensely difficult in text logs but not in the visual world. This is precisely where log visualization comes into play. What if the data in your logs could transform into graphic shapes and patterns? Wouldn’t it be much easier and faster to decipher information from log data and understand it better?

    What are Logs, and What are They Used For?

    Before going any further, let’s make sure everyone is on the same page about the meaning of logs. A log is a textual, timestamped record that tells us what happened and when. DevOps engineers have to rely on a combination of logs from various system components and data sources to understand why an event occurred, and perhaps even predict future events.
    logs value unknown


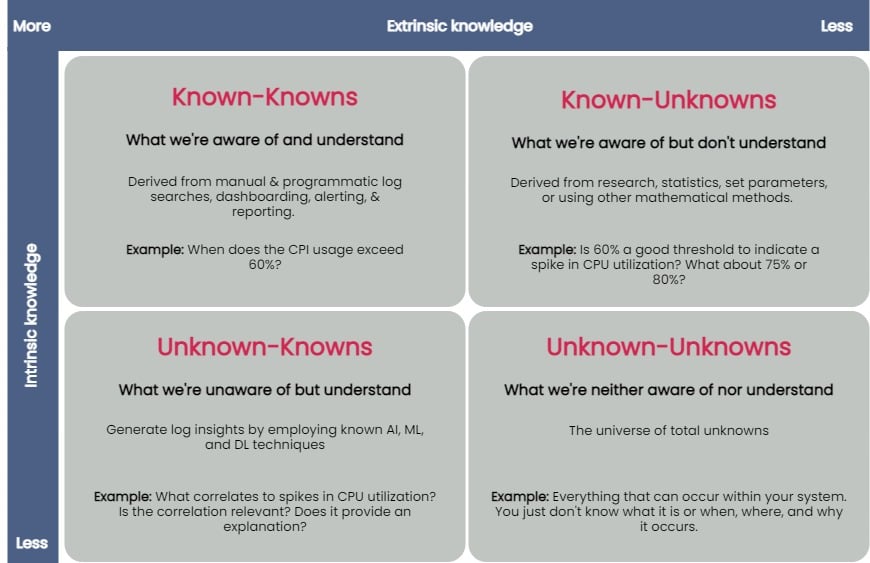
    You can taxonomize knowledge extracted from log data into four key groups: known-knowns, known-unknowns, unknown-knowns and unknown-unknowns. Manual and programmatic log searches, dashboarding, alerting and reporting manually extracted log fields are common ways to extract and analyze known-knowns. These methods assume that the engineer is already familiar with the data and knows where to look for answers. You can use statistics or other mathematical means to algorithmically resolve the known-unknowns, such as search terms and thresholds. The unknown-knowns are taken care of using AI/ML/DL techniques that generate log insights such as event correlations, log pattern clustering and known anomaly detection. But what about the unknown-unknowns?

    Uncovering Unknown-Unknowns

    With raw text logs, it’s relatively simple for engineers to conduct machine searches or set alerts upon encountering certain specific errors or specific types of behavior. However, to search through logs or even set up alerting parameters requires you to know what you’re looking for. If you have no idea what kind of errors or threshold limits for which you need to be alerted, it’s impossible to set these up.

    Modern applications are incredibly complicated, and one can not honestly understand everything about how they work or even always ask the right questions when things go wrong. But if an engineer reviewing logs doesn’t even know what to search for, it becomes impossible to figure out without an assistance tool like a purpose-built log visualization solution.

    For the most part, none of the techniques used to uncover the known-knowns, known-unknowns, and unknown-knowns of log data can help reveal the unknown-unknowns. An effective way of unraveling them is to rely on human intelligence to explore the unknown-unknowns space. Supplementing human intellect with a purpose-built log visualization tool can significantly help analyze the unknown-unknowns. Once you’ve recognized the unknown-unknowns, you can quickly feed this knowledge back into the appropriate, less esoteric groups (known-knowns, known-unknowns and unknown-knowns) and get more value from your log data.

    A good log visualization tool can aid in gathering knowledge from unknown-unknowns and can inform proactive log analysis or fast reactive log analysis use cases. Current log analysis practices center around reactiveness; the focus is to minimize and resolve issues after a problem has occurred. Using a log visualization tool, you can quickly isolate subtle and anomalous changes within a system by visualizing patterns generated from log data and exploring unknown-unknowns before an incident occurs.

    Current log visualizations are limited in display log count distribution and its variations. They do not visualize other log attributes or log combination attributes.

    All the UIs shown have similar function usage and displays. Drilling into an example of UI windows gives one the feeling of a typical log analytics practice. The figure below annotates different log analysis functions in the labeled, boxed area. None-visual log analytics functions such as search, tag, and log display are all required time-range input.

    log metrics annotate UI

    An ideal log visualization tool should not rely on just one information type. Log data is multifaceted. A log visualization tool can only begin to be valuable when it lets you focus on as many facets of log data as you can derive.

    Log Visual Pattern Discrimination

    The power of log visualizations comes from humans’ ability to recognize visual patterns. It’s hard to spot a pattern among raw log data, but it becomes easier once you can visualize that data.

    When an experienced DevOps operator looks at a log visualization, they can easily see where the anomaly is, even with no previous understanding of how the system works or where the anomaly might be coming from.

    Visualizations allow engineers to identify visual patterns and quickly understand what is going on in the system—whether it’s a hack in progress or an error causing a poor user experience. Visualizations are compelling, as they help shed light on important events, even if the engineer has no idea where to look or had no idea there was a hack going on in the first place.

    For instance, consider a scenario where a complex system generates millions of logs daily. Suppose we were to establish a baseline of the number of logs the system would generate when functioning normally. In that case, we’d have to take a daily count over a couple of weeks, or at least a month, to deduce a good-enough baseline.

    Even if we derive an acceptable baseline, we’d have to keep recording daily counts and compare it with this baseline to detect an anomaly. Doing this can be time-consuming and counterproductive as you might end up discovering an anomaly when it’s already too late to take any action.

    Once we plot logs daily on a graph, we can immediately figure out the baseline by observing it visually. Once we’ve visually established a baseline, we can instantly identify anomalies when we see values plotted above or below that established baseline. The following image visualizes logs ingested over ten days, illustrating how simple it is to establish baselines and identify when a system is doing something outside its usual behavior. This graph can deduce the baseline to be around 38,000 log records, with anything above denoting abnormal behavior within the system.

    log visualization

    Better Log Visualizations

    There are a few essential criteria for creating good log visualization analytics. They are:

    Use original log data. Data strategy is important. Most log data is unstructured by default, and many organizations tend to convert it to structured data before doing anything else with it. Doing so is a mistake, as you can lose vital pieces of information in the process. Good visualizations should be based directly on the logs exactly as the system produces them.

    Log data consistency. The format for the visualization should be consistent because if there are constantly changing variables, it becomes harder for humans involved to spot patterns.

    Choose robust log attributes and use them wisely. Instead of using just one log attribute for visualization (such as time distributed log density), you should look at visualizing more facets. Doing so gives analysts a better grasp of—and an intuitive understanding of—the log data set. For example, multiple pictures of an elephant taken from different angles help people understand elephants better than showing them only a single photo of an elephant taken from one angle. Similarly, if we break down logs by each of their attributes and then plot their frequency, we can better visualize how a system is performing. However, the attributes you pick are critical to providing valuable visualizations.

    With modern systems becoming even more complex, deciphering logs and uncovering unknown-unknowns will never be easy. The time is right to introduce new log visualization techniques to handle these unknown-unknowns. With log visualization becoming more user-friendly, you no longer need to count on people to be familiar with log interpretation or be aware of statistical, mathematical or AI techniques to analyze log data. Visualizing log data is not just a decision-making aid to human intelligence, discriminating between what is and isn’t acceptable and quickly identifying and remediating issues—the knowledge gained from unraveling the unknown-unknowns also helps advance AI/ML and automation techniques used to ascertain the knowns of your log data.

  • Automatic Right-Sizing is Magical Thinking

    Automatic Right-Sizing is Magical Thinking

    Some months ago, AWS evangelist Corey Quinn wrote a short blog post titled “Right Sizing Your Instances Is Nonsense.” As usual, Corey was spot-on in his takedown of cost-reduction-magic-AI industry hype. But his piece only scratches the surface. I would take the argument a step farther and say that anyone who tells you they can automatically and generally “right-size” compute instances simply doesn’t understand how software works.

    Does that strike you as overly aggressive? Stay with me. Even if you don’t wind up agreeing, there’s a lot to be learned about AIOps from a discussion of “automatic instance right-sizing.”

    What is Right-Sizing?

    Quoting directly from the website of one of the many services that claim to provide “right-sizing” for cloud instances:

    “The Recommendations Engine leverages the time series data of relevant utilization metrics for your resources, then creates a statistical model around average and peak utilization periods. The tool leverages historical utilization data to identify performance characteristics across instance types, families and zones to provide valid recommendations for your workload.”

    The idea behind this “right-sizing” is quite simple, really: track a bunch of cloud service metrics (and maybe a bunch of OS metrics, too, if they are available), use some statistical model—commonly called “AI” on VC decks—and magically deliver recommendations for a more cost-effective cloud instance type.

    There’s just one problem: creating a useful statistical model from generic metrics is practically impossible unless your software is purpose-built to support it, and that is never a software design goal. In fact, software is almost always built in a way that is completely contrary to this goal, and for very good reasons. To understand why, let’s go over the assumptions behind “right-sizing”:

    1. The software will be able to use all given resources
    2. Performance will improve (or degrade) predictably and uniformly with added resources
    3. Metrics accurately describe application load
    4. Scaling dimensions are independent
    5. There will be no side effects on connected systems

    It turns out, none of these assumptions behind right-sizing are generally true.

    A Crash Course in Software Scaling

    In theory, software is bottlenecked on resources, be they CPU, disk, RAM, network, what have you. In practice, however, it is extremely difficult to build software that can fully utilize resources.

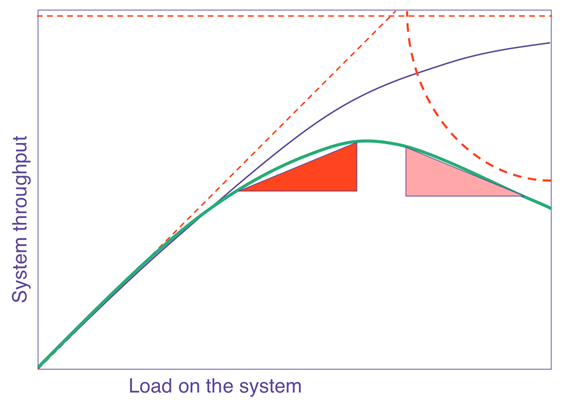
    The general curve that describes how software scales with resources or load is known as the Universal Scalability Law (USL). In a nutshell, it says that on any chart showing scale versus performance, you will see a region of linear scaling where adding resources (say, CPU cores) proportionally increases performance; however, you will then see where performance continues to increase on a nonlinear basis, with smaller and smaller gains with every additional resource until, at some point, the benefit is so marginal as to be completely negligible. This is known as Amdahl’s law, which states that the performance of every program is limited by the serial part.

    Beyond Amdahl lies the issue of retrograde scaling, the existence of which people often forget about until the consequences hit them smack in the face. In this issue, adding resources actually slows down the system. That’s right. From this point onward, larger servers will make your software slower.

    The reason this happens is that, to scale linearly, the workload and resources must be completely isolated and decoupled from each other, which isn’t realistically possible. There are always shared components, e.g. the kernel scheduler, the memory controller, the main PCI bus, perhaps the algorithm requires locking. In any case, the net result is queueing on the shared resource, which might also become a bottleneck when overloaded. Think of a supermarket checkout: you can admit more and more shoppers into the store, but they will still end up waiting at the checkout, eventually, no matter how many registers you open and staff. Performance is limited by the number of checkout counters, not by the number of shoppers or clerks. Worse yet, if the queue gets out of control (maybe people got tired of waiting and shopping carts are literally abandoned in front of remaining shoppers, blocking the path to checkout — think of this as the contention of retries and timeouts), the throughput of checkout will decrease as counters are starved for shoppers.

    right-sizing

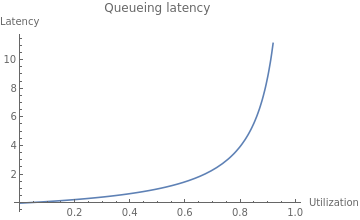
    The USL shows us what happens to throughput as we scale, but what about latency?

    right-sizing

    As resource utilization approaches 100%, the wait time for the resource will approach infinity in a nonlinear fashion. This is why systems are designed to run at low utilization, so that quality of service does not degrade too much. You might see a server running at 50% utilization and think, “We can use a server with half the resources and save money!” but if you actually try to do that, you will degrade latency and quality of service to an unacceptable level, most likely causing an outage.

    The Dark Arts of Configuration

    Even if your software is able to take advantage of available resources in theory, it needs to be properly configured to use them. Buffer sizes, thread pool sizes, memory heap size, number of connections—most software has numerous options to tune it for resources and specific workload. You can’t just change the box size and expect it to work! Not to mention, it’s quite possible your current configuration is far from optimal. I’ve substantially reduced cluster sizes on several occasions by making a one-line configuration change.

    For example, a common web server configuration is the number of concurrent requests the server can handle (often expressed as number of threads), which relates to the number of CPU cores available, the amount of memory available to the specific workload and the average time it takes to handle a request. The problem you are solving isn’t “What instance size will have the best ROI?” but rather “What combination of instance size and configuration will have the best ROI?” That is a totally different question that requires specific knowledge of the application to answer.

    Let Them Eat Cache

    In the old days, when you tried to allocate memory beyond what was currently available, the operating system would simply refuse your request. Ah, the good old days were simple! Alas, in our quest to simplify programming and resource management, and to allow software to efficiently adapt to a changing environment, we made common use of resource tradeoffs. For example, a complicated computation can be calculated again and again using the CPU, or the results can be saved and reused, saving CPU time and trading it for the use of RAM or disk. This pattern is quite common; when you overallocate memory, the operating system may trade off CPU to free memory by compressing memory objects, or it may trade off disk space by paging out RAM to swap. Java, Node.js and Go each have a similar tradeoff where they spend CPU time on garbage collecting to free RAM. Modern software makes numerous tradeoffs between CPU, RAM, disk and network in multiple dimensions. The end result is that different resources are coupled in many unexpected and obscure ways.

    Lies, Damned Lies! (And Metrics)

    Speaking of that server running at 50% CPU utilization, it is quite possible that server is also maxed out on CPU at the same time. How can this be? It’s because the metrics you see are not raw data but aggregates—in many cases, averages—and aggregates hide certain behaviors that can be very important; for example, peaks and bursts, such as the ones you get from compaction, garbage collection and other periodic processes that routinely run in modern software. There are billions of events happening every second on a modern server, and only a few data points of metrics emitted every minute. All metrics are loss-y; it’s simple math, really. But machine learning (ML) models are only as good as the data they work on, so if the metrics weren’t specifically created to show the relevant behaviors—and they weren’t—the model would be completely blind to their existence.

    What is “Performance,” Exactly?

    Whenever we deal with resource allocation, we are interested in its impact on performance, which raises the obvious yet rather uncomfortable question: what’s your definition of “performance?” Is it throughput? Latency? Mean or the 99th percentile? Of which transaction? Or, perhaps you are mostly interested in the rate of purchases executed on the website? These are all different things, and often, optimizing one might degrade the others.

    This kind of discussion is the first step in any performance engineering session—but completely absent from the scope of “right-sizing” services, and the last thing you want is the generic cost function of the ML model costing you money.

    This wouldn’t be so bad if all performance goals could be achieved at once, but, sadly, some of them are in opposition: e.g., higher throughput causes higher latency due to queueing effects. When making changes to software systems, we have to know what performance metrics are important to us.

    The Curse of Local Optimization

    It is very tempting to look at a cluster of machines as an independent system. But if that system is doing something meaningful, it is part of some bigger system, and changing the configuration will likely have an effect on the larger system it is a part of. When we make changes to subsystems, it is with the intent of improving the system as a whole, to make the customer happy and make more money. But when a change to a subsystem is motivated by a desire to reduce the cost of the subsystem, the result is often an increase in the overall cost of the system! This is because the local cost of subsystems is relatively small compared to the cost of the entire system, not to mention the possible reduction in the income of the system. For example, you could save lots of money by using older, slower servers, but your customers won’t be very happy with a slow application and your profits will suffer—which will probably cost you much more than whatever you saved.

    To take this ad absurdum, you could save 100% of the subsystem cost by turning it off completely. Of course, the assumption is that changing server sizes will not have any side effects, which, as discussed, is highly unlikely. There will be side effects on connected systems as well, some of which will not appear immediately. Load is variant, and operational overprovisioning and buffers were often put in place for a reason. It’s quite likely the reason for low utilization is safety margins.

    The Problem With “Right-Sizing”

    The basic problem with “right-sizing” is the rather obvious, yet implicit, assumption that there is such a thing as “the right” size. Software engineering is all about tradeoffs, precisely because it’s very rare (if it happens at all) that one thing can be improved without making another thing worse. Tradeoffs mean business decisions to make, and you really don’t want a generic ML heuristic to make those for you. ML is very good at dealing with problems where a lot of data is available, the data is high quality, the data is predictive of behaviors (which isn’t the case for complex systems!) and most important, the problem is well defined. Most problems in AIOps are very far from this. Don’t take it from me, take it from the people who excel at both high-scale ops and ML.

    Even if it was feasible to make such ML models work, software is unable to automatically adapt to different machine sizes and fully utilize server resources. If it were, companies like ScyllaDB and Azul Systems wouldn’t need to exist. Creating software that is scalable and resource-efficient on modern hardware is a very difficult problem, and without those building blocks, ML models are constructing very shaky structures.

    It’s worth emphasizing that I’m not arguing against adapting the size and configuration of servers, only that doing so automatically and blindly for some local “cost-saving” goal isn’t the solution you might think. The goal of such changes should be to raise the overall quality and performance of the larger system guided by a theory of how that system works. ML is not a replacement for human thought and learning. There might certainly be an “optimal” instance type, or even a few, but “optimal” implies a target metric that certainly isn’t cost reduction. No system exists for the sole purpose of being inexpensive. All systems exist to serve business requirements first, and to be low-cost second.

  • Cortex Taps GitLab to Help DevOps Teams Manage Microservices

    Cortex Taps GitLab to Help DevOps Teams Manage Microservices

    Cortex, a provider of a platform for tracking ownership of microservices, this week announced its platform can now import services from the GitLab continuous integration/continuous delivery (CI/CD) platform.

    Anish Dhar, Cortex CEO, said the company’s platform is now integrated with more than 30 tools that are regularly employed by DevOps teams, including offerings from GitLab, Datadog, Sonarqube, Snyk and PagerDuty, as well as open source platforms such as the Kubernetes container orchestration engine and the Istio service mesh.

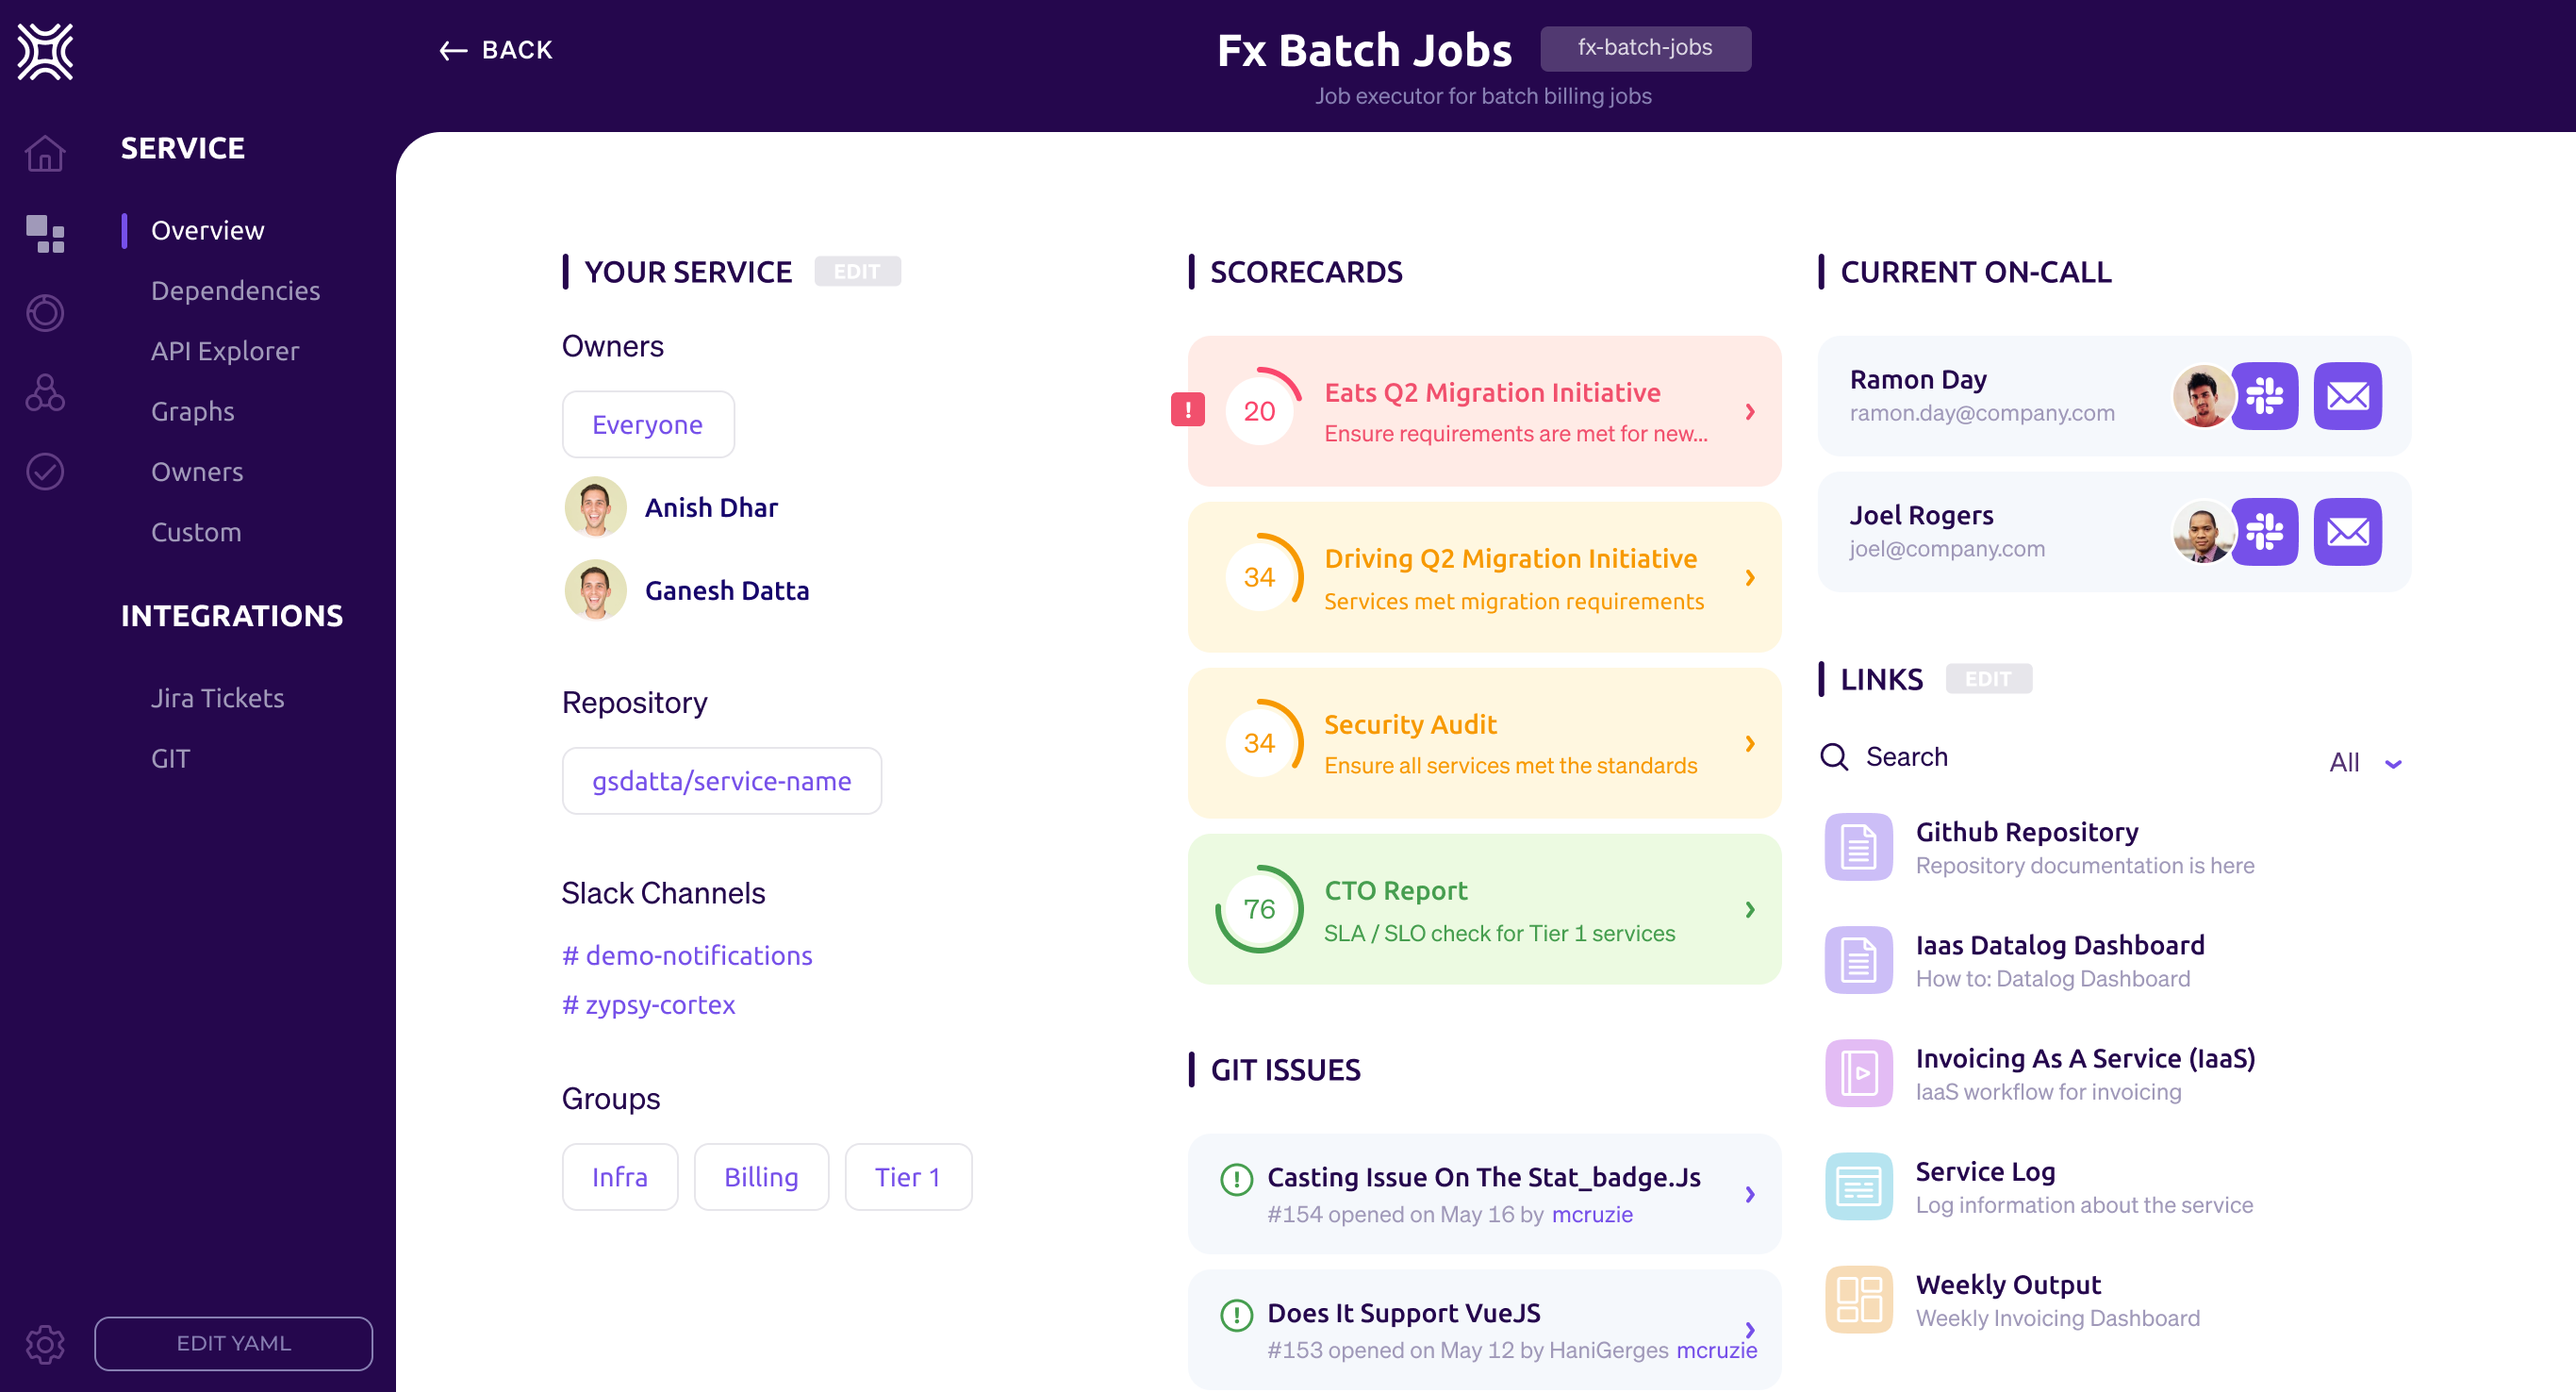
    Designed for site reliability engineers (SREs) and other DevOps professionals, the Cortex platform eliminates the need to rely on spreadsheets to manually track ownership of microservices. Instead, Cortex imports data residing within the tool employed by developers to surface who within an organization is responsible for maintaining which microservices.

    In addition, a Cortex dashboard enables DevOps teams to see which developers are on-call in the event of an unexpected incident, the latency rate microservices are experiencing and which vulnerabilities have yet to be remediated.

    Grades can also be assigned to specific microservices based on metrics that are associated with a specific microservice. That approach allows DevOps teams to apply gamification techniques using a scorecard to encourage developers to continuously improve their microservices, noted Dhar. That approach will also make it apparent to other developers which microservices running in a production environment can be most reliably employed, added Dhar.

    Cortex

    At the core of the platform is Cortex Query Language (CQL), a domain-specific language that allows DevOps teams to define granular rules that can be applied to, for example, on-call rotations, security vulnerabilities, package versions, service level objectives (SLOs) and the overall health of the microservice. Engineers can employ code in the form of YAML files to set reliability standards across teams and types of services through direct integrations with a variety of tools. In effect, Cortex provides a reliability-as-code platform, said Dhar.

    As responsibility for applications shifts further left, each development team is being held accountable for the life cycle of any microservice or application they create. The challenge enterprise DevOps teams are encountering is that when there are hundreds, even thousands, of microservices, it’s difficult to determine who on the development team is responsible for a specific microservice. Rather than trying to keep track of the relationship between development teams and microservices using a spreadsheet, Cortex is making a case for a tool that automates that discovery and tracking process.

    Most organizations today are embracing microservices to build and deploy more flexible applications at varying rates. However, it’s only a matter of time before they find themselves trying to navigate a web of interdependencies between microservices that can’t be managed using spreadsheets. DevOps teams, of course, might be inclined to use their skills to create their own tool for tracking microservices. However, given all the tasks at hand, maintaining a custom platform for discovering and tracking ownership of microservices is likely something better done by a vendor willing to maintain and support a purpose-built tool.

  • How to Gain Greater Value From DevOps

    How to Gain Greater Value From DevOps

    DevOps is more than just deployment and management. Fully leveraging the DevOps team and their activities can actually enhance operations and improve customer satisfaction.

    Be Proactive, Rather Than Reactive

    Say you deploy a new version, encounter some problems and then react. What if you could stay at least a step or two ahead by becoming more proactive?

    Check your metrics and look for trends. You can spot rises in error rates or latencies over time and identify problems just as they are bubbling up. Ideally, you’ll identify them when they are merely minor issues, not when you’re already required to hit the panic button or roll back. Looking ahead to see what’s around the corner puts you in a much better place.

    Use Feedback to Improve Operations

    While it’s true that investing time and resources to automate tasks, such as deployment, is a good thing, it’s even better to focus on another high-value DevOps activity—bringing insights from operations into your development pipeline.

    Incorporating feedback and ideas into your processes puts you in a much better place, especially because there are already tools out there to help you do those deployments and other tasks pretty easily. For example, once you’ve packaged your application into a container, you just need to push a few buttons to set up automatic scaling, load balancing and routing. With all of that automated, you can focus on what’s really important—your application.

    Track Customer Behavior

    Here are two gems—both easy to set up and use, from the same GitHub author—that you can use to track your customers’ behavior, monitor usage and get better insights to improve operations.

    Ahoy—Use this to track user visits to your web page to determine specific named events that you want to add to your code. You can do this from either the server side and a controller, from JavaScript, or via a simple API. It uses two tables that you can easily query, plus some smart built-in data visualization capabilities.
    Blazer—Use this to gain visibility to your database by just adding a mount point to your routes file so that you can access the web application. It provides an easy interface to do SQL queries and show the results.

    Check the Metrics Often

    Once you get these tools set up, don’t stop there. Check the metrics—weekly if possible—and see what the trends are. Ask questions. The cool thing about operations—unlike engineering and writing software where you’re trying to solve one problem—is it’s not always well defined. You may not even know what questions to ask at first. However, diving into the metrics and seeing what patterns emerge from the use and events will not just benefit your customers, but also feed back into your development cycle. This empowers you to go back and reevaluate decisions made earlier on and learn where you should direct your attention and energy going forward.

    Be sure to enhance your focus on where DevOps can actually take you. It’s not just about writing automation and deployment scripts. The synergy of analysis and software is the future of DevOps.

  • Observe Seeks to Put More IT Metrics in Context

    Observe Seeks to Put More IT Metrics in Context

    Observe, Inc. announced today it has updated it observability platform to add support for metrics based on time series data. In addition, the company is revamping how the platform generates alerts as part of an effort to surface more actionable intelligence.

    Jeremy Burton, Observe CEO, said rival observability platforms require IT teams to sift through hundreds of metrics that are generated using elaborate tagging schemes that ultimately drive up the cost of storage. The Observe platform curates metrics by associating them with, for example, a customer, to provide more relevant context, Burton noted.

    That approach eliminates the need to present IT teams with overwhelming lists of metrics in addition to reducing storage costs by removing the need for a complex tagging scheme, added Burton.

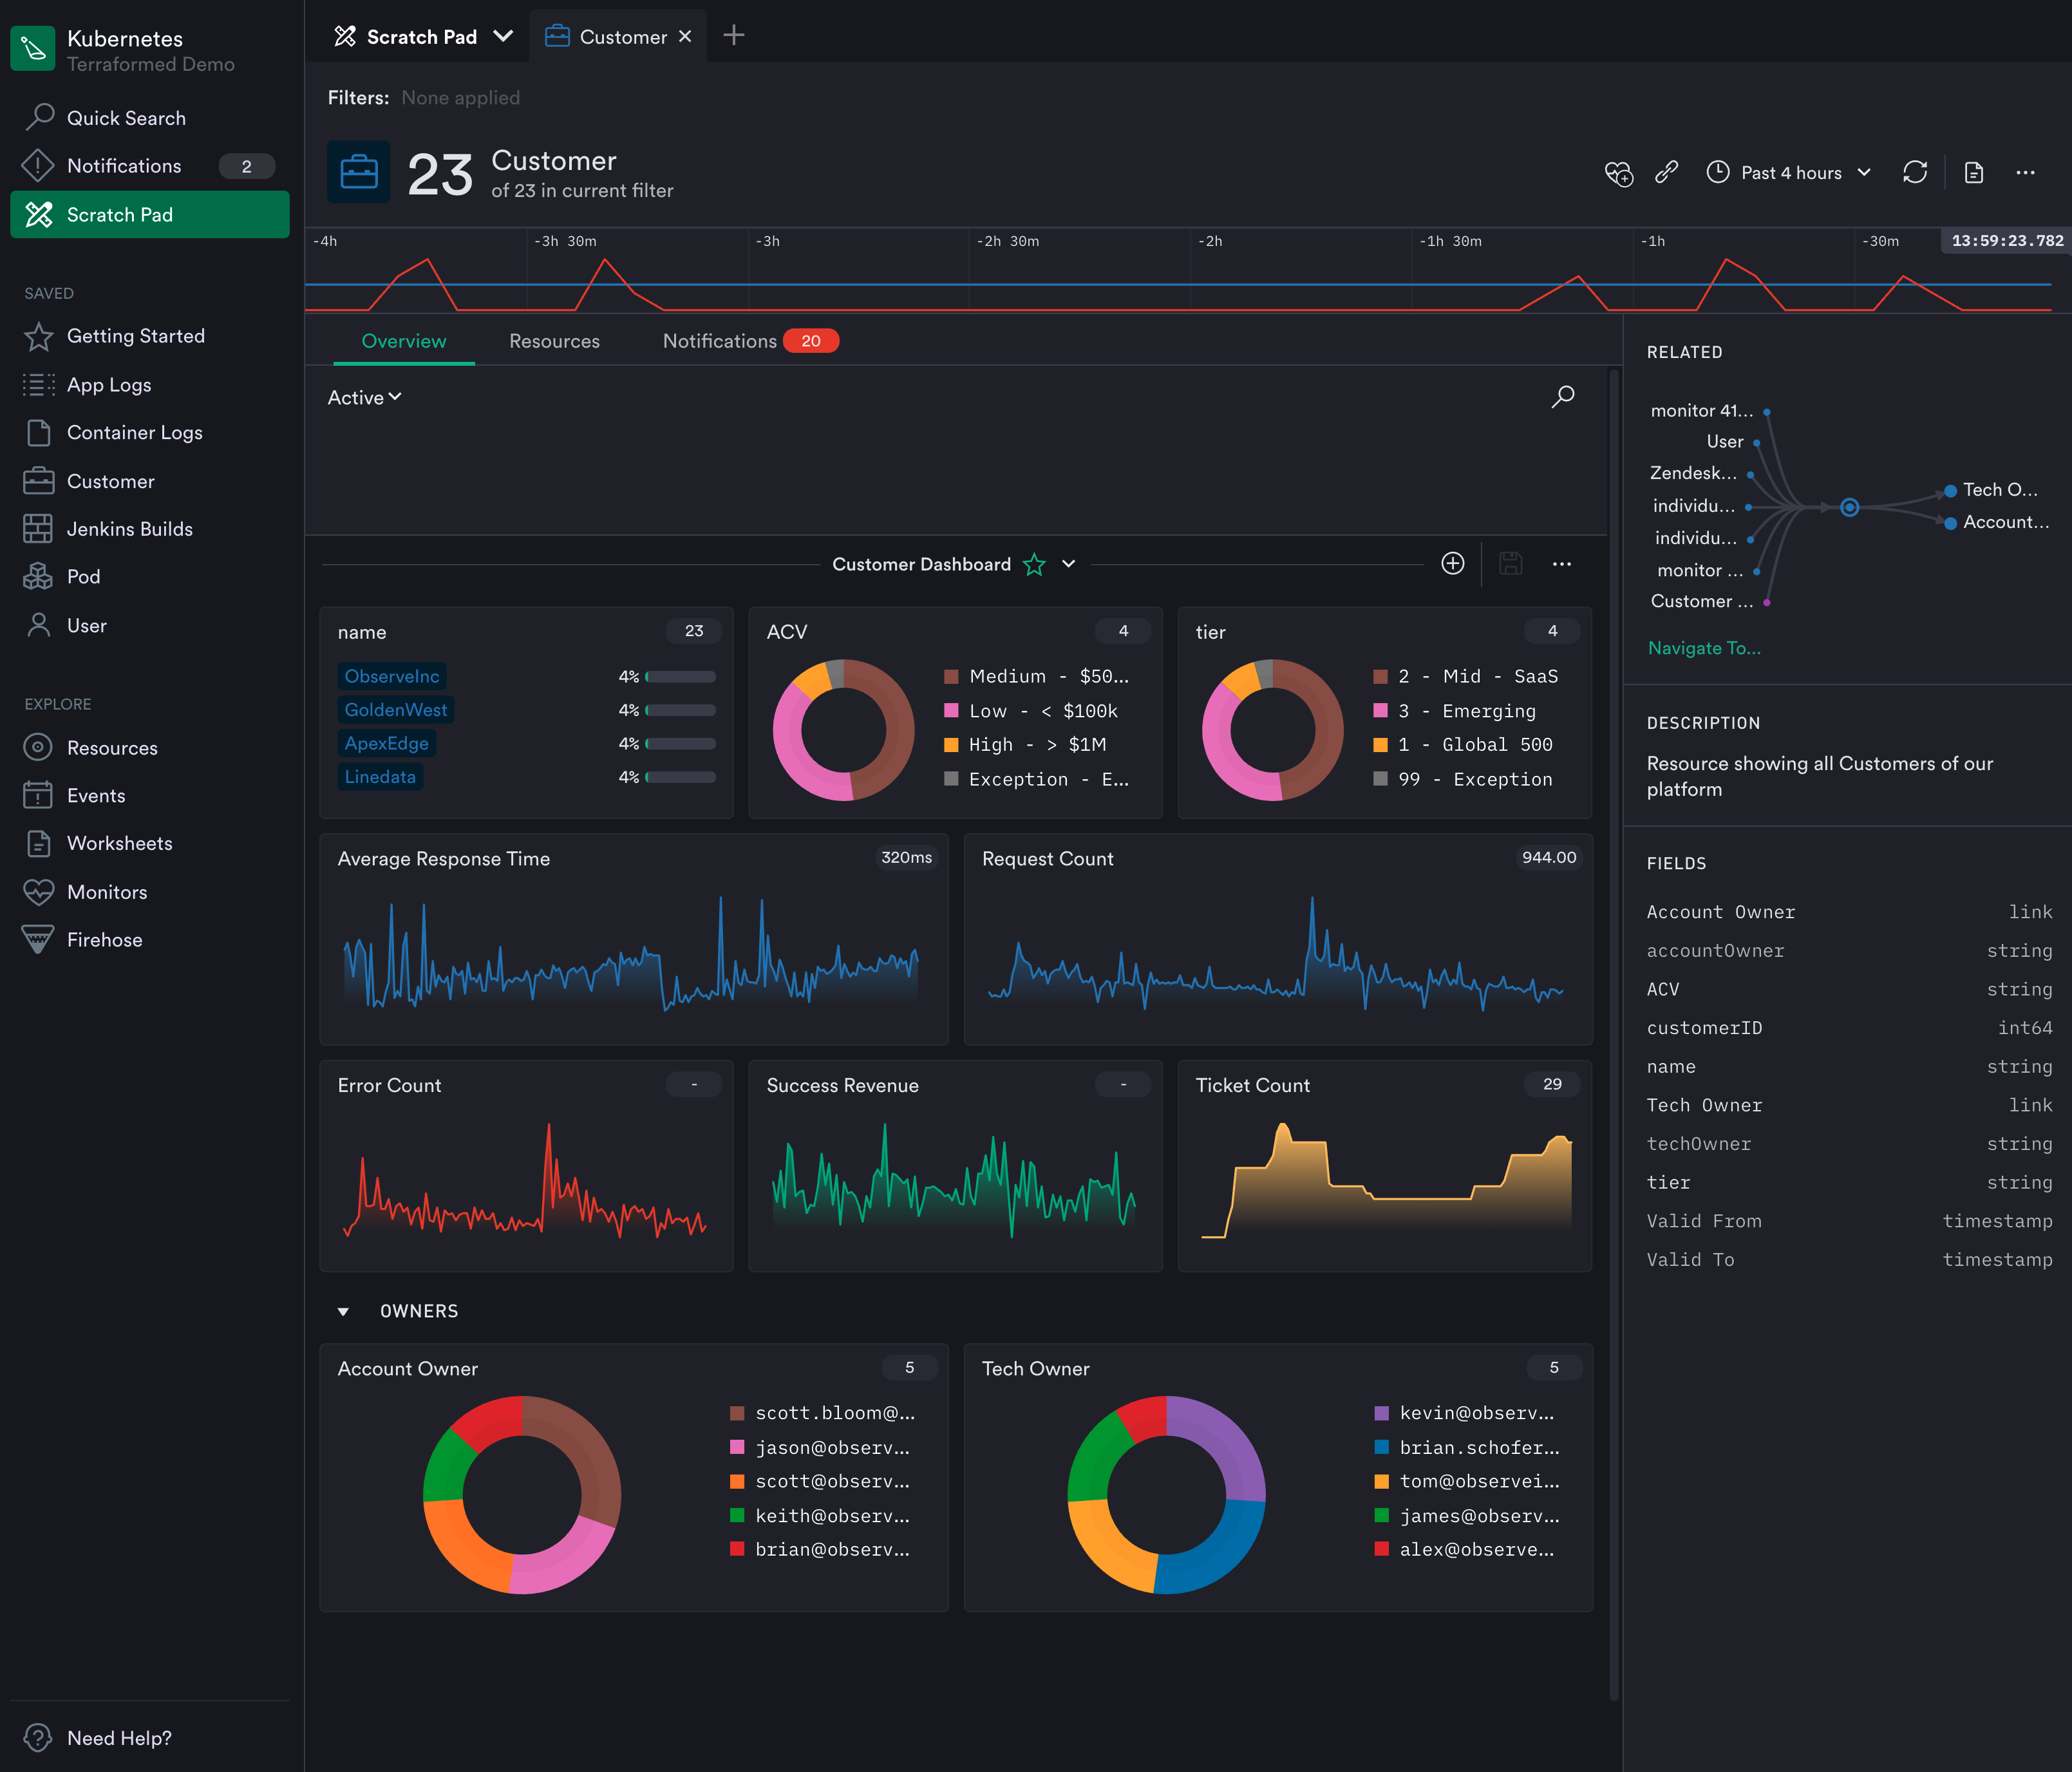
    The latest update leverages that approach to metrics to only generate alerts based on curated metrics attached to customers, pods, shopping carts or containers. Rather than simply being alerted to a drop in response times, for example, the IT team can also easily see which customers or pods might be affected. That shift will reduce the volume of alerts that are already overflowing in email inboxes and across other communications platforms.

    Fresh from raising an additional $7 million, Observe today also revealed it has added 20 paying customers since launching the platform on top of the Snowflake cloud service residing on the Amazon Web Services (AWS) public cloud. Rather than reinventing the same core infrastructure, Observe is leveraging a data analytics engine that is already widely employed in IT environments.

    For now, Observe will continue to primarily focus on metrics as part of an effort to deliver insights in a form IT operations teams are prepared to consume today, said Burton. Over time, however, Observe will add support for distributed traces via tools such as OpenTelemetry and Jaeger as it adds additional application performance management (APM) capabilities, added Burton. Rather than telling IT operations teams they are managing IT in the wrong way, the goal is to meet IT operations teams where they are today, noted Burton.

    That strategy also enables the Observe platform to be employed to manage both monolithic and microservices-based applications running on Kubernetes clusters, noted Burton. The immediate goal is to provide IT teams with an alternative to legacy monitoring tools that provide more context at total lower cost by allowing IT organizations to rationalize tools that don’t tend to be especially well integrated, added Burton.

    In the longer term, Observe will also employ machine learning algorithms to collect data more efficiently. However, Burton said the company remains skeptical of visions of an IT future that depend on machine learning algorithms to continuously learn IT environments that are not only unique, but subject to frequent changes.

    Competition among observability platform providers is already fierce. Each IT team will need to decide what type of platform makes the most sense for them based on costs and their preference for specific capabilities one vendor might have that another doesn’t provide. One way or another, however, the way IT environments are managed will soon be changing for the better.

  • Nobl9 Makes SLO Specification Open Source

    Nobl9 Makes SLO Specification Open Source

    During an online SLOconf event today, Nobl9 revealed that the platform it created to enable IT teams to achieve service level objectives (SLOs) is now available under an open source Apache license.

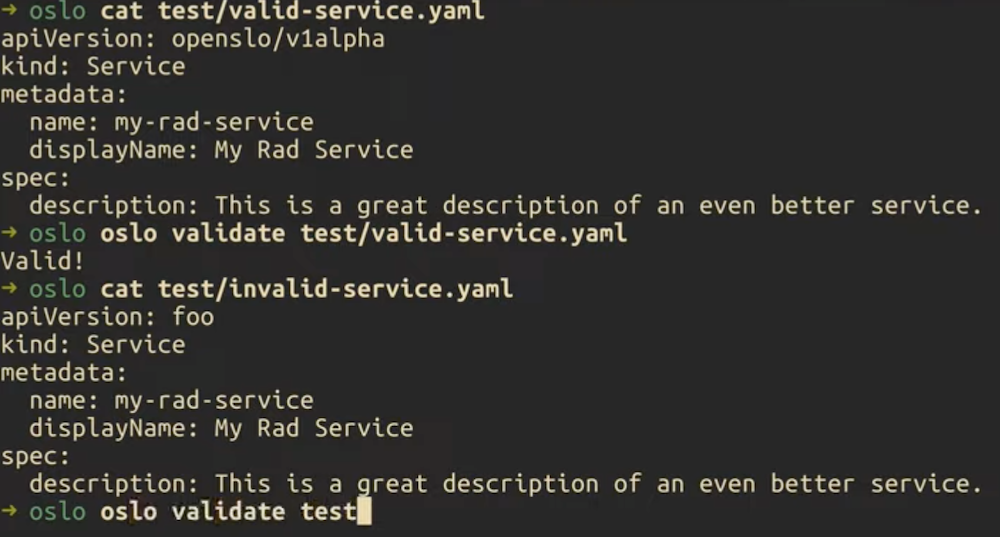
    Brian Singer, chief product officer for Nobl9, said the goal is to make a YAML specification format for defining SLOs that includes a parser and basic validation and testing capabilities more accessible via an OpenSLO project. Achieving that goal is critical at a time when organizations are deploying microservices-based applications that have dependencies that often adversely impact performance and availability.

    While the concept of an SLO and/or a service level agreement (SLA) has been around for a long time, IT teams that have embraced DevOps best practices by hiring site reliability engineers (SREs) are programmatically attempting to assure that SLOs are attained and, just as importantly, maintained, said Singer. Most SLAs have, historically, not been well-enforced. OpenSLO makes it possible to achieve that goal by embedding SLO objectives within a YAML file that become part of a Git-based workflow, he noted.

    SLOs

    Niall Richard Murphy, author of the book, Site Reliability Engineering, has signed on to be a core OpenSLO contributor working alongside committers from GitLab, Dynatrace and Nobl9. The ultimate goal is to make it simpler to share and migrate portable SLO specifications across multiple application development projects by constructing them using an object model, said Singer.

    Nobl9, meanwhile, will continue to operate a software-as-a-service (SaaS) platform for managing SLOs based on OpenSLO. Singer noted there will be an increased need for OpenSLO as it becomes more widely employed. The Nobl9 SLO platform is compatible with monitoring platforms such as Datadog, New Relic and Prometheus, and uses data collected from monitoring and observability platforms to calculate acceptable rates of error per service. It can be configured to trigger alerts and even workflows in anticipation of outages.

    Accessible via a CLI/GUI/API, the platform also enables DevOps teams to create business rules and define “facets” of users based on the application experiences required. DevOps teams can identify users who are being serviced poorly in addition to tracking groups of users. They also can associate contractual obligations to an SLO for a critical business period.

    The platform also makes it easier to determine how to make systems more reliable or lower reliability goals to reduce costs when possible. IT organizations will also spend much less time determining the root cause of any issue using a combination of real-time and historical data that is more accessible. Today, it’s not uncommon for IT teams to spend weeks looking for the source of an application degradation issue, only to discover the problem can be fixed in a matter of minutes.

    It’s still early days as far as adoption of SLO-as-code is concerned, but the days when SLAs or SLOs were, at best, aspirational statements of intent are coming to an end. The expectation is SLOs will soon be maintained via YAML files embedded within application code and distributed across a rapidly expanding enterprise with more interdependencies than any IT team can manually track.

  • Consider Telemetry When Rearchitecting Applications

    Consider Telemetry When Rearchitecting Applications

    Australia and New Zealand have seen a big move to the public cloud, and “… when I talk to customers, I see huge interest in rearchitecting applications rather than doing a lift-and-shift right into public cloud,” said Scott van Kalken, F5 ANZ solution architect for DevOps and modern applications.

    That migration to the public cloud has led to massive interest in telemetry. When you go from a monolithic application to a distributed app, there may be 100 or even 1,000 APIs involved. Without telemetry, you don’t know what’s going on with those APIs. But the telemetry needs to be consistent.

    F5’s 2021 State of Application Strategy report found 75% of respondents considered telemetry, especially about application security and delivery, important for meeting business outcomes, and 95% of respondents said they are missing insights from their existing monitoring and analytics solutions.

    Van Kalken recounted a conversation with a practitioner as an example. This practitioner gets yelled at when problems arise with partner APIs used by the application he manages. So, even though these APIs are not technically his responsibility, he needs visibility into their status. Only by combining internal telemetry with telemetry from these partner APIs can he make sense of what’s happening within the application ecosystem.

    And it’s not just a question of whether an API is available or not. Problems can arise when it is responding slowly. “‘Is that normal? Is that normal for this time of day?’ I’ve got to have some sort of telemetry data available to me to make decisions,” van Kalken said.

    Enabling Security Automation with Telemetry

    An aspect that’s particularly interesting to him is the ability to automate or otherwise take action based on security telemetry data.

    A simple example is a security event that reveals some kind of systems abuse. Automation can add a firewall rule to block the associated traffic.

    As organizations increasingly adopt event-driven architectures, events and responses occur at the application, network, infrastructure and other levels. “The minute that you automate those event-driven architectures with security, it opens up a world of possibilities.”

    It’s not just about automating security. Imagine an API gateway that serves a variety of APIs to customers. Telemetry might reveal that two of the APIs are starting to slow down; in which case, “I might kick off a workflow that just deploys more of them so that we can handle the load. But if you don’t have that telemetry, you can’t do that,” he said.

    In practice, this involves telemetry, analytics and automation.

    “When we show [customers] how you can make use of the analytics in a really easy way, their eyes light up,” van Kalken said.

    Multi-Cloud Migration

    A further consideration is that rearchitecting applications isn’t just about splitting monoliths into smaller pieces and redeploying them as microservices. There’s also a desire to run them across multiple public clouds to reduce risk, and also to deploy applications at the edge where they are closer to their users.

    The 2021 State of Application Strategy reported that just over three-quarters of respondents are already using or have plans to use the edge to capture benefits related to application deployment, performance and data availability.

    “This is really important, because as an application developer, I want to deploy my application once and I want to say, ‘I want this distributed to all of these places around the globe’,” van Kalken said.

    But if the application is deployed in, say, five locations, then from a telemetry perspective, it is five applications, not one.

    “I’ve got five sets of telemetry, because I’ve effectively got five different applications deployed out there. It’s the same app, but it’s in five locations, and the consumers are different in every location; the way that they interact is different and the telemetry that I’m getting is going to be different,” he said. “So, I need to actually suck up all of that telemetry, and make it meaningful in some way,” he explained.

    Telemetry Enables Clearer Vision

    “A distributed cloud architecture is right for these modern applications. We recently bought a company called Volterra, and this is one of the areas that they play in — distributed applications, and specifically, abstracting multi-cloud and multi-cluster Kubernetes application deployments,” he said. This area of focus will be critical in the future, van Kalken said.

    He predicts that as organizations move to 5G, applications will become increasingly distributed. If that does happen, it will be extremely important to receive telemetry from all components of the application so it can be analyzed and used to support intelligent decisions, as part of the distributed application deployment.

  • OpsRamp Extends AIOps Reach to Embrace Prometheus

    OpsRamp Extends AIOps Reach to Embrace Prometheus

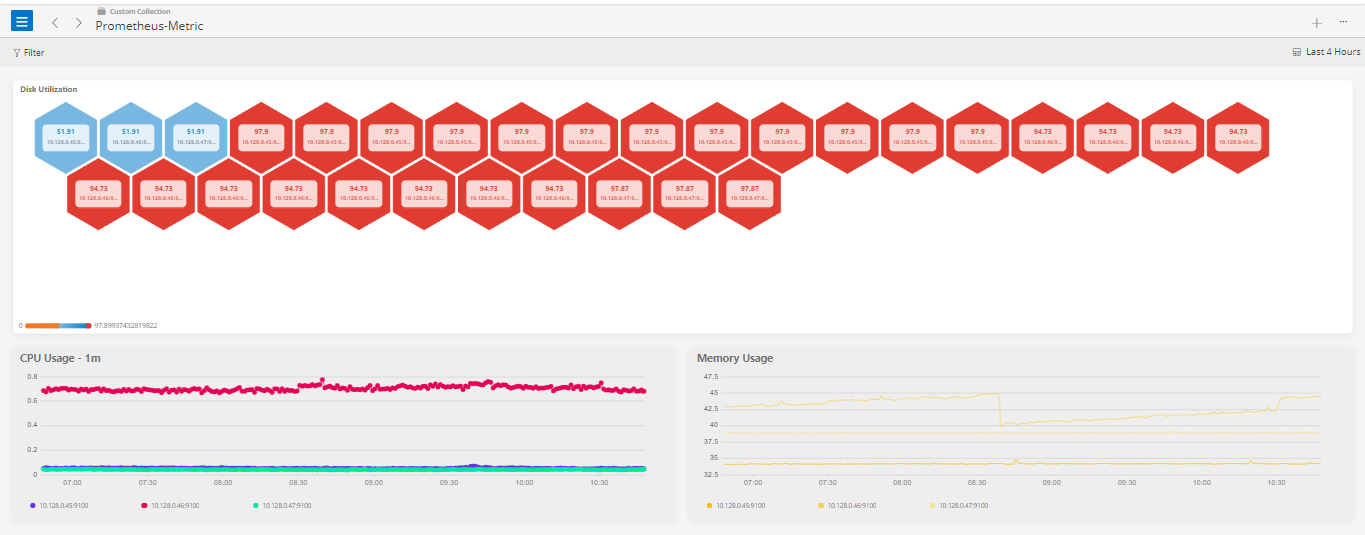
    OpsRamp today announced it has added the ability to ingest data captured via the open source Prometheus monitoring software into its namesake IT operations platform infused with machine learning algorithms.

    In addition, the company is adding support for customizable dashboards using the Prometheus Query Language to create visualizations of hybrid infrastructure performance. Also, a set of available tools makes it easier for IT teams to discover when workloads have been added to a cloud. These capabilities became available with the Spring 2021 Release of OpsRamp’s IT operations platform infused with artificial intelligence (AIOps).

    Finally, OpsRamp has also created an alert definition model that streamlines the alerts generated by the AIOps platform and its integrations for the Microsoft Azure cloud and the Cisco HyperFlex platform deployed in on-premises IT environments.

    Deepak Jannu, senior director of product marketing for OpsRamp, said that as IT becomes more complex to manage, many IT teams are starting to realize that managing these environments without help from an AIOps platform won’t be possible. As such, much of the fear and loathing that was initially associated with AIOps is giving way to acceptance as IT teams start to realize these platforms augment their capabilities versus replace them, added Jannu.

    Much of the complexity is being driven by the rise of cloud-native, microservices-based applications that tend to have lots of dependencies. OpsRamp has primarily been encountering Prometheus in these environments. However, Prometheus can also collect data from legacy applications, as well, so over time, the expectation is the open source monitoring tool will be employed more widely.

    As AIOps platforms become more widely employed, there is no doubt job roles within IT organizations will change. As lower-level tasks become automated, IT teams should have more time to spend resolving complex issues once the AIOps platform has identified a baseline for how applications should optimally behave. In many cases, the need for personnel to perform rote tasks that no one in IT wants to actually do will be eliminated altogether.

    DevOps teams that are committed to automating IT tasks will naturally be among the first to employ an AIOps platform to augment the capabilities of site reliability engineers (SREs) that are often challenging to hire and retain.

    In general, Jannu noted that the observability that many IT organizations now demand can’t be achieved by simply collecting more metrics. IT organizations will need to invest in an AIOps platform capable of making sense of all the instrumentation data being collected. The challenge now will be defining the right division of labor between man and machine in an IT environment, Jannu added.

    At this juncture, AIOps, to one degree or another, is inevitable. In many cases, machine learning algorithms are already being employed to optimize applications or a specific class of hardware. The decision IT teams will ultimately need to make is determining whether to replace their existing IT operations platform or wait for the provider of their existing platform to get around to adding AI capabilities.

  • Tricentis Aquires Neotys to Gain Load Testing Tools

    Tricentis Aquires Neotys to Gain Load Testing Tools

    Tricentis announced today it has acquired Neotys as part of an effort to expand the scope of its tools portfolio into the realm of load testing. Terms of the deal were not disclosed.

    Neotys provides application testing teams with automatic test design and maintenance, user behavior simulation and root cause analysis capabilities using a set of tools that are designed to be integrated within a DevOps toolchain.

    Sandeep Johri, Tricentis CEO, said the Neotys platform will extend the scope of Tricentis’ Tosca testing platform that today enables DevOps teams to employ machine learning algorithms to test the functions within an application.

    In general, Johri said there’s now a lot more focus on load testing, thanks in part to the rise of microservices-based applications that are starting to be deployed at scale. DevOps teams are, first, trying to identify, as early as possible, a single point of failure that might bring down an application. Second, modern microservices-based applications are designed to degrade gracefully when there is no single point of failure. Identifying what issues are leading to that degradation can be challenging, given all the dependencies that might exist within a microservices-based application.

    Neotys claims to have more than 600 enterprise customers, including BNP Paribas, Dell, Lufthansa, McKesson and Verizon. Tricentis claims to have more than 1,800 customers, including McKesson, Accenture, Nationwide Insurance, Allianz, Telstra, Rockwell Automation, Moët Hennessy-Louis Vuitton (LVMH PCIS) and Vodafone. The acquisition of Neotys will reduce the number of vendors that an organization needs to engage to gain access to a portfolio of testing tools, Johri noted.

    As IT organizations embrace DevOps best practices, more responsibility for application testing is clearly shifting left toward developers. However, it’s not quite clear to what degree that shift is either eliminating or reducing the need for dedicated application testing teams at the back end of the application development process.

    At the same time, many rote testing tasks are now being automated using machine learning algorithms. Those algorithms don’t completely eliminate the need for humans to test applications, but they do significantly reduce the testing time required. They should also create more time for developers to collaborate with one another to review more complex interactions within an application that machine learning algorithms are unlikely to be able to automate any time soon.

    The amount of time organizations devote to application testing has always been constrained. As deployment deadlines approach, often the first thing that gets reduced is the amount of time allocated to application testing. In many cases, developers deliberately don’t address some known issues until the first or second update to an application that has already been deployed in a production environment.

    Of course, integrating application testing within a DevOps process enables organizations to identify more potential issues earlier when they are easier and less expensive to fix. The challenge has always been getting developers to appreciate the value of testing early and often in the application development process.

    Regardless of how application testing continues to evolve in the age of DevOps the one thing that is certain is no matter how automated it gets developers are going to be more involved than ever.

  • SolarWinds Unveils Revamped APM Platform

    SolarWinds Unveils Revamped APM Platform

    SolarWinds is unifying its various application performance management (APM) tools within a single suite accessed via a software-as-a-service (SaaS) platform.

    Denny LeCompte, senior vice president for products at SolarWinds, said the APM Integrated Experience offering combines the company’s AppOptics, Loggly and Pingdom tools to collect metrics, traces and logs along with real user monitoring capabilities and tools to simulate application traffic.

    APM Integrated Experience also provides access to a landing page that identifies what has changed in an IT environment over the previous week and highlights which of those changes might become an issue. As most IT professionals well understand, most IT issues can be traced directly back to a recent change made to an IT environment that was previously running as intended.

    Other capabilities include advanced search tools and the ability to inspect lists and maps for hosts, containers and plugins for web servers and databases. In addition, APM Integrated Experience is integrated with both Amazon Web Services (AWS) and the Microsoft Azure cloud.

    LeCompte said the goal is to make it less expensive for the average IT organization to broadly instrument applications using an agent developed by SolarWinds that can automatically be installed.

    Ultimately, the goal is to enable organizations to better manage their software supply chains, LeCompte added. Of course, SolarWinds is at the heart of the software supply chain breach that involved its Orion network management software. That software runs on-premises. In comparison, APM Integrated Experience is a SaaS platform that is more secure. In fact, LeCompte said, IT professionals that manage software supply chains are generally sympathetic to the challenge the company currently faces. Most of those organizations have dealt with similar software supply chain issues, albeit on a smaller scale, LeCompte added.

    In general, LeCompte said it’s apparent most organizations need access to an APM platform that costs substantially less than rival platforms and still delivers 90% of the capabilities they require. In many cases, IT organizations are paying for extra capabilities that only very high-end enterprises require, LeCompte noted. In fact, one of the primary reasons APM platforms are not as widely employed is most organizations have found rival APM platforms simply too expensive to deploy, said LeCompte.

    LeCompte declined to speculate whether there is a meaningful difference between what has been historically known as monitoring and so-called observability platforms that have emerged in recent months. Regardless of approach, however, it’s clear as distributed IT environments become more diverse and complex, the number of organizations that need more visibility into their application environment is steadily increasing, said LeCompte.

    Of course, with the rise of microservices-based applications, that level of IT complexity is only going to increase. As applications grow and expand, the number of dependencies between microservices starts to increase. Understanding how an issue with one microservice is impacting a distributed computing environment will undoubtedly require more instrumentation. The challenge, going forward, will be determining how best to achieve that goal at a reasonable cost.