Tag: apm

  • Synthetic Monitoring: The Start of the Monitoring Journey

    Synthetic Monitoring: The Start of the Monitoring Journey

    Under pressure to innovate and deliver rapid updates to their applications, developers often place monitoring as an after-thought. In today’s world, where a slowdown can translate to customer attrition and an outage can lead to millions of dollars in losses and negative press, ensuring satisfactory response time has evolved to be one of the most critical needs in the early stages of development and is a common goal to ensure DevOps success.

    The Shift-Left of Monitoring: To study emerging patterns of how and when DevOps teams start monitoring, we interviewed several DevOps squads. Almost unanimously the responses were:

    1. They care most about knowing, Is the application up and loading quickly? Are all critical user interactions with the application responding within acceptable standards?
    2. They would like to get this information proactively throughout the development life cycle so they can determine if any code check-in impacted the performance/
    3. They would like to monitor with minimum setup and configuration and don’t have the time to learn complex tools/

    To satisfy these needs, synthetic monitoring becomes the starting point for monitoring.

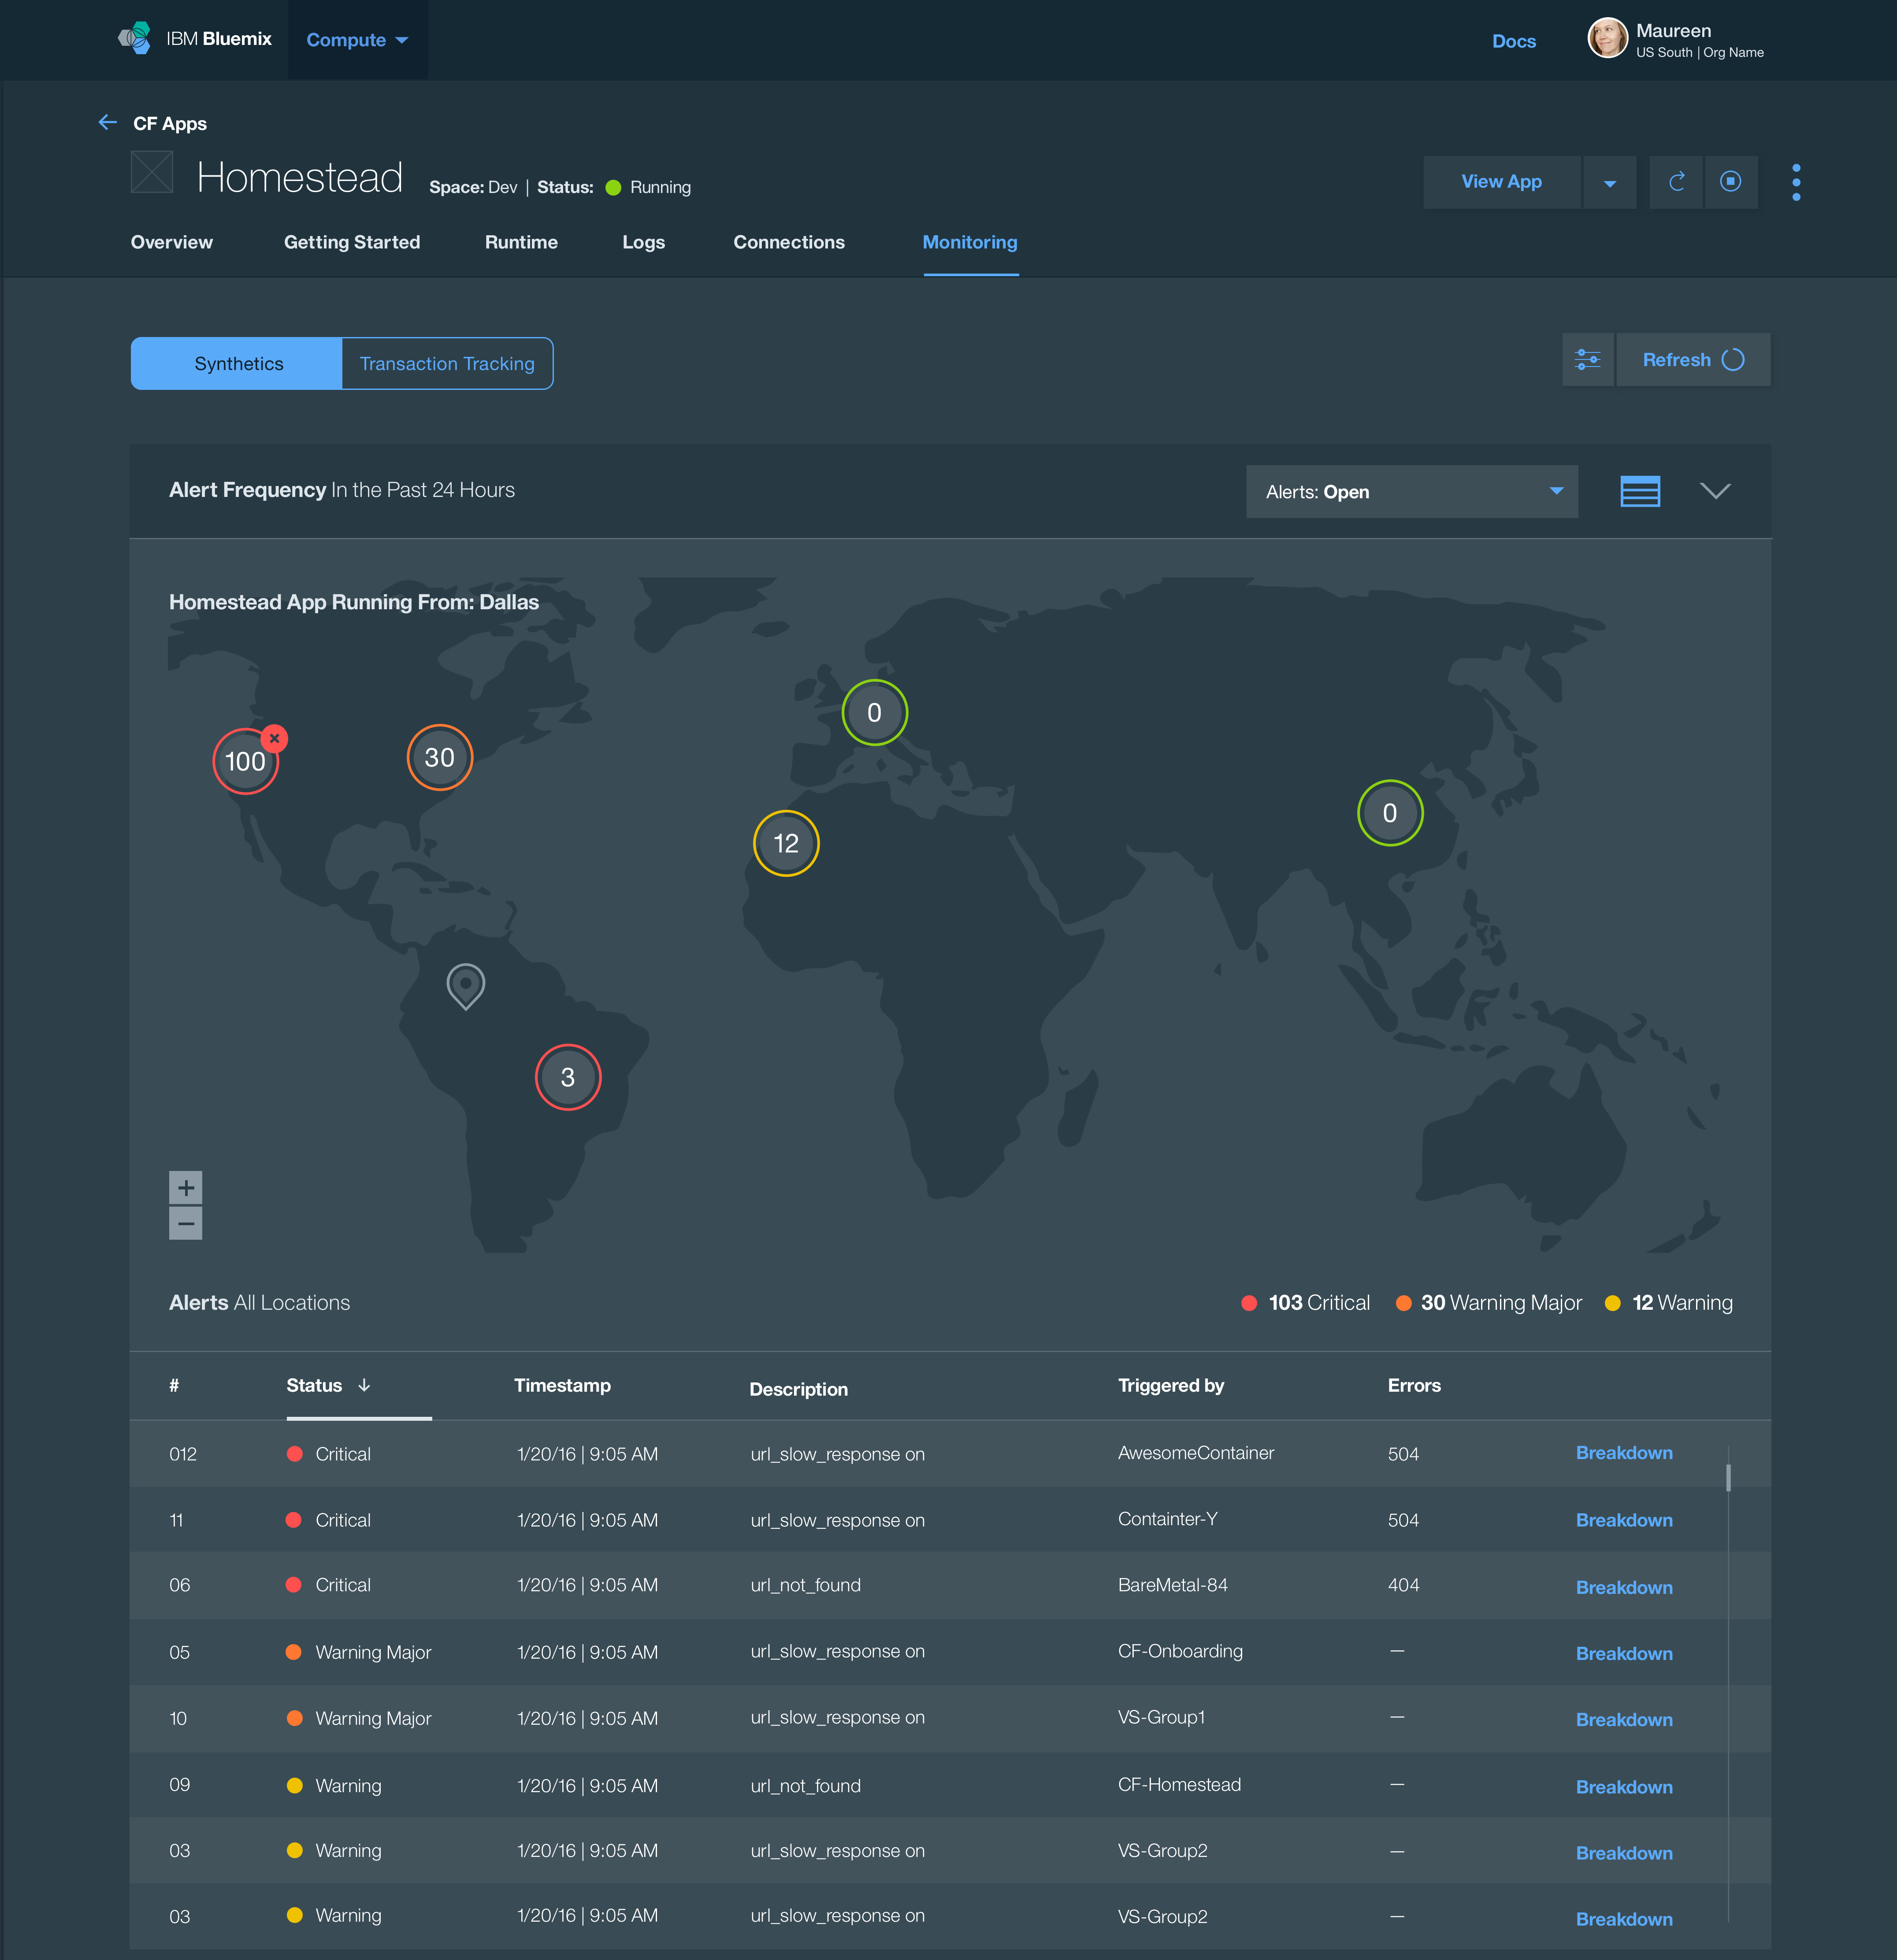
    With synthetic monitoring, DevOps teams can simulate user behavior and proactively detect performance problems from around the world and around the clock, before they impact their users. They can maximize uptime and ensure good response by pinging the application URLs and APIs and running simulations to check if the most common paths traversed by users are responding fine.

    Some of the key capabilities of synthetic monitoring that are important to DevOps squads:
    syntheric-pic

    • Reports availability, response time and user satisfaction score (such as Apdex) for all web pages, URLs and critical user interactions from around the world, 24X7
      • Runs synthetic tests as often as once per minute or even less than that, to test:
        • Webpage loads
        • REST API calls
      • Runs simulated user interactions through scripts once every few minutes
    • Requires minimum setup and maintenance with preferably a SaaS solution with globally hosted probes. Private probes are required for monitoring internal applications.
    • Incorporated into the DevOps life cycle as part of the delivery pipeline such that synthetic tests can be run in dev/test, staging and then in production.
    • Provides granular controls on what tests to run, how often, from where and what to validate in the HTTP response code.
    • Easy-to-use scripting tools that do not have a learning curve and preferably open-source. Often, automated regression test scripts used in development can be reused to run synthetic simulations in production.
    • Alerts users of issues through not only their preferred channel of notification, such as email or SMS but also through their primary collaboration channel.
    • Provides relevant alerts and avoids alert noise by appropriate alert filtering and retries on failure.
    • Identifies whether an issue was caused by an application deployment or change by presenting an auto-correlated view of alerts, metrics and deployment activities.
    • Isolate quickly whether the problem is in the application code or one of its dependencies such as a network latency issue or a third-party service slow down.
    • Diagnoses the exact step of failure by providing waterfall analysis of all page assets, pinpointing slow requests, broken links, large images, slow external API calls and more.
    • Accelerates diagnosis with an automated browser screenshot of the failure.
    • Compares two versions of applications to enable A/B testing.
    • Provides daily, weekly and monthly scores and reports to ensure that target SLAs for uptime and user satisfaction are being met.

    Stay tuned for the next blog on DevOps and log analytics in this five-part blog series and don’t forget to register for an upcoming interactive webcast, “Learn Why We Must Shift APM Left in the DevOps Lifecycle.”

    About the Author / Payal Chakravarty

    payal-chakravartyPayal Chakravarty is offering leader for the Application Performance Management portfolio at IBM. She has nine years of experience in enterprise technology in various roles including product management, strategy, DevOps and engineering management and software development. She defined and delivered software as a service (SaaS) and on-premises software for Application Performance Management, Hybrid Cloud Monitoring, Data Center Management, and Operational Analytics. Payal has an MBA from Duke University and a MS in Computer Science from North Carolina State University. You can find her on Twitter, where she tweets about all things DevOps and cloud. Connect with Payal on LinkedIn / Twitter

  • Continuous Monitoring: The Role of DevOps and APM

    Continuous Monitoring: The Role of DevOps and APM

    To enable faster and better response to changing customer needs, enterprises are increasing their release frequency for applications. This, in turn, demands tighter alignment and collaboration than traditionally has been seen between the line of business, development and IT operations, driving the need for enhanced collaboration, automation and information transparency among these groups. To achieve seamless internal collaboration, many enterprise customers are adopting a DevOps approach.

    DevOps is an enterprise capability that enables the continuous delivery and continuous deployment of software. It reduces the time needed to address customer feedback. DevOps brings once-siloed Dev and Ops together to improve agility and achieve these benefits:

    • Improves collaboration between developers and operations specialists by using shared DevOps tools.
    • Facilitates continuous delivery of software by enabling collaborative testing throughout the development and release processes.
    • Automates the manual processes of release management, infrastructure provisioning, orchestration, monitoring, containerization and virtualization.
    • Corrects misalignments of people and goals by building closer links between developers and operations.
    • Incorporates customer feedback in the development process to facilitate agile development.

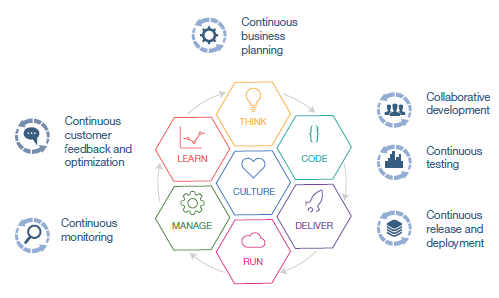
    IBM has identified six phases in the DevOps life cycle, plus necessary cultural considerations, for successful implementation of a DevOps approach (Fig 1).

    pic

    Fig. 1 – Six phases of the DevOps life cycle

    In the Manage phase of the DevOps life cycle, continuous monitoring of applications in production environments is typically implemented with application performance management (APM) solutions that intelligently monitor, analyze and manage cloud, on-premise and hybrid applications and IT infrastructure. These APM solutions enable you to monitor your users’ experience and improve the stability of your application infrastructure. It helps identify the root cause of issues quickly to proactively prevent outages and keep users satisfied.

    With a DevOps approach, we are also seeing more customers broaden the scope of continuous monitoring into the staging, testing and even development environments. This is possible because development and test teams that are following a DevOps approach are striving to use production-like environments for testing as much as possible. By running APM solutions earlier in the life cycle, development teams get feedback in advance of how applications will eventually perform in production and can take corrective action much earlier. In addition, operations teams that now are advising the development teams get advance knowledge and experience to better prepare and tune the production environment, resulting in far more stable releases into production.

    Applications are more business critical than ever. They must be always up, always fast and always improving. Embracing a DevOps approach will allow you to reduce your cycle times to hours instead of months, but you have to keep ensuring a great user experience! Continuous monitoring of your entire DevOps life cycle will ensure development and operations teams collaborate to optimize the user experience every step of the way, leaving more time for your next big innovation.

    This continuous monitoring blog is the first in a series that focuses on collaboration between development and operations teams. We will explore this topic in detail in upcoming blogs:

    • Synthetic Monitoring: Developers, testers and operations staff all need to ensure that their internet and intranet mobile applications and web applications are tested and operate successfully from different points of presence around the world.
    • Alert Management: Developers, testers and operations staff all need to send notifications via email, voice mail, text, mobile push notifications and Slack messages when specific situations or events occur in development, testing or production environments, to get the right people’s attention and to manage their response.
    • Deployment Automation: Developers, testers and operations staff use different tools to schedule and deploy complex applications and configure them in development, testing and production environments. We will discuss the best practices for these teams to collaborate effectively and efficiently and avoid potential duplication and erroneous information.
    • Analytics: Developers need to be able to look for patterns in log messages to identify if there is a problem in the code. Operations need to do root cause analysis across multiple log files to identify the source of the problem in complex application and systems.

    Stay tuned for the next blog on synthetic monitoring in the series and register for an upcoming interactive webcast, “Learn Why We Must Shift APM Left in the DevOps Lifecycle.”

    About the Author / Arun Biligiri

    Arun Biligiri

    Arun Biligiri is the leader of the Application Performance Management Offering Management team at IBM. Arun has over 20 years of experience in technology in various different roles including entrepreneurial, development, product management and sales engineering. He has worked closely with innovative enterprises and has extensive experience in addressing cloud, analytics needs in efficiently managing their data centers and clouds. He has an MBA from the Wharton School, and MS from the University of California, Berkeley. Connect with Arun on Twitter / LinkedIn

  • DevOps Matchmaking: APM + CI = A Perfect Marriage

    DevOps Matchmaking: APM + CI = A Perfect Marriage

    As anyone who has ever been set up on blind dates by friends can attest, finding the right match in today’s world is a tricky feat.

    There’s a lot of evidence suggesting that the frantic pace of life makes such matchmaking more difficult than ever. That said, when the right set of complimentary traits exist and there’s a willingness to find common ground, things can work out.

    Spike Jonzian-notions of artificial intelligence aside, certain technological partnerships are increasingly being perceived as “a perfect marriage” within the context of DevOps automation.

    Register today for the upcoming webcast: “Using APM to Turbocharge Continuous Integration”

    These technological matrimonies closely support the underlying tenets of DevOps methodology—collaboration, experimentation and increased velocity. In fact, it’s easy to wonder why no one ever conjoined them before. But we were using traditional waterfall development and operations and so couldn’t conceive of such a thing. On the other hand, emerging availability of tooling supporting new integrated workflows represents a significant catalyst.

    Finding the Perfect Fit

    One such DevOps confederation getting a lot of attention is the matchmaking of continuous integration (CI) and application performance management (APM) technologies. Tying together these once-disparate systems makes a lot of sense, despite the fact that few tools would seemingly appeal to more (traditionally) polarized constituencies.

    Continuous integration has been a staple of the development community for many years. It emerged as teams evolved the practice of long build times into more frequent check-ins to deliver code and look for potential errors more quickly. Today, with the rise of CI tools such as the Cloudbees Jenkins platform, some development teams are touting tens of thousands of builds per day.

    On the other end of the spectrum, squarely on the turf of IT operations, APM has been evolving rapidly over the past few years as organizations have sought to improve use experience and applications reliability via dedicated monitoring. Enabling this ability to identify and address emerging issues has resulted in APM becoming the fastest-growing segment in the IT ops management market, according to Gartner.

    DevOps matchmaking factors in when you bring these tools together to create an automated workflow that spans their respective use cases. A cross-functional team can leverage APM-level monitoring and KPIs within the domain of CI and testing to identify potential performance obstacles introduced in new code. Doing so then rather than waiting to respond later in the applications life cycle benefits everyone.

    Reaping the Benefits

    For example, say an e-commerce applications developer has implemented a new inventory search functionality—something considered a key differentiator by business management. The developer knows this feature could rely heavily on some back-end database system and wants to ensure it’s tested properly, even as the code is being introduced.

    Integrating APM and CI allows the entire team to monitor the process and test various conditions related to the update, tracking multiple builds and looking out for related performance issues. Such integration also allows for centralized tracking of other key attributes such as build number, status and build date, to further ease management.

    Most importantly, by tying these two critical aspects of the applications delivery life cycle together, the collaboration and feedback loops required to truly embrace DevOps methodology become ever more valuable as these core Dev and Ops functions become intrinsically linked.

    If this type of DevOps advancement gets your heart pumping, you’re not alone. Later this month, we’ll host a webcast here on devopsy.kinsta.cloud featuring experts from CA Technologies and Cloudbees. They’ll be discussing the benefits of matchmaking with APM + CI integration. They’ll also detail real-world benefits organizations leveraging integration of our respective technologies (CA APM and Cloudbees Jenkins) enjoy.

    We obviously feel that this is a DevOps tooling marriage that will mature, change and stand the test of time. We’d love to garner your questions and feedback on the topic.

    Which is all good, because thankfully there’s no such thing as Tinder for DevOps … yet.

  • Application Monitoring in the Age of Big Data

    Application Monitoring in the Age of Big Data

    Operations (or ops, as it is known colloquially) has been necessary since the first shared systems came online in the ’60s. While the job title didn’t necessarily exist, the same questions needed answers then as they do now:

    • Is it up and accessible?
    • Is it responding in a reasonable time frame?
    • Is it performing better or worse now than previously?

    In a simple system, say a static web site, these questions are answered easily by requesting the page. In an automated fashion, of course.

    However, when you look at any “late model” technical infrastructure, you’ll find many, many moving parts. These range from border routers to web servers, work queues to databases and data caches to big data clusters. There are thousands upon thousands of computing instances, software processes, network storage devices and network links that can go down, up or just plain wonky. This means potentially millions of places where things can go wrong.

    How do you keep an eye on all of these potential issues? How do you know if they’re responsive? How do you know if things are getting better or worse?

    Some Monitoring Progress

    The “old” method was to write some sort of monitoring script that polled some data that you thought would represent the overall health of that component. Through the years things have gotten more granular. Our monitoring script libraries have grown and we’ve even instrumented our applications with counters (statsd, librato, etc.) and come up with big data storage (opentsdb) to house all of these data points.

    The question remains, Do we have any more clarity than before? We unarguably have more data points. So we must know more about the performance of our systems, right?

    Turns out, in practice, we just have a lot of data and a lot of people attempting to decipher what that data means. If you’ve worked in operations you’ve been up at 2 a.m. looking at status dashboards with green, yellow and red icons and many, many graphs, all in an effort to answer the question: What is going on?

    Sure, some incidents are easy: An instance was retired, or a fiber line was cut somewhere in Kansas.

    I’m talking about the ones that aren’t so clear cut, so to speak:

    • Site feels slow
    • Median response times are up 25 percent from yesterday
    • Usage is down week over week compared to some relevant time frame

    How do you answer those questions in a haystack of data points, up/down status and, in some cases, just plain noise? Application performance managers (APMs) came along and gave us tooling in the app frameworks and the browser. Now we have visibility into which calls are performing poorly and how our app “feels” to the end user.

    This has helped by breaking down the haystack into smaller haystacks and provided a way to search and sort potential performance issues. However, most APM tools depend on instrumenting code such as Java, .Net or Ruby, and are not able to provide monitoring insights for the rapidly growing open source frameworks such as Grails, Akka, Netflix OSS and the like. We’re still left with the haystack problem: What is going on?

    When I’m up at 2 a.m., stumbling over to the computer to find out what issue PagerDuty has alerted me to, I don’t really want to pore through page after page of graphs and up/down status. What would be really helpful is a system that can aggregate all those monitoring data flows and statuses, actually apply some intelligence. Then it could tell me, “Look at this response time of this component, and this metric is reporting something anomalous. This is most likely causing your issue right now.”

    In other words, it would be helpful to have a system that can show both the symptoms and the root cause of the issue. That system also would provide high-quality, high-value information about my infrastructure and combine anomaly detection with root cause analysis to provide real root cause detection.

    One new startup, OpsClarity, is hoping to make troubleshooting more accurate and efficient by combining data science and anomaly detection with root cause analysis.

    Perhaps this is the long overdue beginning of the next age in monitoring.


    About the Author/Michael Hobbs

    Michael Hobbs HeadshotMichael Hobbs is the director of Technical Operations at Expa, a startup studio based in San Francisco. Significant experience in building, operating and automating highly scalable application infrastructures has allowed him to contribute to the success of Infusionsoft and Stumbleupon, among others. Michael continues to put that expertise to work at Expa by advising and assisting the next generation of Internet companies. Michael is also a significant contributor to many open source projects, including dokku and herokuish.
     

  • The Role of APM in Continuous Integration and Continuous Release

    Today’s software-defined and -driven business requires fast changes in business models—a phenomenon permeating successful businesses. What this means is almost every company is learning how to make small, rapid changes and adjustments within their business, especially within software systems. As a result, IT is feeling immense pressure to evolve, and the net result is a major uptick in private cloud environments (especially Apprenda, Pivotal Cloud Foundry and Red Hat OpenShift) and public clouds (especially Amazon and Microsoft) within our install base of large enterprises. These new platforms enable faster development, testing and releasing of software.

    Enterprise customers are getting much smarter by using automation to drive the software life cycle, including continuous integration, and even experimenting with and using continuous release processes. This is no longer a startup scenario; it’s a strategy for our large, enterprise customers. These companies are trying to build agile development and operations teams by changing people, process and technology to enable a DevOps feedback loop:
    image02

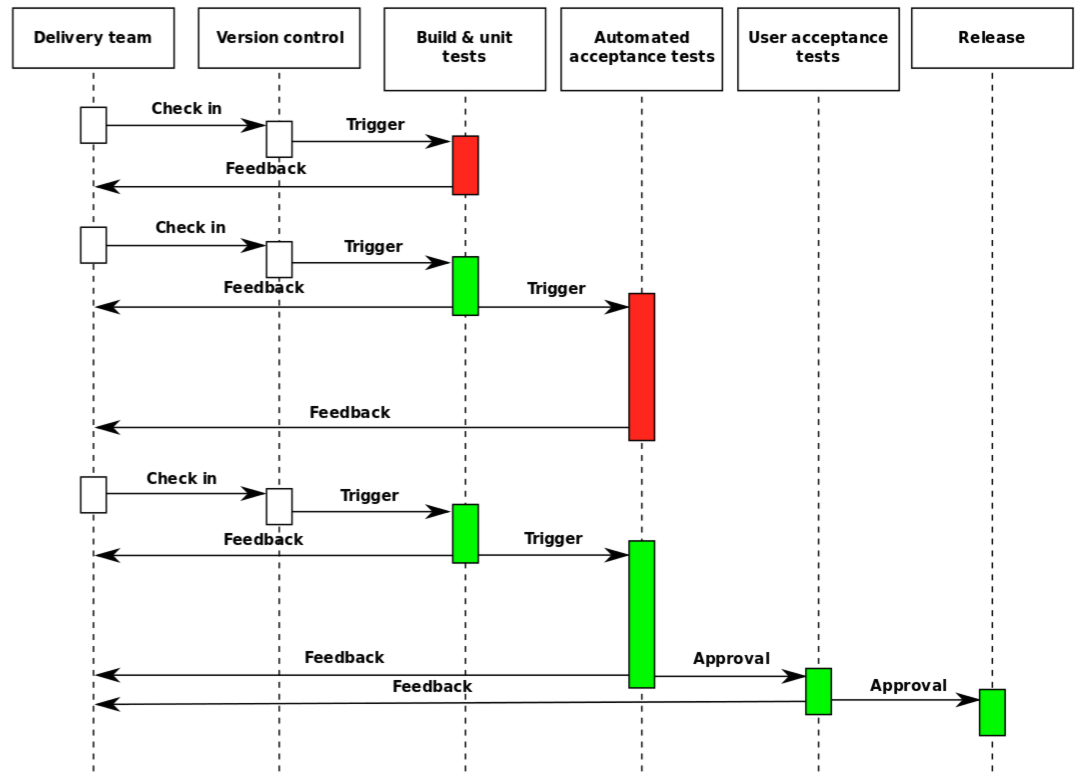
    Wikipedia describes the continuous delivery loop as follows:

    DeliveryLoop

    Within this loop, application performance management (APM) can be part of build, unit, regression and load tests to drive the automated acceptance testing before new code is pushed to production. In fact, at the recent AppSphere 2015 user conference we had several great talks on this subject.

    The first talk was presented by our customer The Container Store‘s  August Azzarello, who discussed, “How The Container Store uses AppDynamics in the Development Lifecycle.” The company began with APM in production, in an effort to improve software quality before production. It began the expansion by installing APM within test, integrating it into functional and performance test suites. It also enabled alerting from dev/test so that developers and testers both understood when there were performance deviations and issues before production.

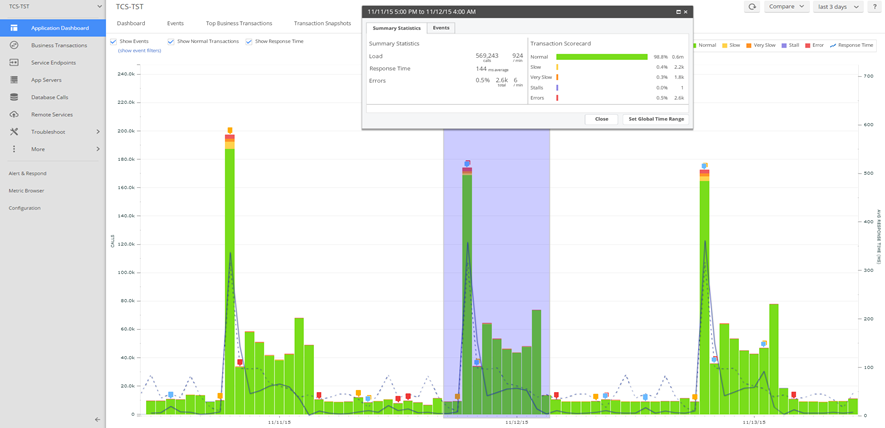
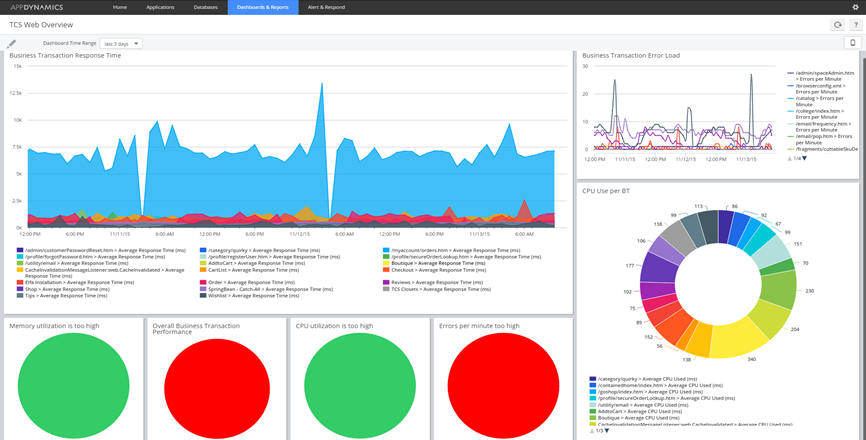
    Key features the company leveraged in pre-production included dashboards such as this one:image03

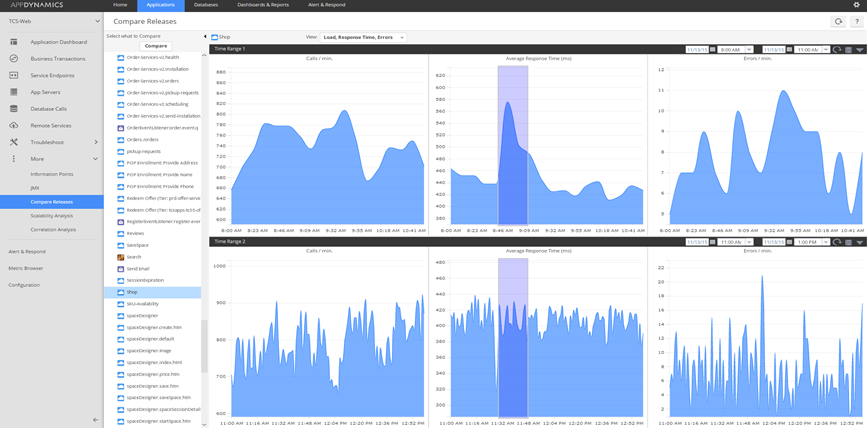
    Comparative analysis views such as this one:

    image04

    And being able to understand between releases if they were improving or degrading:

    image00

    The Container Store is using open source tools including Selenium for functional testing and Locust.io for performance testing.

    During his discussion, August also explained some of the major benefits the company saw from implementing APM in pre-production. Here are some best practices outlined by August in his discussion:

    • Monitor everything
    • Test continuously
    • Performance test early in development life cycle
    • Empower development & QA team members

    Some benefits The Container Store has seen, according to August, are:

    • Set performance expectations before production deployments – about 40 percent improvement since it started using AppDynamics in test
    • Fine-tune alert and business transaction policies prior to production deployments
    • Identify testing requirements and testing gaps
    • Decrease performance test result reporting to 20 minutes from five hours

    One of my favorite talks (which is why I selected it for the deep dive track at AppSphere) was the talk given by one of our senior sales engineers Steve Sturtevant, who came to AppDynamics from PayPal two years ago. In his talk, titled, “DevOps and Agile: AppDynamics in Continuous Integration Environments,” he explained the integration work he did. He also delved into the questions, Can you scale and auto implement monitoring in dynamic environments? Do you quantify the impact of change? Steve also offered a demo with integration between Puppet, Jenkins, ServiceNow and AppDynamics in his examples, with automation throughout the life cycle.

    One of our partners Electric Cloud specializes in continuous delivery and embraces an open ecosystem of technology providers and open source software. It has put together some great resources for people looking to explore the rest of the feedback loop:

  • Avik Partner’s Grok APM Uses Machine Learning to Find Anomalies Early On

    Avik Partner’s Grok APM Uses Machine Learning to Find Anomalies Early On

    Machine Intelligence-Driven Anomaly Detection

    Machine learning—the science of getting computers to take thoughtful action without explicit programming—is the basis of Machine Intelligence-Driven Anomaly Detection, which is the core capability in Avik Partner’s Grok APM product, according to Casey Kindiger, veteran enterprise software solutions provider, IT automation expert, and founder of Avik Partners.

    “Thoughtful action means using the type of faculties that a human being would use to make a decision and to take an action,” says Kindiger, who has more than a decade of experience in designing and developing process automation solutions for companies such as JP Morgan Chase, T-Mobile, and Allstate Insurance. Grok learns from your dev and ops environments and takes thoughtful action to detect anomalies, all in the service of Application Performance Management.

    Grok works by analyzing real-time performance data from apps and infrastructure, looking for behavioral bumps in an otherwise smoothly-paved DevOps highway of deployed services and underlying infrastructure.

    Grok’s Pre-Event Inferences

    “Grok uses common statistical techniques to learn a pattern over a selected period of time in order to build a dynamic threshold of the continuously changing underlying patterns,” says Kindiger. In this way, Grok can establish a sort of dynamic baseline from very noisy patterns, which is something that would typically take a number of person hours of involved statistical and predictive analytics to accomplish.

    Grok’s machine intelligence leverages the ability to make inferences based on this dynamic baseline information like a human being would in order to reason out a logical conclusion. Grok does this to detect the slightest of anomalies based on the difference between what reasonably should have happened and what actually did happen. Using this approach, Grok detects subtle patterns of significance in streaming data despite the fact that the data has patterns that are continuously in flux.

    But rather than detect when something has gone wrong at a point in time, which is not scalable or sustainable, Grok looks for minute patterns that appear well in advance of any issue that you would normally consider looking at with traditional APM mechanisms, explains Kindiger. Rather than send alerts based on threshold-based exceptions, Grok makes a prediction on what the next data point or the next series of data points will be and then looks at deviations from those predictions, considering whether to flag those as anomalies, according to Kindiger.

    Currently, Grok is particularly tuned to analyze streaming data and is, according to Kindiger, data-point agnostic. “We don’t need to teach the system what the context of a particular data point is. The system learns the context of the data over time and the subtle nuances of the pattern that produces over time, and creates the model based on that,” says Kindiger.

    Watch Out for That Initial Two Week Delay

    If Grok does everything that Avik Partners’ Kindiger hypes that it will, DevOps teams will soon be able to catch and act on infrastructure issues before they grow big enough for end-users to notice.

    But Grok does have one wrinkle in its APM armor: it takes time for it to really learn a new customer system and get good at detection. Let’s assume that Grok’s machine learning causes it to get better at detecting anomalies in a given set of infrastructure over time. That means that there’s a point, at the beginning, given a brand new customer when Grok only starts to learn. At that point, Grok isn’t very good at knowing what’s anomalous compared to what’s normal for that infrastructure because Grok has no foundation for that particular system.

    “Grok will take some time to learn the nuances of when to escalate an issue. We’ve learned from experimentation that it gets pretty good after ingesting two weeks’ worth of data,” says Kindiger. Because Avik Partners initially targeted AWS, it has taken two weeks of CloudWatch data and fed that to Grok to provide it with some backdrop so that when Grok goes live, it won’t be learning this environment entirely anew.

  • APM Prepares Prep Sportswear for Promising Growth

    APM Prepares Prep Sportswear for Promising Growth

    Prep Sportswear kicked off in 2003 and appeared either in the Inc. 500 or Inc. 5000 list of fastest-growing private U.S. companies six years in a row, from 2009- 2014, according to online data from Inc. Magazine. The custom sportswear vendor has achieved 130-percent growth over the past three years, says Mike Jones, Director of Technology, Prep Sportswear.

    Prep Sportswear clothes more than 200K US schools including most middle schools and high schools with custom-printed sportswear for their school sports teams. Prep Sportswear maintains a catalog of each school’s logos so that teams can create their own shirt or jersey representing that institution and team using its colors and logo or mascot. “So you can create a jersey and for me it would be for the class of 1986, Lake Washington High School, and you would see that Kangaroo on the back or on the front,” says Jones.

    The custom-printed sportswear firm serves local teams not affiliated with schools as well as golf courses, colleges, and religious groups. Each customer gets its own store, and Prep Sportswear now maintains more than 2M stores.

    Prep Sportswear: Small Team, Big Technology Play

    Prep Sportswear produces its own sports goods and maintains manufacturing and attendant technologies while also serving ties to firms such as Active Network and others that use its API.

    “We support retail customers, consumers, and our own plants and equipment. On the technology side, we do that with a very small team of ten people. They cover the e-commerce site, our API, and manufacturing needs,” says Jones.

    Prep Sportswear programs its codebase and platform using C# and .NET. It also provides for manufacturing components such as ink and vinyl printers and embroidery hardware. Prep Sportswear manages its supply-chain and its related processes and mechanics. “We do it all in-house despite the fact that it is such a large system with a number of components,” says Jones.

    How Prep Propped Up DevOps

    When Michael Jones arrived at the company, the CTO was deploying releases directly to production from his laptop. “We didn’t have a DevOps team really until Richard came on board,” says Jones, speaking of his colleague Richard Dominguez, Developer in Operations, Prep Sportswear; “before that we were running in start-up mode, just kind of out of a garage until recently.” Richard describes the technical setting when he came on board.

    “A lot of the automation they had was not really automation but little scripts that they ran individually,” says Richard Dominguez, Developer in Operations, Prep Sportswear; “when we released something, we had no idea whether it would break.” At the time, there were few tests on software and there were no external tests at all.

    The Arrival of Change

    With Richard at hand, Prep Sportswear ultimately adopted TeamCity for CI for deploying to its test and production development stages.

    The company also added the Selenium browser-based test suite, coded in Java to run the user-based interactions to determine what the user experience is like. “It checks to see that the page and elements load properly when a user clicks a link,” explains Dominguez.

    Richard found Dynatrace installed when he arrived but not in use. He revived it as the main APM for front-end monitoring. “We also use another tool a lot for our internal monitoring of infrastructure on the back-end and that tool is PRTG,” says Dominguez.

    DevOps Done Right Brings Cheers from the Sidelines

    The combined revenue from all channels last year was about $23M, says Jones. “Since Richard came on, we’ve seen a decrease in time to resolution of more than 50-percent just by having the APM and other tools,” says Jones, with reference to Richard’s revival of Dynatrace and addition of the other aforementioned tools.

    Up times have improved by .50-percent as well. “That stems from simply being able to find an issue and resolve it faster. For an e-commerce site where we don’t have any sales people, it’s just the website, that additional up time is very important to us,” says Jones.

  • Where will DevOps be in 10 years’ time?

    Where will DevOps be in 10 years’ time?

    What will the DevOps landscape look like in 10 years’ time? Ten years ago, Agile was seen as new and different. Now it’s part of everyday life of most developers. Will it be the same with DevOps? It’s time to clasp the crystal ball and unravel where the future is headed.

    First things first. DevOps is here to stay. The overwhelming trend towards the digitization of services accelerates the need for agility and shorter release cycles with DevOps as an invaluable building brick: think the Uber vehicle booking service, the Airbnb property rental service—even Amazon’s move to take the terrestrial version of Top Gear and launch it as a digital-only, on-demand broadcast service. Services are going digital. And so are companies: banks, retailers, telcos and others are increasingly positioned as software-driven businesses where IT makes the difference.

    These organizations will need to develop and deliver compelling, customer-centric apps quicker than ever before. Agile development will become the battle cry of every business. Dev and Operations teams will increasingly need to shake hands in a middle ground of rapid development and reliable, high performance services delivery.

    At a technical level, DevOps enablement will be driven by increased public and private cloud adoption: Infrastructure, Platform and Application Service Clouds are all important enablers for DevOps practices. Moreover, DevOps will also grow through the replacement of IT Operations Management tool chains – including automation, monitoring and service management – from non-DevOps to DevOps-enabled and DevOps-ready tools.

    If agile is a journey, DevOps can be seen just as another part of it; one, that suits companies, which successfully completed the first phases of agile transformation and are now looking at ways to further enhance their agile maturity levels and accelerate releases. The increased adoption of agile development methodologies and the increase of related maturity levels thus will also fuel growth. Gartner, for example, has indicated that agile development is essential for mobile application development, arguing that the traditional methods used to define and develop desktop applications will not work with mobile application development.

    Still not convinced? Then how about this. Research by Computing in the UK shows that 30% of 300 organizations surveyed in the run up to the 2015 DevOps Summit had either started to implement a DevOps strategy or had already merged Dev and Ops, with another 13% planning to go down this route.

    Awareness of existing DevOps success will also fuel this continued growth. Recent research, for example, shows that high-performing IT organizations are deploying code 30 times more frequently with 50% fewer failures using DevOps practices. And demand for DevOps skills is soaring too: DevOps engineers are among the highest paid IT practitioners today, according to APM Digest.

    Make no mistake, the software delivery chain will continue to accelerate and change cycles will shrink. In many competitive scenarios, an advantage can only be sustained through organizational agility. In fact, agility can make such a competitive advantage sustainable. Since IT is so important already in the “legacy” enterprise and becomes even more so in the digital economy, existing IT systems and methods will need to move towards agile.

    Here’s another thought. I predict that within the next 10 years the split of ‘Mode 1’ and ‘Mode 2’ companies will disappear. Mode 1 is the traditional approach to development, emphasizing scalability, efficiency, safety and accuracy. It’s the blueprint for how IT Operations works. Mode 2 meanwhile is non-sequential, emphasizing agility and speed. And it requires new thinking and processes around issues such as investment management, governance and collaboration.

    It will disappear for two reasons. First, distinct cultures and operational modes are not sustainable within the same business. Second, if agility is not a requirement, the service should not be operated within the boundaries of the firm for strategic reasons. Own “mode 1” operator companies should be used to outsource non-differentiated IT services.

    In due course, bimodal IT will flourish within organizations, servicing two modes of IT, each designed to develop and deliver information- and technology-intensive services in its own way. Success in both modes demands smarter, more flexible tools that support today’s complex IT operations. Bimodal IT is not without its risks and challenges, but it will be increasingly powerful in helping companies meet ever-growing customer expectations. DevOps will help firms help them bridge these two modes.

    Market demand for DevOps skills will continue to grow too in the next 10 years. Research indicates that DevOps engineers are among the highest paid IT practitioners today and aggressive hiring of people with DevOps expertise will continue in the years to follow.

    One final, more controversial thought. In 10 years’ time, we might not even be talking about DevOps anymore. By then, all stakeholders will understand how to work holistically to achieve business value through the end goal of delivering high quality applications and services to customers. So DevOps might even become redundant. But continuous delivery will be the norm.

  • Q & A: AppDynamics on commercial monitoring applications

    Q & A: AppDynamics on commercial monitoring applications

    AppDynamics hired Enterprise Management Associates (EMA) to produce a study about why the enterprise is plagued with numerous commercial monitoring applications that are not in use. According to AppDynamics, the enterprise is encumbered with disparate applications, resulting in vast challenges for IT teams including underperformance, monitoring gaps, and siloed tools—not to mention that many IT managers do not have time to address these application-based issues.

    AppDynamics emphasizes what it identifies as a finding that almost two-thirds of respondents report that it takes at least three hours to determine the root cause of an application performance issue. AppDynamics concludes that very few IT organizations have an accurate, comprehensive view of today’s complex applications environment, business transactions, and dependencies.

    devopsy.kinsta.cloud spoke with AppDynamics’ VP of Product Marketing, Kalyan Ramanathan about this study.

    devopsy.kinsta.cloud: How did you select and reach study participants?

    Kalyan Ramanathan: We worked with the analysts from Enterprise Management Associates (EMA) to do this survey and study. They have a standard database of people who they always work with, who they interact with. EMA did the heavy lifting, surveying the audience for the study. We did, however, put criteria in place in order to make sure that the survey is relevant.

    We made sure that the survey targeted enterprises of all sizes. So as you may have read, 80-percent of the surveyed respondents had more than a thousand employees, which is about the size where companies start to have some mission-critical applications that might affect a substantial number of either internal employees or consumers when they don’t work well.

    We also wanted a smattering of fairly large customers, or I should say enterprises, only because the challenges that people at that spectrum have are very different from let’s say an enterprise with a thousand employees. So 25-percent of the surveyed respondents had more than 10K employees.

    The other thing that we did as a part of the survey was to focus on the personas that we are talking to, so that again we get good representation across the board. So we had everybody from practitioners to managers to IT execs in this survey because the interesting thing that we found out is that there are some questions where we see a fairly wide discrepancy between these personas.

    DevOps: You say that the survey shows that respondents need flexible deployment options. Did respondents say why in particular they needed flexible deployment options?

    Kalyan Ramanathan: Absolutely, and I think you’re specifically referring to the fact that the solution can be available on premise or in the cloud, and just about every enterprise that we talked to believes that this is a key requirement and it has become a key differentiator for AppDynamics in the market. Many of the companies that we talked to are, I would say, Fortune 1,000 to Fortune 2,000 companies, and in these companies not all their assets are in the cloud today, not all their applications are in the cloud today, and they also deal with a lot of sensitive data.

    So today many of them may choose to work with our on-premise solution, but at the same time I think the writing’s on the wall. I think none of us can question the fact that the cloud is indeed gaining acceptance and that some or many of these applications will indeed go to the cloud at some point. So having that option, having the flexibility that one day my applications will go to the cloud and therefore I could use a cloud-based monitoring solution, without doing a forklift upgrade or replacement of everything that I have, is indeed a good flexibility to have and that’s essentially what our customers see in the AppDynamics product.

    Final Thoughts

    Consider this exchange, dear reader, as enlightenment into what went into this study or as a backdrop for your examination of the published survey results from AppDynamics if you care to read them. You can get the full study here.

  • AppFormix promises to help you manage your cloud infrastructure more efficiently

    AppFormix promises to help you manage your cloud infrastructure more efficiently

    Application Performance Management (APM) tools are great for…well, for managing application performance. AppFormix believes, however, that APM only takes you so far. You also need to manage infrastructure performance.

    The theory behind APM is simple enough: proactively monitor applications to detect and resolve issues in real-time without undue impact on application performance. What if the issues affecting application performance don’t have anything to do with the application itself, though? There are multiple components involved in developing, deploying, and running an application. One very important element of app performance is the infrastructure hosting and delivering that app. AppFormix wants to help organizations bring that same sort of APM visibility and efficiency to proactively addressing issues with the underlying infrastructure.

    In a press release announcing its exit from stealth mode and availability of AppFormix in beta, the company said, “Applications can only perform as well as the infrastructure they run on. Truly reliable performance can only occur when cloud infrastructure is more responsive to the needs of developers and their applications. AppFormix software automatically detects and eliminates resource contention among applications on shared infrastructure. Resource bottlenecks are always moving, and AppFormix is focusing on enabling developers, operations and DevOps teams to use the same toolset to pinpoint them in real-time and establish policies for preventing problems in the future.”

    In the world of DevOps and open source it’s crucial for tools and platforms to play nicely together. It seems that AppFormix delivers on that front. The company claims that AppFormix integrates with OpenStack, Kubernetes, Mesos and other platforms to enable organizations to effectively manage the physical infrastructure while also providing visibility and management for the virtual environment and container technologies.

    “For example, let’s say your application is a flashy, new (and expensive) sports car. Would you drive it on a dirt road? A rickety bridge? A street cratered with potholes? Of course not. But unfortunately cloud infrastructure today IS that dirt road, it IS that rickety bridge, and it IS that street cratered with potholes,” explains Sean Dunnigan in an AppFormix blog post. “If your enterprise does not invest in monitoring and controlling cloud infrastructure, your applications will be in for a bumpy ride. Enterprise cloud infrastructure needs monitoring and control to clearly eliminate bottlenecks and contention to ensure applications have the best infrastructure to “drive” on.”

    What’s interesting about DevOps and the various tools and platforms that have evolved to facilitate and support DevOps is how the line in the sand just keeps getting moved. First application development was the bottleneck so there was Agile. Then infrastructure was the bottleneck so we got DevOps. Then various integration, testing, deployment, and performance automation tools have sprung up to deal with new bottlenecks as they’re discovered. If AppFormix works as advertised, organizations can monitor and deal with infrastructure issues more proactively and move that line in the sand to the next bottleneck.

    AppFormix is available for both Linux and Windows operating systems and is currently available in beta. It is slated for general release in the third quarter of this year.