Tag: apm

  • Tech Pros: Plan for Failure to Breed Success

    Tech Pros: Plan for Failure to Breed Success

    Veteran tech pros will tell you: Failure does not always mean failing at something; it often means failing to do something. Failure can be unpredictable and accidental, but usually, a lack of preparedness causes the most significant incidents. Data centers go down, huge bursts of bot activity generate too many requests for a network to handle and every systems engineer knows that one day—probably sooner rather than later—AWS will go offline. Not preparing for the worst increases the likelihood of the outages, attacks, breaches and downtime that keep tech pros up at night.

    While this spans every aspect of technology, recently there has been a surge in app development failure planning through something increasingly known as “plannable catastrophes.” This pragmatic approach to failure involves considering catastrophes during the application design stage—anticipating disasters on the front end so an app can still perform even under duress. Preparing for catastrophes in this capacity can decrease the amount of time an app is down and give companies the upper hand if an unprepared competitor is experiencing a similar issue simultaneously.

    Plan for Failure

    The first step in planning for failure involves designing a way for processes to fail gracefully—for example, by switching the processes to a degraded service option rather than failing. If one service goes offline, the rest of the application will continue to work. A real-world example of this is enabling users to log in and view documents even if the search process is offline. Another way to plan for failure involves building in request buffering, so the components servicing the requests do not become overloaded. This is designed to prevent possible bottlenecks, especially if there is a spike in requests.

    The second step is to detect failure conditions quickly, so you know when to switch over to the degraded service option. Having full visibility is essential to developing early warning signals for system issues.

    Business Considerations

    Every time an application is down or running slowly, there is a direct impact on the business, either in lost productivity or lost revenue. It’s crucial to bring business context into monitoring performance metrics and to prioritize issues based on business impact, ultimately helping ensure that end users or customers have an optimal experience.

    It’s also key to include endpoint monitoring tools to quickly see if all the functions are online and load times are within range. Monitoring spikes in load or processing times, as well as resource utilization, is also crucial. Together, this will allow you to detect failure conditions quickly, ultimately helping you know when to switch over to the degraded service option—hopefully via automation.

    Creating a Holistic View of a Cloud Environment

    How does planning for failure come to fruition in app development and deployment? The answer lies in creating a holistic view of a cloud environment. Implementing this holistic view from the start of the process involves knowing that an application is going to fail—not if, but when—and planning accordingly. Top best practices include:

    • Shift Left: Integrate operations and monitoring considerations in application design and system architecture, coding, testing and preproduction. This helps both development and operations teams identify issues early, cut down on troubleshooting app issues later and react quickly to keep applications up and running even during spikes in demand or service failures.
    • Adopt an application performance monitoring (APM) tool: Full-stack visibility, from the end user through to the applications and infrastructure, is essential to having the ability to spot the early warning signs of a potential service disruption. To create that view, you should select an APM tool that can monitor the performance of the application holistically and allow you to design meaningful performance metrics and alerts. Implementing a curated collection of easy-to-use tools that seamlessly provide full-stack performance management without the cost or complexity of traditional APM solutions is key.
    • Be pragmatic in app development: Leverage APM tools in the staging or dev environment to measure the effect of variables on performance before the app goes live. Use APM tools to set up baselines at each phase, creating valuable metrics to flag when issues are about to take place and to detect failure before an app goes completely offline. Understanding the app’s baseline activities and response time enables tech pros to identify if the app is performing at the level it was designed. Tech pros can leverage platform capabilities to meet and exceed initial goals.

    Conclusion

    Failure is inevitable. Tech pros must ensure end users continue to have the best possible experience in the application and that business goals and service level agreements (SLAs) are met even amid crises. Preparedness comes in the form of taking preventative measures to help avoid and mitigate failure and having a plan in place to get back online as quickly as possible if preventative measures fail.

    Shifting left, building failure mitigation into the design phase and implementing an APM tool helps create a holistic view of the cloud environment and achieve these goals. Planning and building for failure help tech pros avoid and mitigate potentially detrimental issues, ultimately using failure to breed success.

    — Melanie Achard

  • Instana Releases Automatic Application Monitoring Agent Operator for Red Hat OpenShift

    New Operator Provides Deployment Flexibility for Instana’s Full-Stack Kubernetes Application Performance Monitoring Solution

    Boston at the Red Hat Summit – May 8, 2019 – Instana, the leader in Automatic Application Monitoring solutions for containerized applications, is making it easier for DevOps teams to manage orchestrated applications with its first release of agent technology as an Instana Agent Operator and has achieved Red Hat OpenShift Operator Certification. This new deployment option offers deployment flexibility to users, who can also run the agent as its own container, host process or microservice.

    “The Instana Operator makes it easier and more efficient for companies to deploy and operate their microservice applications,” said Pete Abrams, Instana co-founder and COO. “Instana’s ability to deploy monitoring agents as Operators on Red Hat OpenShift allows DevOps teams to leverage Instana’s ability to automate monitoring configuration and application root cause analysis on top of OpenShift, the industry’s most comprehensive enterprise Kubernetes platform.”

    Instana’s Automatic APM solution for microservices is the only automated application monitoring solution that provides full-stack visibility automatically and collects end-to-end traces of every user request. The solution not only recognizes the presence of containers and orchestration, it has automatically deployed monitoring sensors for those infrastructure components.

    Unlike conventional monitoring solutions, Instana’s automatic APM solution discovers application infrastructure and service components, deploys monitoring sensors for the application’s technology stack and traces all application requests – without requiring any human configuration or even application restarts. The solution detects changes in the application environment in real-time, adjusting its own models and visualizing the changes and impacts to performance in seconds.

    “Kubernetes Operators are appealing because they help encode the human operational logic normally required to manage services running on a Kubernetes-native application and aim to make day-to-day operations easier,” said Julio Tapia, director, Cloud Platforms Partner Ecosystem, Red Hat. “We are thrilled that the Instana Agent Operator is Red Hat OpenShift Operator Certified. By providing Operators on Red Hat OpenShift users can begin experiencing the next level of benefits from a Kubernetes-native infrastructure, with services designed to ‘just work’ across any cloud where Kubernetes runs.”

    Instana’s microservice monitoring capabilities include deep visibility into almost a dozen different languages and over 100 different microservice application infrastructure technologies including Docker, Kubernetes, Spring Boot, NGINX, AWS and many more. Monitoring for each technology component includes correlated application level visibility, as well as information tied to each individual request in traces.

    The correlated monitoring of applications and infrastructure extends to the OpenShift Kubernetes distribution, providing automated visibility into mission critical applications, their dependencies and their performance.

    Instana will be demonstrating its APM solution for OpenShift Applications at Red Hat Summit in Boston (Booth 310) – as the second stop on Instana’s annual Kubernetes Roadshow. Learn more about the company’s automatic APM and Application Infrastructure monitoring solution by visiting www.instana.com.

    Red Hat and OpenShift are trademarks or registered trademarks of Red Hat, Inc. or its subsidiaries in the U.S. and other countries.

    ABOUT INSTANA

    As the leading provider of Automatic Application Performance Monitoring (APM) solutions for microservices, Instana has developed the automatic monitoring and AI-based analysis DevOps needs to manage the performance of modern applications. Instana is the only APM solution that automatically discovers, maps and visualizes microservice applications without continuous additional engineering. Customers using Instana achieve operational excellence and deliver better software faster. Visit https://instana.com to learn more.

  • Application Monitoring Using Stagemonitor

    Application Monitoring Using Stagemonitor

    This article covers important steps to monitor a typical Java application using Stagemonitor tool, Kibana as a dashboard viewing tool and Elasticsearch as a data processing engine.

    Stagemonitor is an open source Java application performance monitoring (APM) tool that provides everything you need in development, quality assurance and production to monitor the performance of your Java web application.

    Using this tool, we can have different dashboards such as JVM dashboards, application server, request metrics, host, request analysis, web analytics, etc.

    Architecture of the Stagemonitor

    Figure 1

    The Stagemonitor agent sits inside the application and sends metrics and details about requests (request traces) to Elasticsearch. Metrics can optionally be sent to Graphite, Influx DB and Prometheus.

    Prerequisites

    • Minimum of 2GB RAM and 200GB hard disk
    • Java version of 1.8 or more
    • Install latest versions of Kibana and Elasticsearch

    Steps to Monitor Java App with Stagemonitor

    Dev Time Monitoring With Browser Widget

    This step illustrates how to enable a widget in dev time monitoring, adding the Stagemonitor plugin inside the Java app. We can do this in two ways: We can directly edit the pom.xml/build.gradle file by adding the required stage monitor plugins, or we can add dependencies in the application’s LIB directory.

    Some of the important plugins we must have in pom.xml/build.grade to get monitoring dashboards are Stagemonitor configuration, Stagemonitor tracing Elasticsearch, Stagemonitor tracing, Stagemonitor-jdbc, Stagemonitor-jvm, Stagemonitor-os, Stagemonitor-web-servlet and Stagemonitor alerting.

    We’ll get the Stagemonitor plugins from the following location: https://mvnrepository.com/search?q=stagemonitor

    After installing the agent, will have to create one Stagemonitor configuration file as stagemonitor.properties file under src/main/resources in case of maven application. Otherwise, the file must be located at the root of class path. At the end, it has to be under the WEB-INF/classes section.

    The following is what the stagemonitor.properties file looks like:

    stagemonitor.applicationName=My Application

    stagemonitor.instanceName=dev

    stagemonitor.instrument.include=org.example.app

    Request Dashboard

    In this section, we focus on setting up the time series database to collect the data and visualization tool to view the metrics in detail. Here we’ll use Elasticsearch as the time series database engine and Kibana as the visualization tool.

    To get the data from Elasticsearch database, we will include properties in the stagemonitor.properties file:

    stagemonitor.reporting.elasticsearch.url=value,

    stagemonitor.reporting.elasticsearch.username=value

    stagemonitor.reporting.elasticsearch.password=value

    stagemonitor.reporting.interval.elasticsearch=60

    After adding all the required values and restarting the server, we will be able to open the (automatically added) request analysis dashboard in Kibana. Along with that, we will be able to see different dashboards automatically.

    To use Influx DB as a time series database, we’ll have to configure the values in stagemonitor.properties file:

    #following the details contains influxDB

    stagemonitor.reporting.influxdb.url=http://localhost:8086

    stagemonitor.reporting.interval.influxdb=60

    stagemonitor.reporting.influxdb.username= value

    stagemonitor.reporting.influxdb.password=value

    Logs Monitoring using Kibana/Stagemonitor

    We can track logs using Kibana/Stagemonitor. In the metrics dashboard, we can see matrices such as what URL address we’ve hit and the time to complete the request (Figure 2). We can track the host details such as how many servers our applications are running, the status of the server, memory stats, CPU stats, network stats, disk usage stats, networks processed, network packets errors, network packets dropped and how many cores of the CPU the host is using.

    Stagemonitor provides all the required dashboards under the request analysis dashboard. To open the request analysis dashboard, click on: Dashboard – Load Saved Dashboard and select “Request Analysis.”

    Figure 2

    Figure 3 shows the details of the CPU, such as CPU usage and CPU load.

    Figure 3

    Below, Figure 4 shows total page views, unique number of visitors to the site and call tree, and how much time it takes to complete.

    Figure 4

    Figure 5 shows the transaction history and individual transaction details.

    Figure 5

    Figure 6 shows the JVM details and all the other memory matrices.

    Figure 6

    As mentioned above, we can monitor various application metrics and infrastructure metrics.

    — Sai Babu Tanguturi

  • Instana Automatic APM Now Available in Amazon AWS Marketplace

    AWS Users Can Seamlessly Install and Purchase Automatic Application Monitoring and Tracing

    SAN FRANCISCO AND SOLINGEN, GERMANY  – APRIL 19, 2019

    Instana, the leading provider of Automatic Application Monitoring (APM) solutions for cloud-native applications, today announced that its automatic APM solution is available for purchase in the Amazon Web Services (AWS) Marketplace. AWS subscribers can now acquire Instana to manage their AWS applications and infrastructure seamlessly through their AWS account.

    “No matter how big or small an IT organization is, cloud-based infrastructure and applications have become a critical part of the deployment strategy,” said Pete Abrams, Instana co-founder and COO. “Allowing these organizations to research, purchase and deploy a performance monitoring solution for their cloud systems makes their monitoring startup processes more efficient.”

    With just a few clicks, AWS users can access Instana’s automatic APM and application infrastructure monitoring solution, add the licenses to their AWS account and start monitoring performance.

    Unlike conventional monitoring solutions, Instana’s automatic APM solution discovers application infrastructure and service components, deploys monitoring sensors for the application’s technology stack and traces all application requests – without requiring any human configuration or even application restarts. The solution detects changes in the application environment in real-time, adjusting its own models and visualizing the changes and impacts to performance in seconds.

    The new Instana AWS marketplace entry includes an option to try the fully-featured product for free, giving users the opportunity to see how all their AWS applications and infrastructure are performing. Instana’s automatic deployment, discovery and monitoring configuration capabilities deliver visualizations of application dependency maps and service level monitoring in minutes.

    Instana’s automatic APM includes monitoring and tracing for over 100 different languages, microservices and popular Amazon platforms including EC2, DynamoDB and AWS RDS databases, AWS SQS Messaging, ELB Load Balancing, and AWS Kinesis streaming. Learn more by visiting http://www.instana.com.

  • Apply Balance and Critical Thinking for Greater Agile Success

    Apply Balance and Critical Thinking for Greater Agile Success

    In an ideal world, implementing DevOps practices and Agile methodologies would be the key building blocks organizations need to realize rapid, high-quality releases.

    The ability to iterate on a product with a high volume, velocity and level of quality is the ultimate goal of the modern enterprise; every CEO wants a faster time to market. But keeping business practices agile is much easier said than done. The term “agile” is broad. While The Agile Manifesto does a good job of defining the concept, there are myriad technical and non-technical aspects to the idea. At the end of the day, simply saying you are “agile” isn’t some silver bullet that delivers faster cycle times, a better product and more satisfied users.

    Instead, success with Agile methodologies means thinking more critically about how they are deployed and if your current DevOps practices are strong enough to support that strategy.

    What is Agility, Really?

    In practice, agility is a complex combination of things, perhaps best understood by what it’s not. Being agile with a product is not simply thinking about how fast you can complete a collection of features. Yes, it’s great when the backlog becomes smaller, faster. But Agile, when applied correctly, is really about having a true understanding of the user’s business problem and a real idea of their envisioned, desired outcome—and what it might take to achieve that outcome.

    This requires a shift in thinking when it comes to the product backlog. Too often, backlogs are viewed vertically, meaning features are built that may not have independent value. As a result, release efforts grow in development effort and elapsed time, limiting the ability to quickly release in small, incremental stages. As an example, consider search functionality as a feature set. On its own, search isn’t necessarily an independently valuable feature. What are users searching for? Why do they need this information and what are they doing with the results? A vertical view of agility fails to ask these questions and focuses only on the myopic feature set at hand. Consequently, even the most mature Agile practices are limited in what they can accomplish. Who really cares if you can get a feature out of the backlog quickly if it doesn’t matter to users?

    Agile thinking should instead be applied horizontally; the user’s journey is the center of everything. What do they need to accomplish? What are they unable to do now and how quickly can we give them that ability? In the search example, this means thinking beyond simply building a search function and instead developing a new product release that eases a specific pain point of users. Quick and iterative changes based on direct user feedback is the goal.

    So Where Does DevOps Come In?

    Agile is hardly a foreign concept for software engineers—86 percent use an Agile methodology (such as scrum) day to day. But the tools, processes and practices of DevOps need to be honed constantly to support iterative development, testing and release of code.

    As with the development of any product, software developers have much to gain from building and testing functionality in small, iterative releases. Smaller tests allow for more intensive studies of accuracy and problem-solving before allowing an entire organization to rely on a solution. While these pilots may not be fully rolled out, the teams involved must be integrated to include voices from a variety of stakeholders, including but not limited to:

    • Architecture
    • Experience design
    • Development
    • Security
    • Quality assurance
    • Operations

    Teams must also keep these DevOps best practices front-of-mind when developing a software solution:

    • Employ microservices. A solution built from these separately deployable services that perform specific business functions is much easier to scale out or expand. Microservices also remove single points of failure (SPOFs) by preventing issues in one area of an application from affecting others.
    • Blend continuous integration (CI) and continuous delivery (CD). These two DevOps strategies support each other in much the same way as integrated human teams that consider stakeholder needs. While CI automates the build and testing processes, CD automates the deployment cycle from development to production. The automation behind both results in a vastly increased deployment frequency.
    • Use infrastructure-as-code. Modern cloud platforms allow for infrastructure to be software-defined. This allows DevOps practitioners to bring best practices from the field of software engineering to bear against systems challenges. Think about the new features AWS announced for CloudFormation this year, for example: configuration drift detection, dynamic references, macros (functions with iteration support) and linters. All of these are in support of treating infrastructure orchestration as a software engineering activity, allowing DevOps teams to use one common set of tools and practices.
    • Refine observability. As architecture becomes ever more complex, the practices of monitoring and logging are evolving. No longer can you independently monitor the uptime of a server and simply log OS and app issues. Application performance management (APM) becomes paramount, measuring aspects of the user experience as they flow through the app, as does identifying and publishing relevant business metrics. The distributed nature of microservices and the various cloud services enabling them, demand new tooling to measure potential bottlenecks in the form of distributed tracing. And the DevOps best practice of “hands-off production” (e.g. no shell or attachment access) means you’ll need to provide real-time visibility into the health and inner workings of your application via log shipping, adding your centralized logging solution into the critical path of application troubleshooting.
    • Focus on communication. This is perhaps the most beneficial point for your team and should not be overlooked. The cross-functional, collaborative teams supported by both Agile and DevOps culture break down traditional silos and unite members around a common goal. Formal structures around these teams should start early and continue through retrospectives to assess and celebrate everything you’ve accomplished in a short time. You’re not working in a vacuum, and this project isn’t the only one your team will ever produce. Keeping careful records of successes, failures and areas for improvement will only make your work more efficient and Agile in the future.

    Agile is the perfect process for the modern tech landscape—releasing quickly in small bites that are then perfected based on customer feedback. In living up to that ideal, teams who turn to Agile in managing their projects shouldn’t take a set-it-and-forget-it approach to their processes. Instead, bolstered by DevOps tools, culture and practices, they should embrace the ongoing refinement and reflection required to support both customer needs and business goals.

    — Adam Hanson

  • SolarWinds Adds Ability to Profile Live Code to APM Platform

    SolarWinds Adds Ability to Profile Live Code to APM Platform

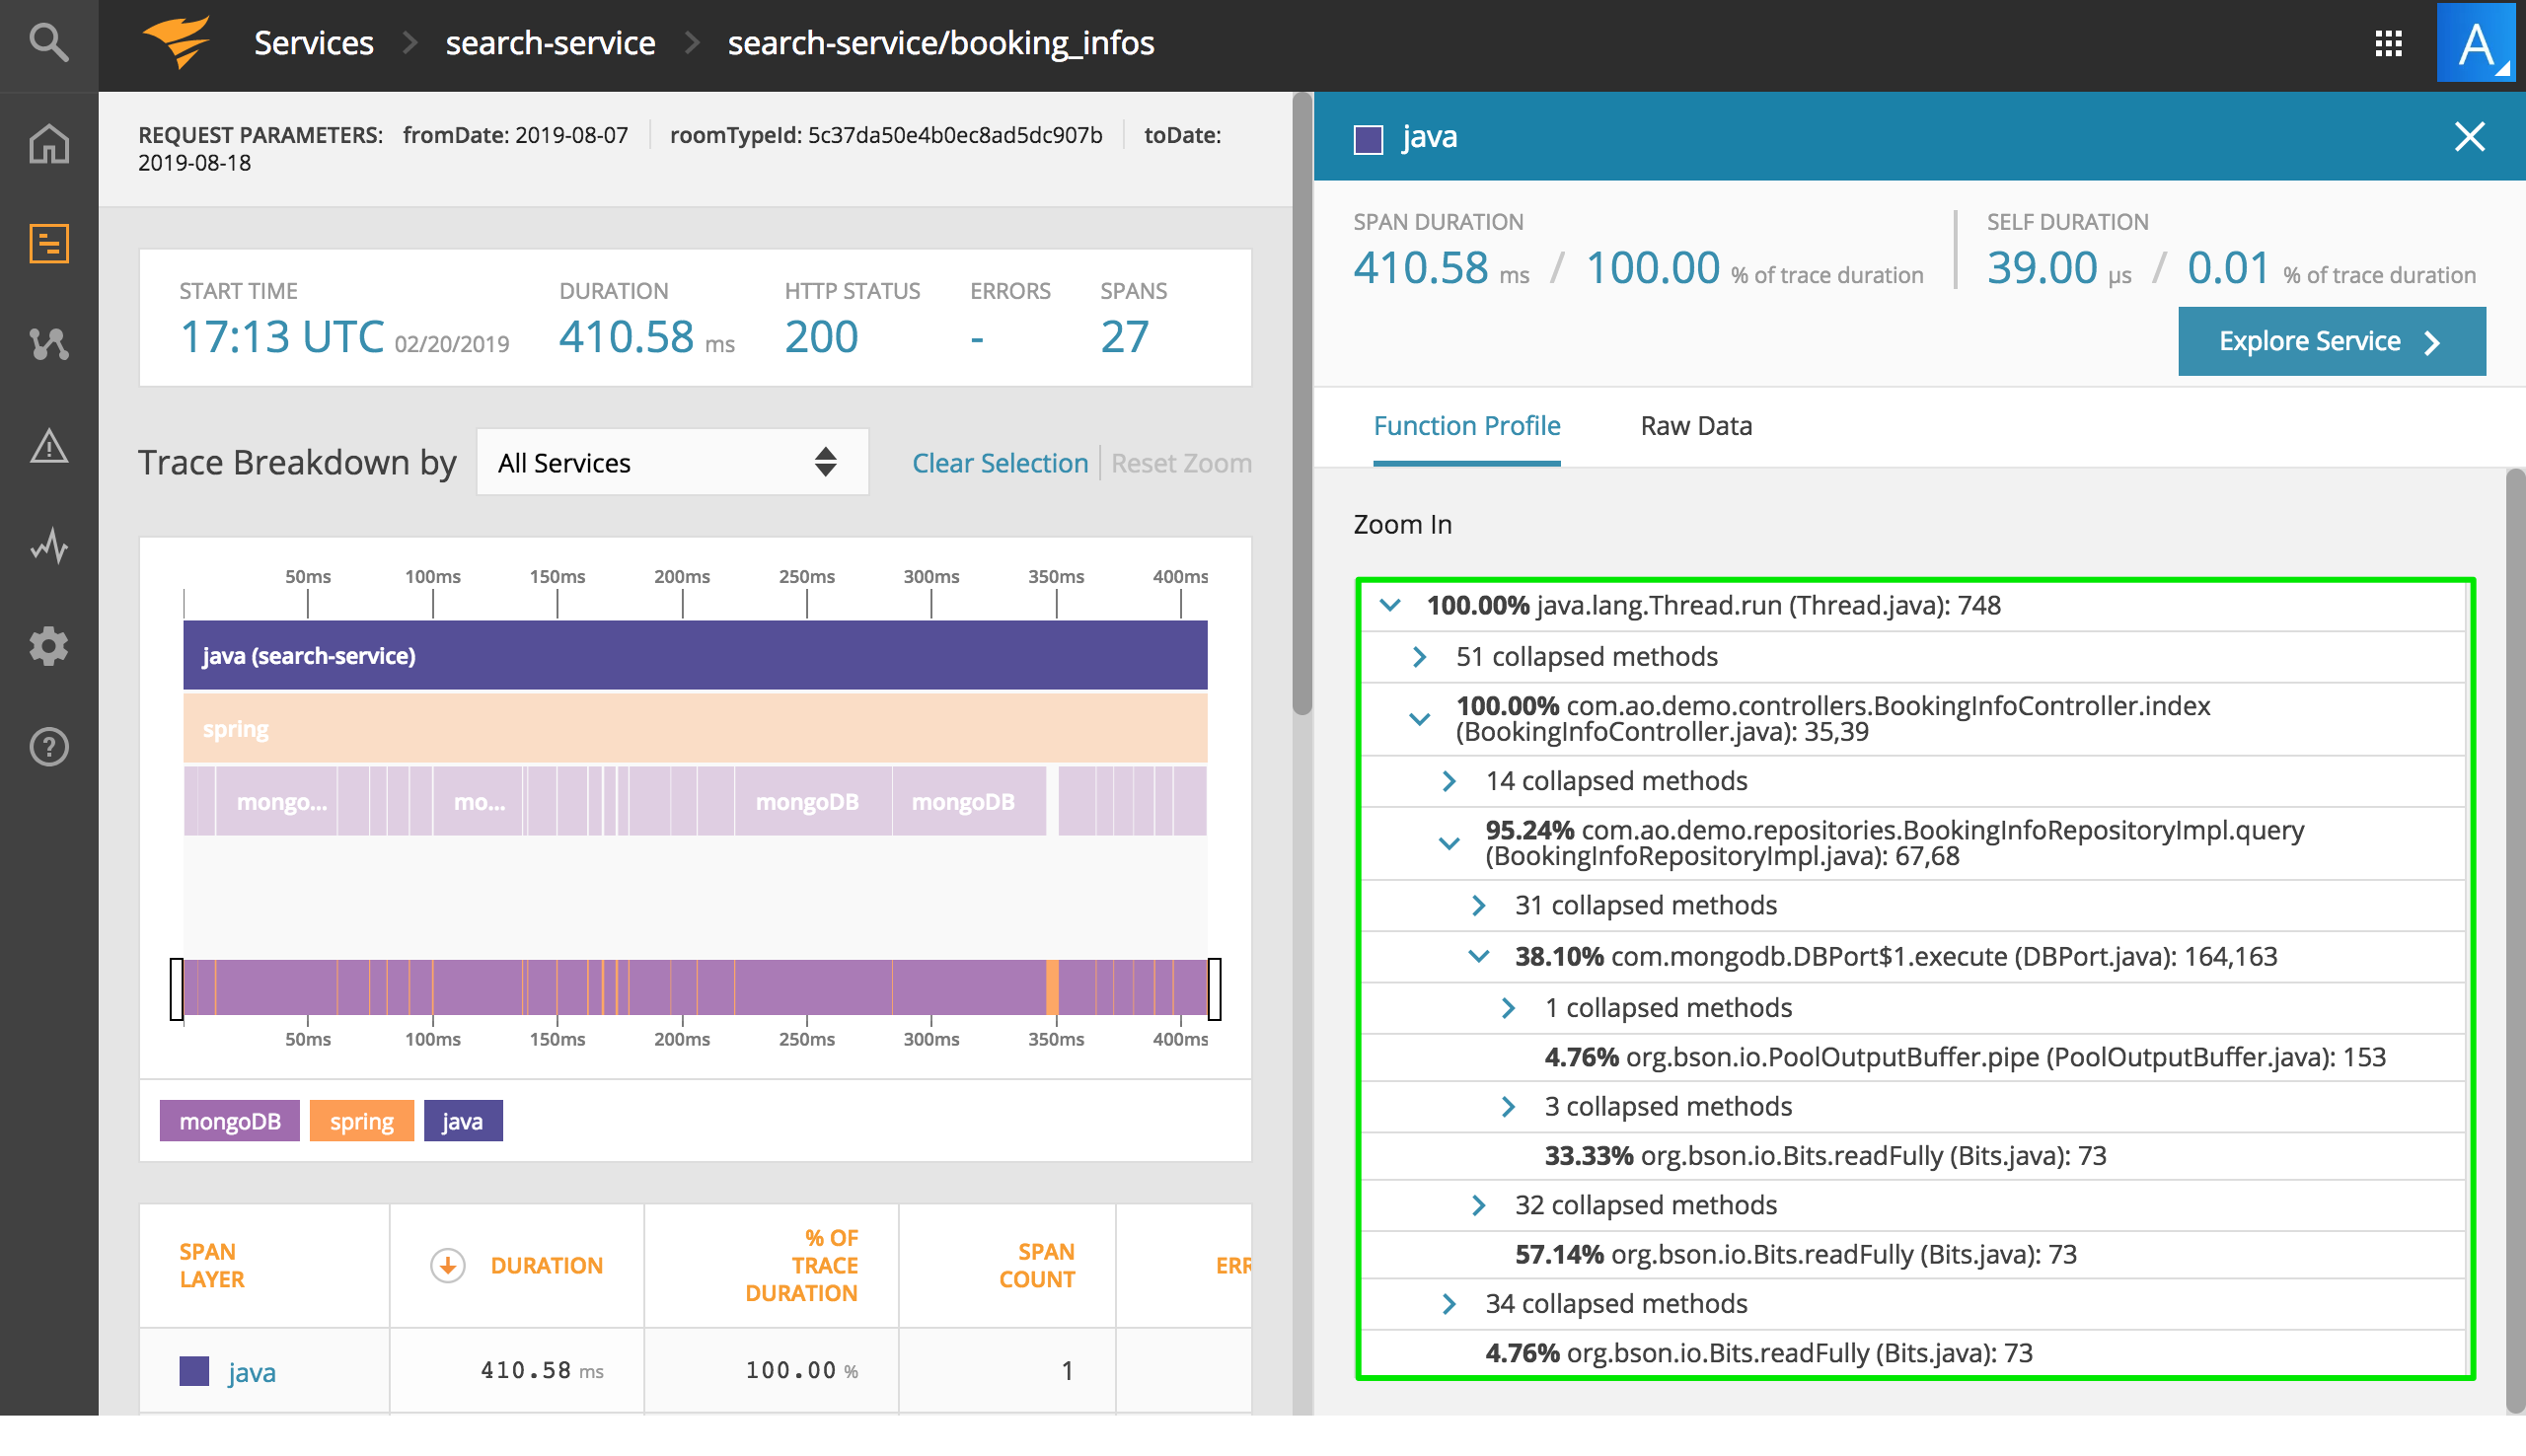
    SolarWinds is advancing its campaign to become a leading provider of DevOps tools by adding the ability to profile live code to SolarWinds AppOptics application performance monitoring (APM) platform.

    Keith Kuchler, vice president of engineering for SolarWinds, said live code profiling provides a breakdown of the most frequently called functions and methods in a transaction, including class, method, filename and line number. That capability makes it possible for DevOps teams to identify what line of code might be causing a performance issue without requiring any changes to the code itself, he said.

    According to Kuchler, the ability to profile live code extends a distributed tracing capability that SolarWinds previously incorporated into SolarWinds AppOptics. Collectively, the two offerings show how committed SolarWinds is to providing DevOps teams with access to advanced capabilities at a fraction of the cost of rival APM platforms delivered as a software-as-a-service (SaaS) application, said Kuchler. Pricing for SolarWinds AppOptics starts at $7.50 per month. SolarWinds AppOptics is part of what SolarWinds describes as a DevOps Toolkit that also includes Pingdom, a website performance monitoring tool, Papertrail, a log management service, and Loggly, a log analytics service.

    The ability to profile live code supports applications written in Java and PHP, with support for additional programming languages forthcoming, said Kuchler. The goal is to reduce the amount of time DevOps teams need to spend guessing where the source of any issue might be after an application is deployed or updated, he added.

    As the rate at which applications continue to be deployed and updated, DevOps teams need to be able to pinpoint issues at the code level to enable developers to address that issue as soon as possible. Sharing a bunch of generic alerts typically doesn’t provide a developer with enough actionable intelligence to solve the problem. Not surprisingly, a recent survey of over 300 developers conducted by SolarWinds finds that most of them spend a lot more time troubleshooting existing applications versus writing new code. All that time spent troubleshooting code winds up having an adverse impact on the ability to make the transition to DevOps.

    In general, SolarWinds is trying to expand the total APM market by making its tools available as a service that organizations of any size can invoke. Historically, reliance on APM tools has been limited to mission-critical applications mainly due to cost. But over time, the number of applications deemed to be mission-critical has increased. In addition, because of the all interdependencies between applications, the potential impact a single line of code can have across the enterprise IT environment can be substantial. As a result, the need for an affordable approach to APM has become more acute.

    Naturally, it will be interesting to see how much pressure there is on APM pricing over the course of the coming year. Competition between providers of APM platforms is already fierce. The challenge will be finding a provider of an APM platform that not only provides all the capabilities required, but also has deep enough pockets to be around for the long haul.

    — Mike Vizard

  • Building Amazing Apps, Part 2: Optimizing the Back End

    Building Amazing Apps, Part 2: Optimizing the Back End

    This is part two of a series of three articles on building and delivering amazing apps at the edge. To read part one, click here.

    There are millions of apps available today, and it’s incredibly easy for any user to download and install any of them with just a few taps on a screen or click of a mouse. If you want to build and deliver an app that will amaze users, you need to be able to differentiate from the rest of the pack.

    Over the past 14 years, I’ve been working closely with the top companies delivering the most popular apps, helping them optimize their apps for speed and scale so users get a great experience. In this three-part series, we’ll explore the fundamental steps you must take to build and deliver your own amazing app at scale that will keep users coming back for more.

    We’ll break these steps down into three key areas:

    • Front end: Covers the parts of the app that end users interact with.
    • Back end: Looks at the required origin infrastructure to support the app, including databases, application, web servers and more.
    • Middle-mile: Explores the internet, where all the information needs to traverse back and forth between the front end and back end.

    In this article, we are going to explore five things you can do on the back end.

    Distributed Architecture

    In a nutshell, distributed architecture means having origin (back end) infrastructure that is geographically dispersed to maximize availability and performance.

    There are three main types of back end configurations:

    • On-premises: This is where the hardware and software are owned and managed by your organization. This type of back-end architecture is often more expensive and resource-intensive to maintain but offers a higher degree of security and flexibility because you have full control of the hardware and software.
    • Cloud-hosted: This is where the hardware and software are hosted on a third-party cloud provider. This type of architecture runs on dedicated or multi-tenant servers, and is usually more cost-effective to create and manage because some of the cloud providers include efficient infrastructure configuration/orchestration tools.
    • Hybrid: This is where your architecture is a mix of on-premises and cloud-hosted. This is the most flexible and common solution, since most companies that traditionally have relied upon all on-premises architecture are slowly migrating some of their back end to the cloud. For this type of solution, it’s best to use open source, multi-cloud tool solutions.

    The goal for your configuration should be having a back-end system that is geographically dispersed enough (with most locations close to your users) to ensure low network latency, while at the same time avoiding a single-point-of-failure to ensure the service runs, despite any localized outage.

    Regardless of your configuration, the general idea of distributed architecture remains the same: Using data centers where the load is distributed via a global load balancer, and where critical information is replicated across the data centers via fast, fiber-optic private links.

    Here are some concepts you can research that will help you to choose the most optimal, distributed architecture for your needs: virtual machines, containers, microservices, data replication, stateless apps, serverless, distributed processing, etc. devopsy.kinsta.cloud is an excellent resource to learn more about them.

    Generally speaking, you can simplify your origin infrastructure and maximize end-user performance by putting a content delivery network (CDN) between your end users and your back end. A CDN is a super-distributed network of reverse proxies that allows you to put your content very close to end users, minimizing network latency to achieve rapid app interactions, especially when the CDN caches your content on its edge servers.

    Auto-Scaling

    You can optimize costs and performance by choosing an architecture that auto-scales (up and down) depending on current traffic demands. To implement this effectively, you need to monitor global traffic and set triggers that launch infrastructure on-demand so it is ready when needed. Most of the largest cloud services companies support auto-scaling services, and some of them even allow you to tune your settings to favor either costs or performance. One of the easiest ways to implement effective auto-scaling is with CDNs, which can automatically scale traffic with minimal effort just by configuring a set of rules that define what content should be handled completely by the CDN (either dynamically generated at the edge or cached) and what content should be pulled from your origin infrastructure.

    Continuous Monitoring

    Continuous monitoring helps maintain the quality of service. There are many open source tools for continuous monitoring that fall mostly into the following four categories:

    • Infrastructure monitoring: This allows you to keep track of compute resources, storage, network usage, etc.
    • Cloud providers: Most of the largest cloud providers have integrated tools for monitoring your back end in each respective cloud platform.
    • Application performance monitoring (APM): To monitor your application’s framework.
    • Aggregators: Tools that allow you to aggregate and analyze data across several monitoring tools.

    In addition, it’s a good idea to complement server-side monitoring with real user monitoring (RUM) tools to identify whether a specific code deployment impacts performance.

    Performance

    A faster back end makes for a faster front end, and, as we know from part one of this series, performance is a major contributor to user experience. In addition to focusing on improving metrics including latency, throughput and errors (all of which are directly correlated with back-end performance), it’s critical to have a “culture of performance” in your company. José Pérez provides an overview of that concept in his article, “Fostering a Web Performance Culture.” This is a perfect example of how you could implement a culture of performance in your organization, by having performance tools integrated into your IDEs—this can provide instant feedback to developers on how new code performs against a defined performance baseline so that any code that might degrade performance is identified before it is deployed.

    For content that is not personalized, such as a product catalog, news or media assets, you can easily improve performance by putting a CDN in front of your back end (and caching that content on the CDN’s edge servers). Those edge servers are distributed around the world, located much closer to end users than your back-end infrastructure, to minimize network latency and maximize throughput.

    DevOps Automation

    Finally, a big part of setting up monitoring that works (and in responding to failures quickly) is DevOps automation. Building automated DevOps tooling allows you to react to changing conditions automatically, in real time.

    For example, you can use DevOps automation to alert your team via a chat system such as Slack when a deployment impacts the service, with an option to roll back easily the deployment within the chat app. Another great example of DevOps automation is Pinterest’s implementation of a “performance detective” that runs a binary search (similar to git bisect) to determine the offending commit that is degrading app performance after a release. If you combine these two automations, you could detect a performance degradation caused by a release; let the DevOps team know that it has been rolled back and track the offending code in the version control repository. That’s just one specific example among the many ways that DevOps automation can further optimize your back end.

    Coming up next in this three-part series: Everything you need to know about optimizing the middle-mile.

    — Javier Garza

  • DevOps Chat: AIOps and APM with Unravel’s Kunal Agarwal

    DevOps Chat: AIOps and APM with Unravel’s Kunal Agarwal

    Unravel is making a name in the AIOps, APM and big data markets. In this DevOps Chat, we speak with Unravel CEO Kunal Agarwal about what makes Unravel a must-have for its customers. We also take a sneak peek ahead to what the near and not so near future holds for big data, AIOps and the tech scene in general.

    As usual, the streaming audio is immediately below, followed by the transcript of our conversation.

    Transcript

    Alan Shimel: Hey, everyone, this is Alan Shimel, devopsy.kinsta.cloud, and you’re listening to another DevOps Chat. Today’s DevOps Chat features Kunal Agarwal, CEO of Unravel or Unravel Data. Kunal, welcome to DevOps Chat.

    Kunal Agarwal: Thank you, Alan. Thank you so much for having me here.

    Shimel: Excellent. It’s my pleasure to have you here. So, Kunal, let’s get right to it. “Unravel” is the name of the company, correct? Not “Unravel Data.”

    Agarwal: “Unravel,” yes.

    Shimel: But yet Unravel is about data to a certain degree. I don’t know if everyone in our audience is familiar with Unravel. Why don’t we start there?

    Agarwal: Sure. We are unraveling the mysteries of big data, Alan. That’s why the name of the company.

    Shimel: Excellent.

    Agarwal: Everybody’s jumping on to big data apps, and what I mean by that is you may be doing something with machine learning, artificial intelligence, IoT, even big-scale data warehousing. And there’s just so many problems that can happen, running these applications at scale, that people just have not seen before. And this is a problem because of all these new systems and technologies that are coming about, such as Spark, Kafka, Hadoop, Cassandra, HBase, many, many more. And the complexity’s all about “Hey, how do I figure out why’s my application not performing well or if it’s failing?” And it’s usually a multi-tenant environment that these big data applications run on, which means there may be hundreds of users, thousands of applications, that you are creating every day and running them.

    And figuring it all out and making sure that they run well is a black art, so there’s a lot of trial-and-error that goes on into fixing these problems, finding the root cause of these problems. And that’s what we are automating, meaning Unravel, after it’s installed in your big data cluster, will be constantly monitoring and managing everything. And if there is an issue, Unravel will be proactive about it, tell you why that issue happened, what caused it, and then even take a step further where it would resolve those issues for you so that you can spend time creating all these amazing big data applications, rather than focusing on fixing all these systems- and application-level errors.

    Shimel: Mm-hmm. So, you know, I mean, there’s a lot there that we’re gonna dive into, but before we do, Kunal, just give our audience – ’cause I always find this fascinating. People wanna know “How do I become a CEO? How does one get to be the CEO?” Give us a little insight into your own personal journey on how you’ve come to be CEO at Unravel.

    Agarwal: CEO is “chief everything officer,” when you first start off. You gotta sweep the floors and you gotta raise the funds and you’ve gotta grow a team. There’s so many things a CEO’s role requires to do, especially in a young company, as you’re growing it. Today, now that we’ve grown to about 75, 80 people in total, across 3 different countries – we actually have offices here in the United States, one in London, and one in India – my job is becoming more about recruiting, more about getting the team together.

    And I think that’s, personally, for me, if that is taken care of, the entire company just hums and does well. Everything else is secondary for me at this time, but I do spend a lot of time doing marketing and sales and finance and product. So it really depends on the day, Alan, of what my job requires me to do.

    Shimel: Amen. You know, I’ve founded or cofounded three or four companies myself and even just running MediaOps, which is devopsy.kinsta.cloud and Security Boulevard, you are chief cook and bottle washer when you’re – you’re chief everything officer, as you said.

    Agarwal: Right.

    Shimel: You know, looking in your background, you’re a double-major graduate – electrical engineering, computer science master’s degree from Duke. I mean, you’re well positioned to be a CEO, people would say, looking at the background, but it’s – you know, you never know what’s coming out next as the CEO. If I had to ask you, Kunal, what’s kind of been the biggest surprise or biggest kind of curveball that you’ve seen in your time at Unravel that you think, “Geez, I didn’t think I’d be doing this or I didn’t think this was part of the job,” what would you say?

    Agarwal: Alan, actually, going to school and getting all those double-degrees does not help you at all becoming CEO.

    Shimel: You get it. I mean, you’re talking to someone who went to law school. I know all about it.

    Agarwal: Right?

    Shimel: Yeah.

    Agarwal: I wish there was a school for CEO, but you know what? The only school for being CEO and leading a company is actually leading the company because there’s so many things that you learn along the way. One thing, because we deal in enterprise software, there’s so many complexities to making a deal happen with a big company.

    Shimel: Mm-hmm.

    Agarwal: And I think that was one of the things that took me a while to grasp and make sure that we’re doing it right. And I mean all the boring stuff, like the contractual paperwork, all the legalities, going through info-sec requirements. All the operational stuff around making a deal happen. You know, when you’re in college and you’re starting to think about a startup, you think about the cool products you’ll make. You’ll think about the impact your product will have in the market and how so easily everybody will flock and come to you and get your product. [Chuckles] But it’s not that simple.

    Shimel: I wish it was.

    Agarwal: and it takes 9 months to 12 months to close some of these deals, so I think, more than the “surprise” factor, preparing yourself and making sure that you can drive efficiencies in all these different processes. I think that’s been one of the key challenges for us.

    Shimel: Absolutely. Absolutely. So, Kunal, if I’m a Silicon Valley VC, I’m looking at a company like Unravel, man, you’re playing in all the right places. Big data is certainly such a huge – I think, when we talk about things like machine learning and AIOps, really, they’re almost the children of big data – you couldn’t have those things without the big data, first of all – so you’re in the right place, obviously. The right time. This is a very happening kind of space. What is Unravel doing that is so – what’s the special sauce? What’s unique about it?

    Agarwal: Yeah, Alan. So, when we created this company – and by “we,” I mean myself and my cofounder, Dr. Shivnath Babu, who’s actually a professor of computer science at Duke University – we both met at Duke – and the problem we were trying to resolve is one of the most fundamental but also probably the most complex and challenging problem to solve, which is “How does one ensure that all of these big data technologies actually work and deliver on their promise?” And, you know, our approach to the problem was always “Hey, there will be a shortage of experts in the market. Even if there are experts, these problems will be requiring a machine to solve them on time and efficiently.”

    So we took the long path of actually creating not just a monitoring tool but a AIOps tool, if you may, which can decipher the problem, connect the dots, and resolve it for you. So it actually took us about three-and-a-half years to build this product or at least the first version of this product. And we moved west to start working with some companies – I lived in New York; he was in North Carolina – and we gave up our cushy jobs, moved to Silicon Valley, because you wanted to work with companies who were using big data tech at scale.

    And some of these companies, we still have advisors in, from Zynga, Rocket Fuel, Twitter, LinkedIn, and they really helped us understand the day-to-day issues that come up when you’re running these technologies at scale. And we took a lot of those learnings into our first product. So we were always about solving a core need that teams in big data tech would definitely need. And, you know, they always say, “Hindsight is 20/20,” right?

    Shimel: Yeah.

    Agarwal: But we always put a big bet that, “Hey, these technologies – Hadoop, Spark, Kafka, et cetera – will become mainstream and companies will start using this a lot more.” So what LinkedIn was doing five years ago, the biggest banks would start doing it now, and that’s where we are in the journey today.

    Shimel: Absolutely. And, you know, it’s funny, full circle, talking about that journey and what you’re doing. That’s how you become a CEO. It’s about being willing to take the risk, giving up those cushy jobs. Right? To do something that you really believe in. And I think that’s what separates CEOs from people who kinda look and say, “Boy, I’d like to do that,” but they don’t actually do it.

    Let’s talk about the market. We’re coming to the end of the year. You’re participating in our Predict 2019 panel, which will be December 18th event. You’re gonna be on the AIOps panel, looking ahead. Why don’t you give us a sneak peek? What’s kind of your take on what 2019 holds for AIOps and big data and so forth, Kunal?

    Agarwal: Well, yeah, Alan. So AIOps is an evolution of IT Ops or APM or DevOps, where you’re using machine learning to, again, understand all of the data – and this could be monitoring data, instrumentation data – that all these systems and applications are generating to draw insights from.

    Now, funnily enough, this is what our customers do with their data set, right? So with some of the biggest banks, some of the biggest insurance companies, some of the biggest health care companies, all Fortune 500. And our methodology of going about monitoring for big data stack was always the same, which is “Why aren’t we using big data technology on our data set, which is machine-generated data, to glean those insights and drive some prediction and actually make things simpler and more accurate?”

    So AIOps is also one of the use cases of artificial intelligence and machine learning. Now, just as I’ve said the industry’s evolving, what we predict to see is the evolution of AIOps, so Unravel, for example, is already on one of the end-of-the-spectrum places, where we actually make decision on behalf of the operations and the development teams, whether it is re-evaluating an application, whether it is making sure that your SLAs for your applications are being met, by moving low-priority jobs to a sub-optimized queue and high-priority jobs to a priority queue or killing bad applications in the cluster, all on your behalf, to make it more proactive.

    But what I predict is there’s gonna be an evolution in just the incumbent APM companies as well, where it’s not just about giving people a monitoring screen or even a native monitoring screen and saying, “Hey, check out all the information we know about an application,” but then I leave it up to you to decide and understand what’s amiss, what’s wrong, and how do you fix it. But I feel we’re already now in the correlation and the insights phase, which is now I can start to connect the dots, with these new software technologies that are out there. But, in 2019, we’ll start to also see some of these companies take the leap to be able to do automated root cause analysis, as well as guided remedies or automatic solutions, to get out of these problems as well.

    This industry’s evolving at a very fast pace, so I’m super excited. And it’s all about making sure that some of the biggest applications in the world, which millions of people actually rely on, all work like a well-oiled machine. And it’s all about guaranteeing reliability, which, at the end of the day, improves confidence of the customers using those products, which further fuels more innovation and more growth. So it’s an amazing cycle and AIOps is gonna be a very, very key part of it.

    Shimel: No doubt about it. No doubt about it. You know, in many ways, I look back on 30 years in IT and it really is a golden time to be alive, if you’re a developer or ops person or just in IT in general. Right? There’s the possibilities and the tools, and what’s in front of you is so exhilarating, right? I mean, I think back, if I was 20 years old now, 22 years old, coming into the –

    Agarwal: So you mean like 10 years ago, Alan?

    Shimel: Yeah, something like that. About 10.

    Agarwal: Okay.

    Shimel: About 10. And, I mean, just unlimited opportunity. I mean, that’s kinda almost the way I look at it. And, of course, it’s companies like Unravel, right, that are kinda letting these opportunities take shape and packaging them for people to run with. So great stuff. Specifically, Unravel – we only have a couple moments here left, but – so, Kunal, anything on the horizon with Unravel you wanna share with our audience?

    Agarwal: Yeah, Alan, absolutely. So, even in big data technologies, there’s so many to cover. We started our life off supporting Spark, Kafka, the entire Hadoop stack, some NoSQL systems, like HBase and Cassandra, and some newer NPP platforms. In 2019, we’re gonna further expand some of those technologies and systems that we cover, especially as we start to see more and more big data workloads move to the cloud.

    We’re also seeing a lot of our companies demanding a hybrid real estate management from the cliched “one pane of glass,” that “Can I see everything that’s in my big data environment, whether that’s on premise and on the cloud, together?” So Unravel is launching that support as well.

    And, last but not least, we are also creating a solution, from our product, which is directed towards helping companies move from their on-premise environments to cloud environment. So actually using Unravel as a migration project management tool, to help you assess, migrate, and then validate your migration. And, on the assess side, figuring out “What system should I get? Which instance type is best for my workloads? How can I keep under cost? What is the cost of running my big data workloads on the cloud?” to then validating and making sure that your SLAs are met, that you’re under cost and under time, and everything is flowing like a well-oiled machine.

    The way we look at it, Alan, again, the way to look at our road map and anything on the horizon is we are here to help our customers in the entire journey of big data tech, so, whatever they’re deploying today and they wanna use tomorrow, Unravel will be supporting that. And this is a natural evolution where companies are going from trying something out to getting something in production, first starting on premise and then going to the cloud, and those are all the shifts and transition points that we wanna hold the hands of the customers that we work with.

    Shimel: Excellent. Excellent. Well, Kunal, thanks for spending a few moments with us. As I told you, the time goes quickly.

    Agarwal: Yeah.

    Shimel: We’re way over time, but it’s okay. Hopefully, people have stayed on till now to listen. I wanna wish you lots of continued success with Unravel. We’ll be checking in on it. Again, a reminder: Kunal will be on our December 18th Predict 2019 virtual event and Kunal will be participating in the CEO panel, taking a look ahead at AIOps in 2019. So join us. You can register for that at predict2019.com.

    Agarwal: Thanks, Alan.

    Shimel: Thank you. Hello to all of our friends at Unravel. And that’s gonna make a wrap on this episode of DevOps Chat, everyone. This is Alan Shimel for DevOps Chat, devopsy.kinsta.cloud. Have a great day.

    — Alan Shimel

  • The Value of APM in Application Building and Management

    The Value of APM in Application Building and Management

    There are literally billions of smartphone users on the planet. Many of these users interact with apps on a daily basis. With all of the competition in the app market, developers have to stay on the cutting edge of technology to keep their programs both functional and popular.

    It is imperative that you adequately monitor your app after it has launched. Getting an idea of how well your app is performing can alert you to issues that may need to be addressed. Reading articles such as, “What is application performance management? 10 APM features” is an excellent way to wrap your mind around this concept.

    The following are just some of the things you need to know about app performance management and what it can do for your programs.

    Launch and Resume Times

    When trying to get a handle on how well your app is performing, be sure to focus on both the start and resume time users are experiencing. In most cases, startup will take much longer than resume time if the app is continuously running in the background.

    Both launch times affect the user experience in a significant way. If startup and resume times are getting increasingly slower, chances are your app needs a bit of retooling to keep up with your user’s needs.

    UI Response Times

    In the past, app developers would use network request times to gauge how fast users could submit and complete actions on their program. However, users only care about how fast their action completes, now how fast the network actually responds.

    When measuring UI response times, do so according to the device or OS the user is working with. This will allow you to:

    • Focus more on individual platforms and the problems they may have.
    • Respond to performance issues on a case-by-case basis.
    • Develop solutions for these problems in an easy and comprehensive way.

    When measuring UI responses times, be sure to rank the tasks by importance. By focusing on the issues that will affect user experience, you can keep your app running efficiently. Focusing first on tasks that don’t really matter will lead to the user experience suffering as a result.

    Monitoring App Crashes is Crucial

    Crashing apps are bad for both you and the user. Not only will they result in a lower user experience, app crashes also mean an increased amount and lost revenue for you. When your app crashes, you need to look at all angles to figure out why this happened and what can be done to fix it.

    Did this user’s actions cause the crash? What types of crashes are affecting UI? The answers to these questions will help you diagnose and prevent future issues. Having an adequate error logging system in place will allow you to get in-depth information when crashes occur. This information will help you fix issues in a hurry and avoid excessive app downtime.

    Helpful Tips and Tricks That Make Application Monitoring Easier

    Now that you know what types of things you need to be monitoring, you will have to figure out how to make application performance monitoring (APM) work for your company. Ideally, you want to provide users with apps that are both easy to use and reliable. If you are developing apps for your employees, you need to ensure they are able to boost productivity.

    By adequately monitoring your applications, you can find and address issues that exist with ease. Closely monitoring your apps will also give you a better understanding of how users are interfacing with them.

    Here are some of the things you should keep in mind when trying to put an app monitoring plan in place:

    Decide Which Apps Need to be Monitored First

    The first decision you have to make during this process is which apps you want to monitor. If you are monitoring the apps you provide to your employees, pick the most popular ones get metrics from. Are you unsure about what apps your employees use the most? If so, you need to get them to weigh in on this important decision.

    Often times, employees will be able to provide you with an outside perspective. With this perspective, you can clearly define the parameters of your application performance management plan. Neglecting to get this type of guidance may lead to you monitoring apps that are rarely used, which is a waste of time and money.

    What Critical Transactions Will You Monitor?

    To figure out what type of app transactions  you will monitor, you have to put yourself in the mindset of the end user. By doing this, you should be able to create a map of user functions. Once you have this map in place, you should be able to easily see what types of transactions you need to monitor.

    If you are monitoring an app you have given to employees, you need to map out workflows. Is the app in question making them more productive? If employees or users are having to go through too much hassle to access common functions, you have to work on streamlining your app. While this will take a bit of trial and error, it is definitely worth the effort.

    Polling Frequencies and Alerting Policies

    Adequately monitoring key transactions within your app allows you to identify performance problems earlier. When things such as threshold violations occur, you need to determine who should be alerted. Not only will you need to set alerting policies, you also need to figure out how many times a certain violation needs to happen before you send out an alert.

    Setting the violation count too low can lead to false alarms, setting it too high can put the functionality of your app in jeopardy. By taking control of your app’s monitoring, you can avoid user issues and crashes.

    Custom Reports are a Good Thing

    The performance reports you provide shareholders, employees or investors should be tailored to their needs. In most cases, investors and shareholders will only be concerned with how much productivity and capital an app is generating. This is why you will need to avoid giving them app performance reports with in-depth error reports on them.

    Generating detailed reports for employees with the various error messages an app is generating is crucial. Providing your team with this information can make it much easier for them to address ongoing app issues. Failing to get help with the monitoring and maintaining of your app can lead to a number of problems in the future.

    Create a Centralized IT Response to Deal with App Performance Issues

    While closely monitoring how your app is performing is important, you will need a system in place for dealing with the problems this monitoring can discover. Oftentimes, large businesses will have multiple apps in use at any given time. This is why having the right team and response plan in place is so important.

    Even the slightest misstep can lead to an app becoming unreliable and unusable. The information you get through monitoring the performance of an app can help you nip problems in the bud before they cause any real damage. The last thing you want to do is ignore signs of app trouble due to the serious issues it can cause.

    Keeping Everyone in the Loop is Vital

    Some business owners think that app performance monitoring is a solo sport. Usually, this attitude will cause a variety of missteps that will make an app less useful and more problematic. To use the data from APM properly, a business owner will need to involve their entire team. With all hands on deck, a business owner can delegate certain parts of the app monitoring process to various team members.

    Not only will this take a lot of stress off of a business owner, it will make this process more successful. In most cases, business owners who attempt to handle the app monitoring process alone will become overwhelmed and will make crucial mistakes as a result.

    Use App Performance Data to Optimize a Program

    One of the biggest misconceptions about app performance monitoring is that it can only be used to find functionality issues. The reality is that this data can help you see how to make your app more useful to employees or consumers. Failing to constantly improve and optimize the apps you have can lead to them becoming obsolete. In the world of technology, you either roll with the changes or the changes roll over you.

    Embrace the Power of Technology

    Creating a competitive edge should be one of the main concerns you have a business owner. Utilizing the power of technology is a great way to make your company unique. By providing both employees and consumers with useful apps, you can stay on an upward trajectory.

    The time and effort you put into adequately monitoring app performance will definitely pay off. If you are unsure about how to start the app monitoring process, reach out to an IT professional for help.

    — Wendy Dessler

  • Riverbed Throws Down APM Gauntlet

    Riverbed Throws Down APM Gauntlet

    Riverbed Technology has expanded its approach to unifying application performance management (APM) and user monitoring based on a new architecture for its SteelCentral platform, now capable of supporting tens of thousands of agents monitoring billions of transactions per day.

    Nik Koutsoukos, vice president of product marketing and product management for Riverbed, said auto-tuning and data compression mechanisms combined with cluster architecture now makes it possible to analyze all the data in the enterprise to determine precisely where bottlenecks are adversely affecting user experience.

    In contrast, rival APM offerings only sample transactions and sacrifice metadata as well as depth in terms of being able to delve into a complete stack of software and associated IT infrastructure, he said.

    Koutsoukos noted the way APM is being applied will fundamentally change as organizations embrace digital processes. Most organizations today apply APM sparingly across a limited number of mission-critical applications. But as business processes become digitized, customer satisfaction increasingly will be determined by the quality of the application experience. That can’t be accurately determined without being able to leverage a set of software-as-a-service (SaaS) applications capable of monitoring the entire IT environment, he said.

    Riverbed, with this release of SteelCentral, is also adding analytics infused with artificial intelligence capabilities, as well as machine learning and predictive analytics to keep track of transaction trends over time. This release introduces a “Prism” report that analyzes longitudinally at the conversion funnel for a business transaction flow to visualize trends over time, spot issues and then resolve associated problems.

    In addition, Riverbed is adding support for Riverbed Xirrus Wi-Fi access points, which the company acquired last year, to the SteelCentral platform.

    Industry research suggest that only 5 percent of enterprise applications are actively monitored, Koutsoukos noted, but Riverbed is expecting that to change in a digital age where IT essentially has become the business. More senior business executives are soon going to be equating application performance with customer engagement and, by extension, opportunities to generate revenue.

    Riverbed expects that monitoring all those distributed applications and associated IT infrastructure will be possible only by using a set of software-as-a-service applications, which Koutsoukos said in many cases will pay for itself by eliminating the need for various application and infrastructure monitoring tools in silos across the enterprise.

    Given the relative light adoption of APM tools, the rise of digital business may provide an unexpected benefit for DevOps teams. As line-of-business managers demand more insight into the IT environment, the amount of metrics that should become available to DevOps teams should correspondingly increase. The challenge may lie in educating business managers why those metrics are relevant to them and then getting them to fund their acquisition.

    In the meantime, DevOps teams should be prepared for a lot more questions relating to application performance coming from business managers. Not every one of those questions might be all that informed. But over time, an educated business executive always makes for the best DevOps customer.

    — Mike Vizard