Tag: apm

  • What It Really Takes to Run OpenTelemetry

    What It Really Takes to Run OpenTelemetry

    OpenTelemetry solved a real problem. Before it, every APM vendor had you install a proprietary agent, which meant switching vendors meant re-instrumenting everything. OTel gave engineering teams a vendor-neutral way to generate traces, metrics, and logs once and send them wherever they wanted.

    That part of the pitch is true, and open-source deserves credit for it. What gets left out of most OTel adoption conversations is what happens after the SDKs are wired up. The framework is free. Running it well is not.

    The Pain Points That Show Up After Rollout

    Collector sprawl. A production OTel deployment usually means running collector instances per region or per cluster, tuning batch and memory limiter settings, and watching for the collector itself becoming a bottleneck under load. This is the infrastructure your team now owns and patches, on top of the infrastructure it was supposed to help you monitor.

    Storage and retention decisions become your job. OTel defines how telemetry is generated and transported, not where it lives. Teams end up choosing and operating a backend, commonly a trace store, a time-series database (TSDB) for storing and querying metrics over time, and a log index, then building the queries and dashboards to make that data usable. Every version upgrade across that chain is a coordination exercise.

    Cross-signal correlation requires continuous engineering. Traces, metrics, and logs arriving in three different systems does not automatically mean an engineer can jump from a slow span to the exact log line or the query that caused it. Building that correlation layer, and keeping it working as schemas evolve, is ongoing engineering work, not a one time setup.

    The on call burden shifts internally. With a managed platform, a vendor’s SRE team is paged when ingestion breaks. With a self-run OTel stack, it’s usually the same engineers who were supposed to be using the telemetry to fix application problems, not maintaining the pipeline that delivers it.

    Upgrade churn. OTel semantic conventions and SDKs still move quickly. Staying current across every instrumented service, especially in a polyglot environment, is recurring work that never shows up in a headcount plan but consumes real hours every quarter.

    None of this means self-managed OTel is a bad choice. For teams with the platform engineering capacity to run it well, and a real need for full control over the pipeline, it’s a legitimate architecture. The honest accounting is that free software still has a labor cost, and that cost scales with the number of services, languages, and regions you’re instrumenting.

    Where the Labor Actually Goes

    Ask any team that’s run this for two years and the pattern is consistent. Initial instrumentation is the easy part. The ongoing cost lives in three places, keeping collectors healthy under changing load, keeping the backend’s storage and indexing performant as volume grows, and rebuilding correlation logic every time a service boundary changes.

    That last one matters most for incident response. A trace showing high latency in one service tells you where. It doesn’t tell you whether the cause was a missing database index, a downstream API timeout, or a resource constraint on the host. Getting from where to why usually requires stitching context across systems that weren’t designed to talk to each other, which is exactly the work a managed backend takes off your plate.

    What a Converged Platform Changes

    ManageEngine’s OpManager Nexus accepts OpenTelemetry data natively. Teams keep their existing OTel instrumentation and export traces, metrics, and logs directly to the platform without operating a separate collector and storage layer. The platform handles ingestion, correlation, root cause analysis, real user monitoring, and anomaly detection on top of that same OTel data, so the instrumentation investment a team already made doesn’t get thrown away.

    That’s the actual trade being made. You keep the vendor-neutral instrumentation layer that makes OTel valuable in the first place. You hand-off the operational weight of running collectors, tuning storage, and building correlation logic, which is the part that consumes engineering hours long after the initial rollout is done. But that trade isn’t free of its own limits.

    Where Self Hosting Still Wins

    Teams with mature platform engineering practices, a specific compliance reason to own the storage layer, or deep enough Kubernetes native maturity that a collector fleet is just another workload they already know how to run, will find a managed backend more constraining than a stack they built themselves. Sampling logic, retention policy, and pipeline level customization go deeper in a self-hosted setup than any managed platform will expose. The community exporter and processor ecosystem around OpenTelemetry is also larger than what a single vendor surfaces natively, simply because it’s not bounded by one company’s roadmap.

    So the decision isn’t open-source versus managed, it’s where you want your engineering hours to go. Every team instrumenting with OTel already made the right call on the instrumentation layer. The question worth revisiting is whether the collector, storage, and correlation work sitting underneath that instrumentation is still the best use of the team’s time, or whether it’s become a second job nobody signed up for.

    If you’re already running OTel instrumentation and want to see what happens when that same data feeds into a platform that handles ingestion, correlation, and root cause analysis for you, setup OpManager Nexus within minutes without re-instrumenting anything you’ve already built.

  • Unlocking Accountability: How Real-Time App Monitoring Empowers Engineering Teams

    Unlocking Accountability: How Real-Time App Monitoring Empowers Engineering Teams

    In today’s fast-paced software development environment, traditional infrastructure monitoring is no longer sufficient. As engineering teams take on more responsibility for code ownership and software quality, the need for comprehensive real-time application monitoring becomes crucial. This isn’t just an addition to standard infrastructure checks; it’s a fundamental shift toward a more accountable and empowering engineering culture.

    A Case for “Real-Time Application Monitoring?”

    Infrastructure monitoring is ubiquitous, and we’ve gotten really good at monitoring the health of our servers, our containers and our data stores. APM tools have come a long way and give us insights into how pieces of our code perform from a speed and error context.

    At the same time, the business side of the house is monitoring things like traffic, leads, conversions and an important performance metric—sales. However, for most businesses, this monitoring is rarely in real-time, and visibility gaps are created in the spaces between where problems are introduced, discovered and resolved.

    Let’s look at a concrete example using an auction marketplace. Core to this business is the ability for users to place, accept and pay for accepted bids. The business probably looks at these metrics on a daily basis, at best. What if a delivered change to their application broke and removed the ability for users to conduct one of these actions?

    Placing a bid probably has a “normal” volume pattern, and a change could impact this in a positive or negative way. If the volume of bids drops after a deployment or even spikes, what happens? How quickly can that change be reported, seen and acted upon, if necessary? How quickly can they get back to “normal” before a customer reports it or before the rest of the business notices?

    If this business is limited to once-daily monitoring, how quickly can they realistically expect their engineering team to be able to identify and remediate such an issue?

    How valuable would it be to the business if their engineering team could instrument these metrics with their own real-time tooling?

    Key Metrics for Trust and Satisfaction

    Customer trust and satisfaction are critical for any software product. The most obvious indicator of customer satisfaction is churn–the retention rate of your customers. This metric, while influenced by various factors, remains a vital sign of how well we are doing. At Stoplight (acquired by SmartBear in August 2023), we focused on reducing customer bug reports. A spike in these reports prompts an immediate investigation into the root cause. It’s about understanding what changed and how to address it.

    Moreover, new customer acquisition isn’t just about retention; it’s also about word-of-mouth referrals. Satisfied customers often become your best advocates. Thus, keeping an eye on churn rates and incoming bug reports and setting realistic targets for these metrics is crucial. It’s about balancing resource allocation without striving for impractical perfection.

    Net Promoter Score (NPS) scores, although often dreaded by customers, are a critical metric. As engineers, we might dislike them, but they offer a holistic view of user satisfaction. If you’re deploying daily and consistently breaking things, expect your NPS scores to reflect that.

    We can also demonstrate real-time ROI of real-time application monitoring in a security context using login successes and failures. Tracking the volume of these activities in our engineering tools allows us to quickly identify and assess the threat of anomalous behavior. Did the rate of successful logins drop? Did we break something with a deploy (I’ve broken logins before). What if either successes or failures spike? Are we under attack? How can we mitigate it to protect our users?

    Employee Retention and Developer Satisfaction: Essential in an Era of Real-Time Monitoring

    In the realm of software development—particularly with the advent of real-time application monitoring—employee retention, especially of developers, is paramount. Their deep understanding of the nuances of our applications and their ability to respond swiftly to the insights provided by real-time monitoring are invaluable.

    Maintaining a team of satisfied, engaged developers is crucial in this context. It’s not just about reducing turnover; it’s about fostering a culture where the engineers feel invested in the continuous improvement and success of our products. When developers are genuinely satisfied with their work and their environment, it reflects in the quality of their output. They become proactive in identifying and addressing issues, often before they escalate, thanks to the real-time data at their fingertips.

    The shift toward more dynamic monitoring practices has underscored the need for a supportive, collaborative environment. A culture where developers are encouraged to share insights and take initiative leads to a more responsive and adaptable team. This environment not only supports the technical aspects of our work but also enhances the overall morale and commitment of our developers.

    Engineers will seek out organizations that adhere to better practices. Interestingly, when good practices are in place, developers are more open to being on call. They accept responsibility for their code and their peers’ code as a trade-off for the autonomy and value they can deliver through frequent, quality deployments.

    Starting Small: Embracing the Journey of Incremental Improvements

    The journey to adopting best practices in engineering, such as real-time application monitoring, often begins with small yet significant steps. Reflecting on my past experiences, particularly at a shipping marketplace, the path to continuous deployment was transformative. Initially, we had no automated tests, and the challenges were substantial. However, the commitment to deploy continuously led to an evolutionary process in our practices.

    This approach isn’t just about technology; it’s about mindset. In my earlier days, inspired by the continuous deployment practices I observed in financial institutions, I realized the power of incremental changes. We began with what we had, deploying continuously, and with each step, we uncovered new areas for improvement. It was a process of building our capabilities piece by piece–from integrating automated tests to refining our deployment strategies.

    The essence of this journey lies in its continuous nature. Much like the principles of agile and DevOps, it’s a perpetual process of evolution. You don’t reach a finish line and stop; it’s about relentlessly pushing for betterment, identifying gaps, and adapting to new challenges. It’s about creating a culture where continuous improvement is the norm, where each small step contributes to a larger goal.

    Building a Culture of Continuous Improvement and Excellence

    Adopting real-time application monitoring is more than implementing a new set of tools; it’s about fostering a culture of continuous improvement, accountability, and excellence. In my experience, this cultural shift has a profound impact on every aspect of our work. It’s about ingraining a mindset that constantly seeks to exceed our standards with each release.

    Creating this culture involves a holistic approach to our engineering practices. It’s not just about the technical side of things; it’s about enhancing the collaborative and innovative spirit of our teams. It’s important for engineering leaders to do their part to foster an environment where every team member feels empowered to contribute ideas and take initiative. The ROI of this approach can lead to significant improvements in your team’s processes, as well as a deeper sense of ownership and pride in their work.

    Moreover, this culture of continuous improvement often extends well beyond the engineering department. It can influence the entire organization, encouraging departments like sales, marketing, and customer support to adopt similar principles. By doing so, we create a unified approach to product development, customer service, and business growth.

    Conclusion

    Embracing real-time application monitoring is not just about adding another layer to our development practices; it’s about fundamentally shifting our mindset toward a culture of accountability and continuous improvement. By focusing on key metrics, understanding the psychology of developers, and starting small, we can drive significant improvements in both product quality and employee satisfaction. As engineers, we are in a unique position to influence this change, and it is imperative that we lead the charge in adopting these essential practices.

  • Three Strategies for Reducing MTTD and MTTR as Outage Costs Spiral

    Three Strategies for Reducing MTTD and MTTR as Outage Costs Spiral

    According to a New Relic survey of IT professionals, the median annual cost of IT outages has reached an astronomical $7.75 million. Over one-third of the 1,700 respondents said critical business application outages now cost more than $500,000 per hour. In a business environment where most interactions with customers, suppliers and business partners are conducted digitally, downtime has become a problem and an existential threat.

    Most IT organizations carefully monitor two key metrics — mean time to detection (MTTD) and mean time to resolution (MTTR) — to track their success in identifying and remediating critical systems issues. The figures represent, respectively, the average time it takes administrators to identify that a problem has occurred and to remediate the underlying issues. They serve as a benchmark for understanding the organization’s level of awareness of the status of its systems and the speed with which problems can be diagnosed and acted upon.

    There are many ways to improve performance against these metrics, but three stand out as the most effective, as evidenced by New Relic and the survey results.

    Monitor Everything

    The less you know about a problem, the longer it takes to diagnose and fix. The New Relic survey measured 17 different observability categories, such as network monitoring, alerts, log management, browser monitoring and distributed tracing. Across the board, about two-thirds of the companies that used even one of those monitoring tools reported reduced MTTR, with many saying resolution times had fallen by more than 25%.

    One-third of respondents whose organizations implemented full-stack observability—which is the ability to see everything in the tech stack that could affect the customer experience—reported the fewest outages, fastest MTTD and MTTR, lowest outage costs and highest median annual return on investment compared to all respondents. For example, those who have full-stack observability experience a median outage cost that is 37% less than those without.

    As the complexity of enterprise technology stacks increases, so does the difficulty of pinpointing the root cause of an outage. Any monitoring is better than no monitoring at all, and the more visibility you have into applications and infrastructure the faster you can identify and resolve incidents. Strive for full-stack observability around integrated observability data and a comprehensive dashboard.

    Have an Incident Management Action Plan

    The worst time to figure out how to resolve a problem is when you’re in the midst of a crisis. Organizations with mature observability practices also have extensive and documented response plans.

    Your incident plan will be unique to your organization. Small companies and startups tend to have ad hoc response strategies based on the skills within the organization. Large enterprises may use a more formal methodology like IT service management that defines strict procedures and protocols. Companies that have embraced modern DevOps and Lean principles often use a hybrid approach that depends heavily on teamwork and collaborative problem-solving. All of these approaches can work if the team fully understands the chosen strategy.

    Document your IT architecture, identifying known vulnerabilities and outlining procedures for responding to the most common types of incidents. Plans should cover obvious disruptions like fires and power outages, but you should also think about “unicorn” scenarios such as a rogue query that ties up a database server or a communication outage at a key supplier. Mature observability teams devote a portion of their resources to constantly testing new and unpredictable scenarios and use chaos engineering to randomly inject problems in a controlled manner to see if systems respond as expected.

    As you develop incident response procedures, document the processes in runbooks, which tell responders exactly what to do when a specific problem occurs. This not only creates a database of organizational knowledge about response strategies but also helps with onboarding new employees and covers for skills gaps that occur when team members are unavailable or leave the company.

    Fix for the Future

    Technical debt is a long-term obligation that is created when a short-term – and incomplete – solution is applied. You should aim to minimize it in your observability operation.

    When a problem occurs, the temptation is to fix it as quickly as possible. Human nature is to move on to the next task without taking the time to go back and understand why a problem occurred. “Quick and dirty” fixes are an invitation to larger problems in the future. Your observability plan should include a forensics stage that documents root causes and the fixes that were applied. Even if it isn’t convenient to implement a long-term solution immediately, the documentation serves as a guide for implementing a permanent fix down the road.

    Building a resilient IT architecture is a marathon, not a sprint. The more rigor you apply to identifying and resolving problems when they happen, the better prepared you will be to prevent their reoccurrence and the more informed your team will be about the resources they manage. Reducing your MTTD and MTTR will not only improve the bottom line of your business, it will ensure that your customers have an amazing digital experience.

  • New Relic Extends AI to Identify Alert Coverage Gaps

    New Relic Extends AI to Identify Alert Coverage Gaps

    New Relic this week added additional artificial intelligence (AI) capabilities to its observability platform that make it possible to detect and resolve alert coverage gaps.

    Camden Swita, a senior product manager for New Relic, said it’s not uncommon for DevOps teams to discover an issue that the existing alerts they put in place were not designed to address. New Relic is adding machine learning algorithms at no additional cost that are designed to identify anomalies indicative of those potential issues. The platform then surfaces recommended alerts that DevOps teams can apply or further customize as they see fit, he added.

    Those machine learning algorithms ensure DevOps teams are tracking the right thresholds to ensure there are no blind spots that could adversely affect application performance, noted Swita.

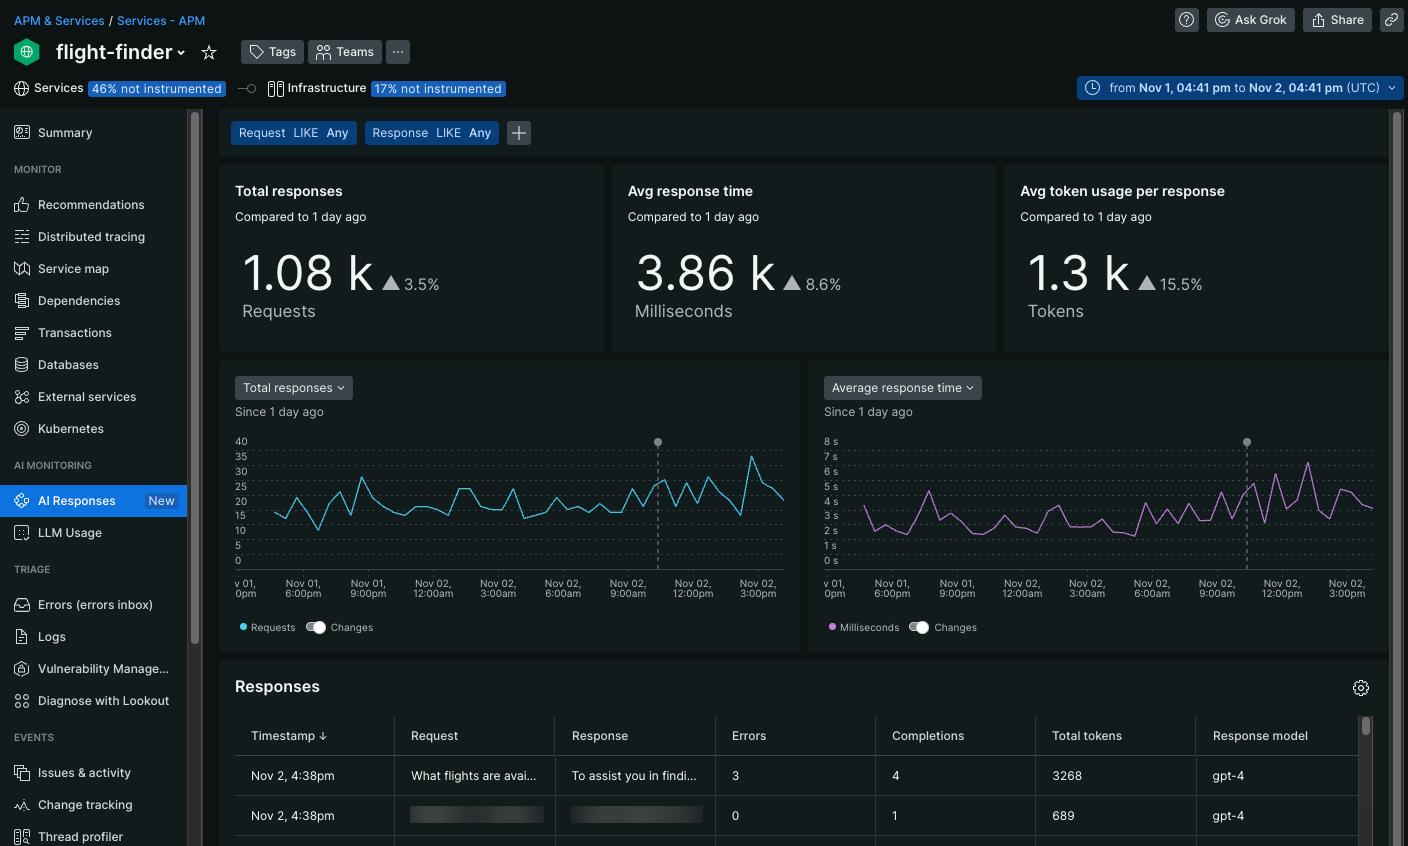
    New Relic is employing both predictive and generative AI to enable DevOps team to detect and resolve issues faster. The company has been using machine learning algorithms for predictive AI for several years and, more recently, started providing early access to a generative AI tool dubbed Grok.

    The overall goal is to make the capabilities of an observability platform more accessible, Swita said. This is accomplished by surfacing issues without requiring a software engineer to craft intricate queries to interrogate metrics, logs and traces, he noted.

    The AI capabilities also serve to reduce the amount of alert noise; it’s now possible to more easily understand the root cause of an issue and reduce the total number of alerts that might otherwise be sent, he added.

    While there’s no doubt AI will help democratize DevOps by making it possible to write scripts and better manage workflows, it might be a while before DevOps teams trust the recommendations made. AI models typically require some time before they understand how an IT environment functions, and not every initial recommendation may be valid. In time, however, DevOps teams will find themselves increasingly supervising processes that AI models are executing.

    In addition, there are competing approaches to building large language models (LLMs) that drive generative AI. For example, it’s not clear whether chaining LLMs together will be more efficient than creating a single large ‘parent’ LLM that has ‘child’ relationships with smaller LLMs, noted Swita.

    In the meantime, DevOps teams would be well-advised to list tasks that are likely to be automated by AI models. Many of them will tend to be manual tasks that most software engineers don’t especially relish, so in that regard, there’s naturally a lot of interest in AI. It remains to be seen, however, whether various forms of AI might one day automate an entire DevOps workflow. In fact, most DevOps engineers are going to set a high bar for AI models that, at the very least, will be expected to perform a task as well as humans before it’s trusted completely.

  • Is Your Monitoring Strategy Scalable?

    Is Your Monitoring Strategy Scalable?

    Every company is trying to get better insights into its operational effectiveness, and they are running into the same problem: Scale. So what does a scalable monitoring strategy look like and how can you safeguard against the most significant issue in observability?

    What is a Scalable Monitoring Strategy?

    We’ll begin by identifying the two things most impacted by scale: Cost and performance. Cost can be broken down into storage and computation. It is obvious that to hold more data, more storage is needed, but what about compute power? This is important because queries need to search through more data—and thus, use more compute power—to return a result.

    This creates a trade-off between performance and cost-effectiveness. It becomes more and more challenging to have queries that resolve instantly as the dataset increases, so engineers will often simply tolerate a performance decline. This further impacts usability and the general usefulness of the system. If it takes 10 seconds to resolve every query, you’ve just cut down your data discovery efficiency by a factor of 10.

    Scaling Means Performance and Cost-Effectiveness

    To scale a monitoring strategy, a wise architect needs to break this standoff between performance and cost and approach the problem like a data scientist. A scalable monitoring strategy starts with a simple question: What is the use case for this data?

    Some data is only ever ingested because it might be needed. It spends its entire lifetime undisturbed and is eventually compressed or deleted. On the other hand, some data is queried every minute of every day and is integral. Knowing how data is used means an engineer can decide the value of that data.

    In the battle to create a scalable monitoring strategy, there’s a three-step approach.

    Step One: Track Data Usage

    Which data is ingested and never queried? Which data never spends any time at rest? Build a map of how often data is consumed so that any strategic choices are informed by the use case.

    It is most common to group data into three different use cases:

    Frequent Access – Data that is constantly queried and needs to be available at a moment’s notice.

    Monitoring – Data that drives dashboards or trains machine learning models but which is largely useless after it has been processed.

    Compliance – Data that is held in case it is needed, but it is only queried sometimes. For example, audit logs.

    Step Two: Optimize Storage and Consumption

    Once the use case of data—whether it’s logs, metrics or traces—is understood, the next stage is to optimize. This means creating different storage and query solutions for the different usages we’ve seen above.

    Frequent Access – Rapid queries that can be optimized and tuned. OpenSearch is a good option, although management overhead can be painful, especially at scale.

    Monitoring – This is largely about transforming data. For example, ingesting logs, converting them into metrics and deleting the original log. This is very powerful because metrics take up far less space than logs and can be stored much more cost-effectively.

    Compliance – Low-cost storage like Amazon S3 is a good option, but this data must still be accessible, even if simply by reindexing.

    How Easy is it to Build These Capabilities?

    It is trivial to create an OpenSearch cluster, but it’s challenging to manage it at scale. Likewise, it’s simple to convert logs to metrics, but doing so in a performant way at scale is complex. Holding onto compliance logs as they scale near infinitely can be difficult, and reindexing this data is a non-trivial operation when dealing with large data volumes.

    However, the key takeaway from this analysis should be that these are capabilities that any organization should have if they intend to scale their monitoring solutions. If they can be attained through a SaaS vendor, then this is a serious option to consider because it enables companies to immediately take advantage of this capability without the upfront, unpredictable and often ongoing cost of in-house engineering.